
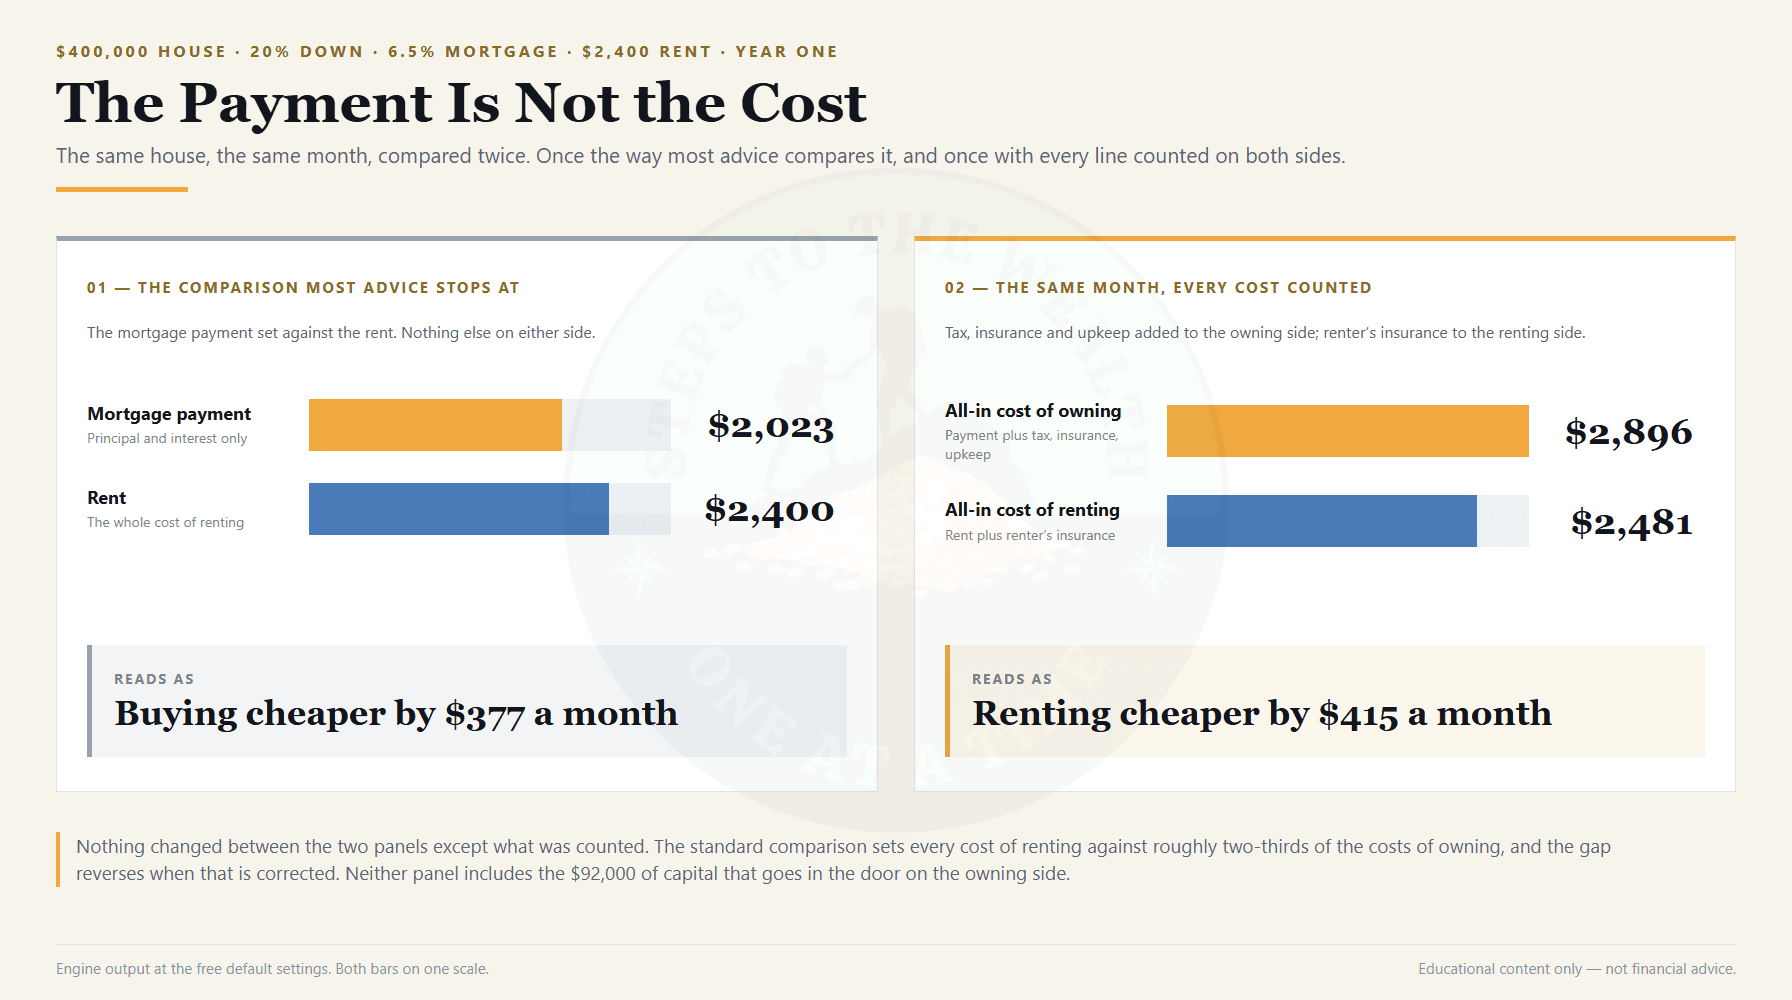
Almost every rent-versus-buy conversation ends at the same comparison. The mortgage on the place you are looking at would be $2,023 a month. The rent on the equivalent unit is $2,400. You are paying $377 a month for nothing. Therefore, buy.
That comparison is wrong. Not slightly wrong, and not wrong in a random direction — wrong in a consistent one, always flattering the same answer.
This is not an article arguing that you should rent. It is an article about a comparison that does not compare what people think it compares.
The rent vs buy question is not the mortgage against the rent. It is every cost of owning, including the ones that build no home equity at all, set against every cost of renting. This piece works through the full comparison, with each component shown.
Rent vs buy: the payment is not the cost
A mortgage payment is one line in the cost of owning a house. It is simply the line that gets a bill with your name on it.
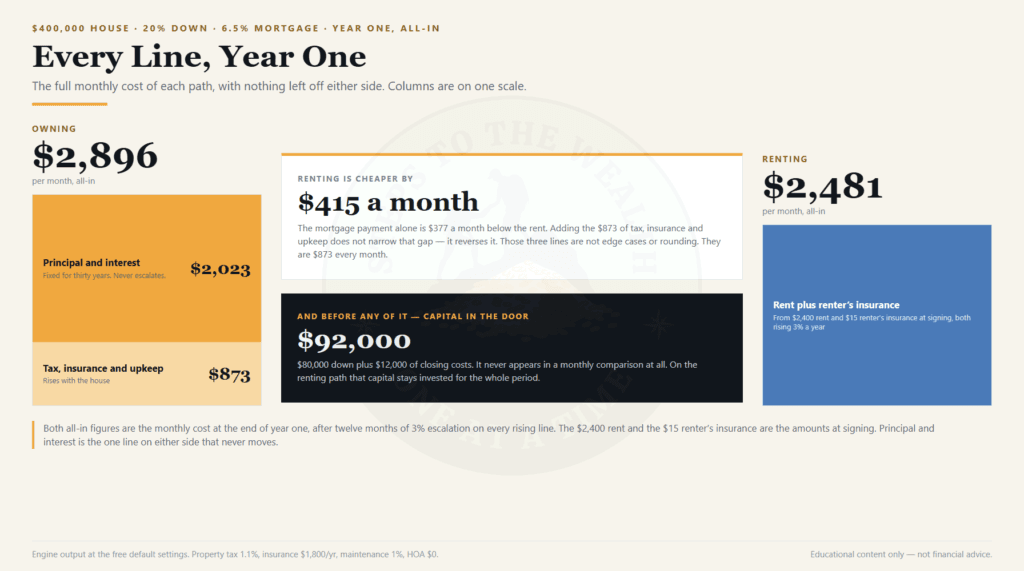
Here is the same $400,000 house, at 6.5%, with every line included. Year one, monthly:
| Path | Monthly, all-in | What is in it |
|---|---|---|
| Owning | $2,896 | $2,023 principal and interest, plus property tax, insurance, maintenance |
| Renting | $2,481 | $2,400 rent and $15 renter’s insurance, both at signing |
Both all-in figures are the monthly cost at the end of year one, after twelve months of 3% escalation on every rising line. The $2,400 rent and the $15 renter’s insurance are the amounts at signing, which is why they do not add to $2,481. Principal and interest is the one line on either side that never moves.
Read that against the comparison at the top of this page.
The mortgage payment is $377 below the rent. The actual monthly cost of owning is $415 above it. The gap did not narrow — it reversed. And nothing exotic did that. Property tax, insurance and upkeep are not hidden costs or edge cases. They are ordinary, predictable, and they arrive every month whether or not anyone sends you a statement that calls them a housing cost.
This is the whole reason the standard comparison misleads. It puts every cost of renting on one side of the ledger and roughly two-thirds of the costs of owning on the other.
And that is before the $92,000
The monthly comparison is only half of what is missing. The other half went in the door on day one.
- Down payment: $80,000
- Closing costs: $12,000
- Capital committed up front: $92,000
The renter does not have a house. The renter also does not have a $92,000 hole. That money exists, and it does something.
So the honest version of the question is not “mortgage or rent.” It is: one person buys a house and pays the all-in carrying cost of owning it. The other person rents the same house, invests the $92,000 they did not put down, and invests the monthly difference whenever renting is cheaper. Ten years later, who has more?
That question has an answer. It is just an answer nobody can produce in their head, because it requires running both paths month by month, net of selling costs and capital gains tax.
Ten years later
On the settings the tool loads with:
| Net worth renting | $267,177 |
| Net worth owning | $234,644 |
| Renting ahead by | $32,533 ($24,208 in today’s money) |
And the part I did not expect the first time I ran it: on those defaults, buying never catches up. Not in ten years. Not in fifty.
That result deserves care, because it is the one people react to hardest, and the reaction usually assumes I am arguing something I am not. So: that is not a verdict on buying. It is what a specific, deliberately neutral set of assumptions produces. Sit with it before you decide it is wrong — and then read the next two sections, because the reason it happens and the thing that overturns it are both more interesting than the number itself.
Where ten years of owning went
Itemised, the same decade of ownership looks like this:
| Line | Amount |
|---|---|
| Mortgage interest | $193,998 |
| Property tax | $51,131 |
| Maintenance | $46,483 |
| Insurance | $20,917 |
| Carry that buys no equity at all | $312,529 |
| Principal repaid — becomes equity, not a cost | $48,716 |
| Equity recovered on sale in year 10, after 6% selling costs | $234,029 |
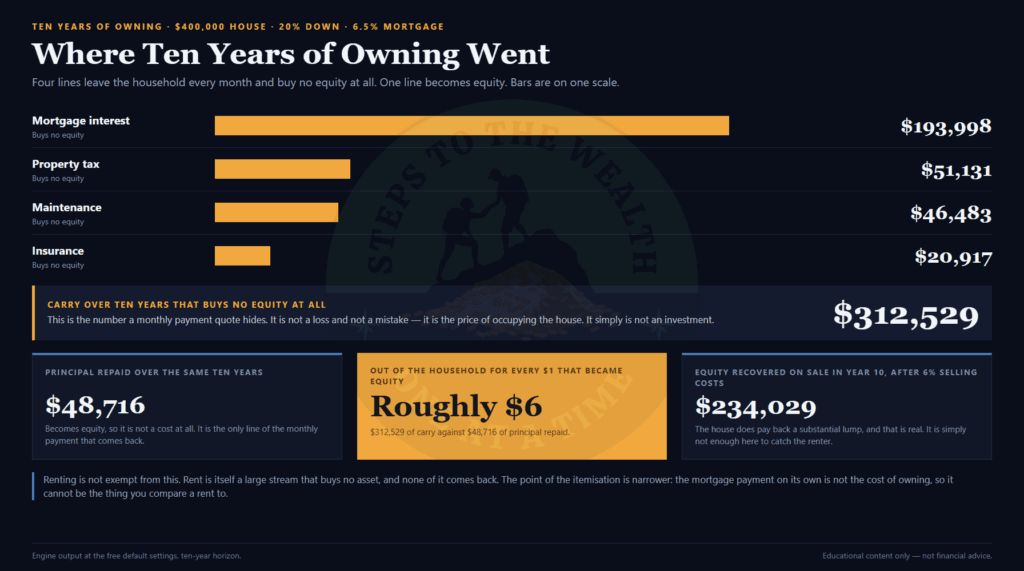
Roughly six dollars left the household for every one that turned into equity.
This is worth stating precisely, because it is the point where the usual slogan breaks. “Rent is money gone” is true. Rent is money gone. The slogan’s problem is not accuracy — it is that it implies the alternative is money kept, and $312,529 of the owner’s decade is also money gone. Both paths have a large stream of spending that buys no asset. Owning has a smaller one than the total it commits, which is exactly why it can win. It just does not win automatically, and it does not win here.
The house does pay back a real lump: $234,029 of recoverable equity after selling costs. That is a serious number and it is not being hidden. It simply is not enough, on these assumptions, to catch a renter who invested $92,000 for a decade and kept investing the monthly difference.
“Never” is a refusal to forecast, not a prediction
The single input doing the most work in that result is house appreciation, set to 3% — the inflation rate. In real terms, the house appreciates at zero.
That sounds pessimistic. It is the opposite: it is the tool declining to have an opinion.
Go and open the advanced settings panel on almost any other rent-versus-buy calculator. Most of them ship 4% to 6% appreciation in there, collapsed, where nobody looks. That one default does most of the work of producing the answer, and the answer it produces is “buy,” and the reader never sees the assumption that decided it. The tool looks neutral. It is not neutral.
For a calculator to tell you that buying wins, someone has to have entered a forecast of the housing market. If the calculator entered it for you, you are reading their forecast, not your arithmetic. You can set that assumption yourself in the rent vs buy calculator.
So the default here is real appreciation of zero, which is not a claim that housing will stagnate. It is a claim that I do not know what your metro does over the next ten years, and neither does anyone who has ever told you they do. If you believe the number should be 5%, change it — the field is right there, and the result at 5% is in the next section. What you cannot do is have the forecast made for you silently and then call the output an unbiased answer.
That is the whole design philosophy: the tool will not smuggle in an opinion and hand it back to you as arithmetic.
The lever with the most leverage
Now the useful part, which is not the headline number at all.
Same house, same 6.5% mortgage, thirty-year horizon, one input moved at a time:
| Change | Break-even |
|---|---|
| Rent $2,400 (default) | Never |
| Rent $2,800 (+17%) | Year 5 |
| Rent $3,200 (+33%) | Year 3 |
| Rent $4,000 (+67%) | Year 2 |
| Appreciation 5% instead of 3% | Year 4 |
| Mortgage 4% instead of 6.5% | Year 4 |
| Real return 4% instead of 7% | Year 7 |
| Down payment 50% | Never |
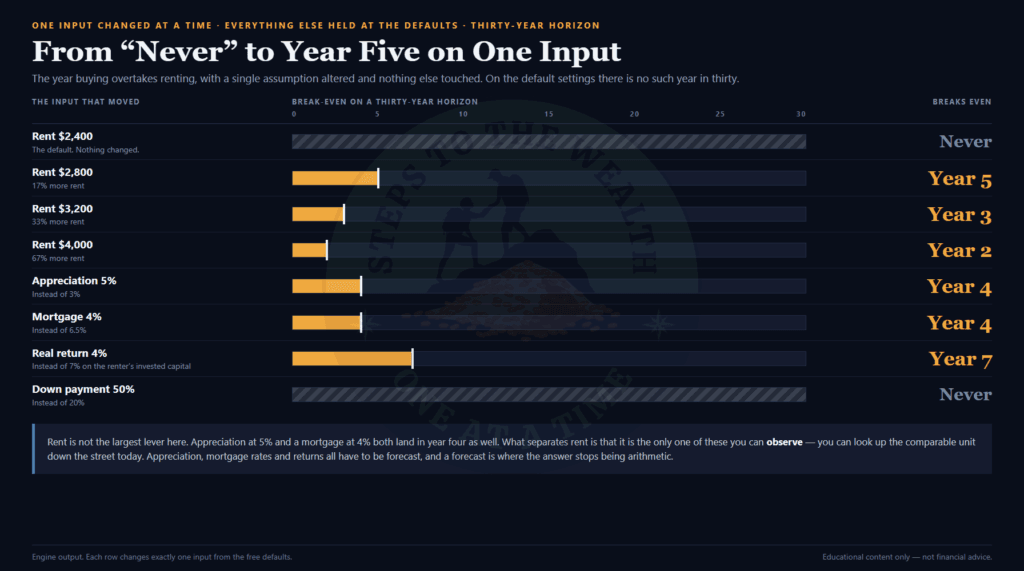
A 17% change in one input takes the answer from “never” to “year five.” That is not a stable result being nudged. That is a question whose answer was never general in the first place.
I want to be careful about what this does and does not show. Rent is not the only lever, and it is not obviously the strongest one — appreciation at 5% and a mortgage at 4% both land in year four, which is earlier than a $2,800 rent gets you. Anyone telling you rent dominates is overreading the table.
What makes rent different is not size. It is that rent is the only one of those inputs you can actually observe. You can call the building down the street and ask what the comparable unit costs. You cannot look up what your metro appreciates over the next decade, and you cannot look up where mortgage rates go. Two of those levers require a forecast. One requires a phone call.
Which is why the question worth asking is not “should I rent or buy.” It is: at what rent does buying become the better structure for me? Same subject, and unlike the original, it has an answer, it is specific to your situation, and it takes about ninety seconds to find.
Notice also the last row. A 50% down payment still never breaks even. The instinct that a bigger deposit makes owning safer is a real instinct about risk, and it is not wrong about risk — but it does not make owning win on this arithmetic, because the extra capital you sink is capital the renting path invests.
The holding period is the input nobody enters
Every break-even year in that table is a claim about how long you stay. That is easy to miss, because the model asks for a horizon and most people type in the one they hope for rather than the one they have.
The reason it matters is the 6% selling cost sitting at the end of the owning path. On a $400,000 house that is roughly $24,000 handed over on the way out, and it does not scale down if you leave early. Buy and sell inside three years and you have paid a transaction cost the size of a small car for the privilege of the transaction, on top of the $12,000 you already paid on the way in. The rent vs buy comparison only starts working in the owner’s favour once the equity built has outrun both ends of that toll, which is precisely what the break-even year is measuring.
So the question sitting underneath the arithmetic is not a financial one. It is: how confident am I that I am still in this house, in this city, in this job, in this relationship, in year seven? People are systematically optimistic about that. Jobs relocate, relationships end, elderly parents need somebody nearby, and a house is the least liquid thing most households will ever own. If your honest answer is “probably three or four years,” the break-even table has already answered the question and you do not need the rest of the model.
What the arithmetic cannot price
Everything above is a net worth calculation, and net worth is not the only reason anybody buys a house. The things it leaves out are real, and I would rather name them than let the model imply they do not exist.
Security of tenure. A landlord can decline to renew, sell the building, or move a relative in. You can be a model tenant and still be looking for somewhere to live at eight weeks’ notice. An owner with a fixed-rate mortgage cannot be asked to leave, and for a household with school-age children that is worth something the spreadsheet has no column for.
A fixed principal and interest line. It is the one number in the whole comparison that does not escalate. Thirty years of inflation runs against every other line on both sides of the ledger and leaves that one untouched, which makes a mortgage a genuine long-horizon inflation hedge on the housing portion of a budget. The model captures this in dollars. It does not capture what it feels like to know the largest bill you have is frozen.
Control. Knocking a wall through, keeping a dog, and not asking permission are not investment returns and should not be argued for as if they were. They are consumption, and consumption is a legitimate thing to buy with money.
None of that belongs in a net worth comparison, and none of it is a reason to ignore one. The useful order is to run the arithmetic first, find out what the structure costs, and then decide whether the things it cannot price are worth that number to you. Deciding it is worth $32,533 over a decade is a defensible choice. Not knowing that the figure was $32,533 is the part worth avoiding.
The strongest objection to all of this
The best argument against everything above is not about appreciation. It is this: the renter in the model actually invests the difference, and most real renters do not.
That objection is correct, and it is the reason I will not tell you the model proves renting is better. It proves something narrower — that renting plus a disciplined investment of the capital beats owning on these assumptions. Strip out the discipline and the comparison collapses, because the renter ends the decade with neither a house nor a portfolio. A mortgage is a forced savings mechanism, and forced savings mechanisms work precisely because they do not depend on anyone feeling motivated on a Tuesday.
I would rather say that plainly than pretend the model is stronger than it is. What the arithmetic gives you is the size of the prize for being systematic. Whether you collect it is a separate problem, and it is a behavioural one, not a mathematical one — which is the same structural shape as most things that determine outcomes in investing.
What the tool does, and where it stops
The calculator runs both paths month by month, net of selling costs and capital gains tax, and returns the year they cross — or tells you plainly that there is not one.
Free covers a ten-year horizon, every assumption editable, results in today’s money, and a shareable link that reproduces your exact run. No account. Nothing you type is stored, logged or sent anywhere, on either tier.
Two honest limits worth stating before you use it. First, free clamps at ten years and says so on the results — and when it is clamped it will not claim renting won, because the run did not test it. Second, the share link is free deliberately. A link that opened as a locked door for whoever you sent it to would be worthless, and pretending otherwise would be a small lie in the direction of my own interests.
The paid tier extends the horizon to fifty years, runs three scenarios side by side, and adds the sensitivity grid and exports. Pro is $29, paid once — not a subscription and not a bundle. The checkout is here. If the free ten-year answer already settled it, you do not need it.
Run your own numbers here: /rent-vs-buy/
Put in your actual rent, your actual price, and the appreciation rate you are willing to defend out loud. If the answer comes back “never,” that is information. If it comes back “year three,” that is information too. Either way it is your forecast producing it, which is the only honest way this question has ever been answerable.
Educational content only — not financial advice.