
There is a number that appears on every revolving credit statement, and a number that does not.
The one that appears is the minimum payment. It is calculated for you, printed in a box, and it is the only figure on the page that answers a question you actually asked, which is: what do I have to do this month to stay in good standing.
The one that does not appear is the total. Not the balance. The total — what the balance will have cost by the time it is gone, and how long that takes if you keep doing exactly what the box tells you.
A minimum payment calculator exists to produce the second number. Not the payment, which the statement already gives you, but the total and the years behind it. What follows is what that figure looks like once you have it, and why the box on the statement is the wrong thing to be managing.
No lender publishes that, and there is no conspiracy in it. The statement is a monthly document about a monthly obligation. The total is an emergent property of a schedule nobody ever writes down. So I built the thing that writes it down.
The number on the statement
Take a $5,000 balance at 22 percent APR.
That rate is an example, not a measurement. The tool has no rate feed and does not pretend to have one — the field is a placeholder to overwrite with whatever is printed on your own statement, exactly the way the sibling tools handle a mortgage rate. Nothing here is a claim about what cards charge.
The minimum is calculated the way most large issuers actually calculate it: this month’s interest, plus one percent of the balance, with a floor of $25. That rule always clears the debt eventually, which matters, because it means what follows is not an edge case.
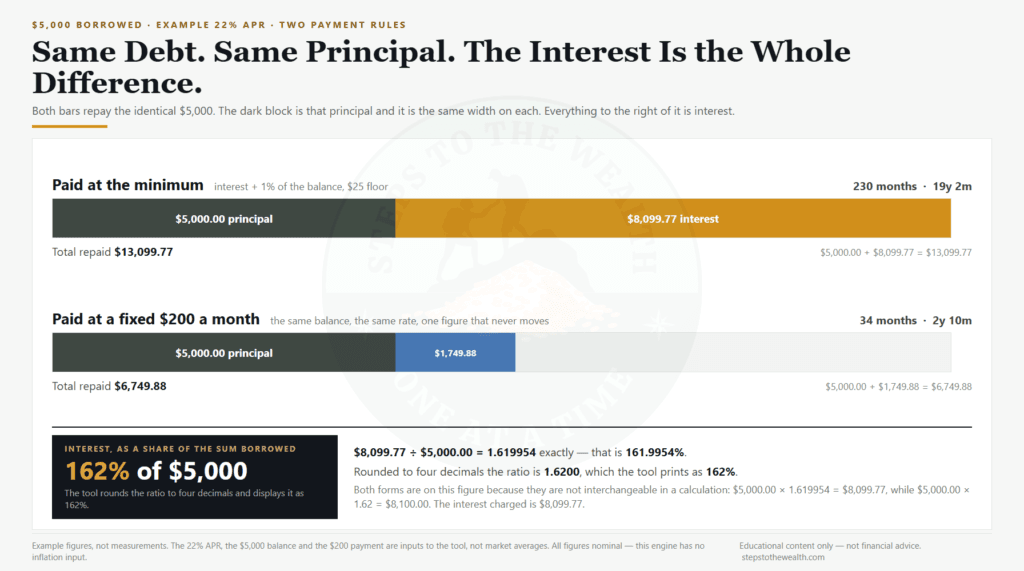
Paid at that minimum, month after month, the $5,000 takes 230 months to clear.
That is 19 years and 2 months. Over that time you hand over $13,099.77, of which $8,099.77 is interest.
The interest is 162 percent of what you borrowed. Not 162 percent of what you repaid — 162 percent of the original $5,000. You buy the thing once, and then you buy it again, and then you buy most of it a third time.
That ratio is the headline the minimum payment calculator leads with, and it is deliberate. Every other lending calculator opens with “your monthly payment is $X”, because that is the number the industry is organised around. It is also the number that hides everything. The ratio does the opposite: it puts the cost in units of the purchase.
Now run the same debt at a flat $200 a month. Same balance, same rate, same person. It clears in 34 months — 2 years and 10 months — with $1,749.88 in interest.
Same debt. 196 months and $6,349.89 apart.
What the first payment actually does
The gap looks like a gap between $141.67 and $200, and it is not. That is the part worth slowing down for.
The first minimum payment on that balance is $141.67. Of that, $91.67 is interest. The remaining $50.00 is the only part that touches the debt.
Be careful with how you read that split, because part of it is arithmetic and part of it is definition. Under this minimum rule — interest plus one percent of the balance — the principal portion is by construction exactly one percent of the balance. On $5,000 that is $50.00. It cannot be anything else. So “only $50 of $141.67 touches the debt” is not a discovery about lenders. It is a restatement of the rule.
The finding is what happens next.
Because the minimum is computed from the balance, and the balance is falling, the payment falls too. Month two is slightly smaller than month one. Month forty is meaningfully smaller. The schedule is a curve that flattens toward the floor, and every dollar the payment drops is a dollar that stops attacking the principal.
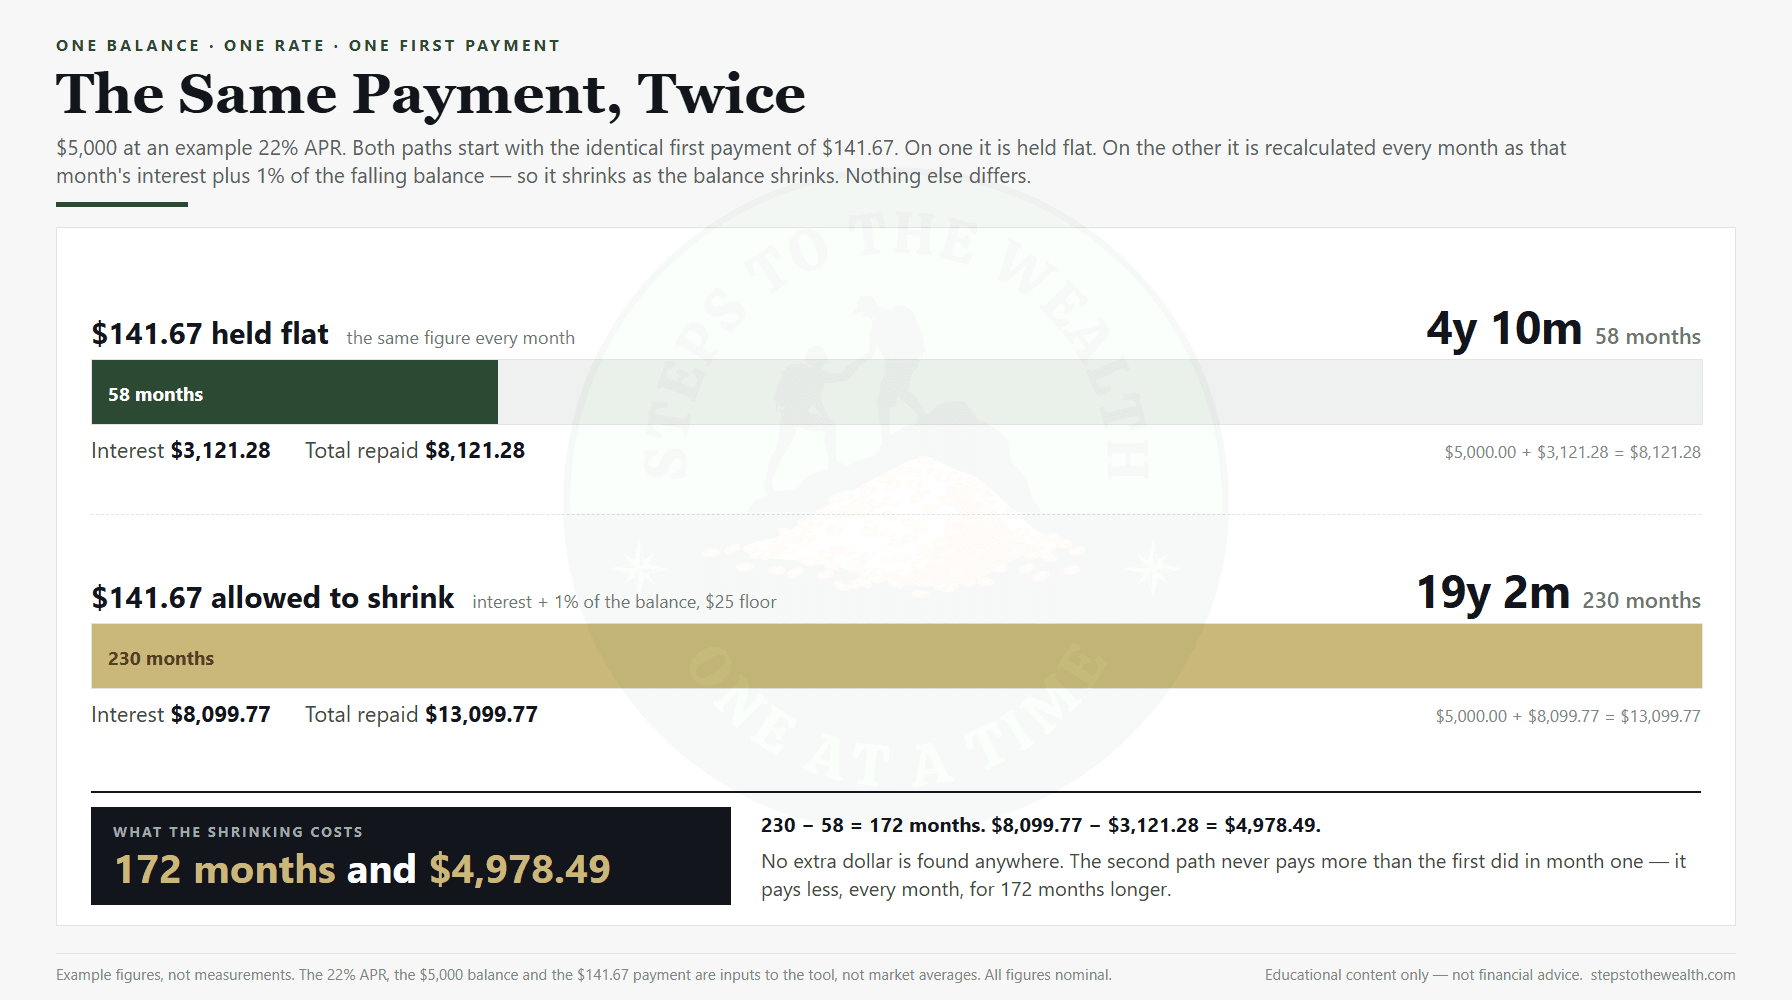
So here is the same debt, paid at the same $141.67 — except frozen. You pay the first minimum, and then you keep paying that exact figure instead of letting it shrink.
It clears in 58 months. Four years and ten months, with $3,121.28 in interest, for a total of $8,121.28.
Nineteen years and two months, or four years and ten months. The same first payment. The only difference is whether it is allowed to get smaller.
That is the mechanism, and it is why the tool is not called a payment calculator. The cost is not in the size of the minimum. It is in the shrink. Freezing it saves 172 months and $4,978.49 without finding a single extra dollar.
The rule that never clears
The rule above is the modern one, and it is the minimum payment calculator’s default because it is the one most readers are actually on. The older rule is worse, and it is worse in a way that is structural rather than merely expensive.
Under a flat percentage rule the minimum is simply a percentage of the balance — classically two percent, with a dollar floor. No interest component. The tool offers it as the second option because plenty of agreements still work this way.
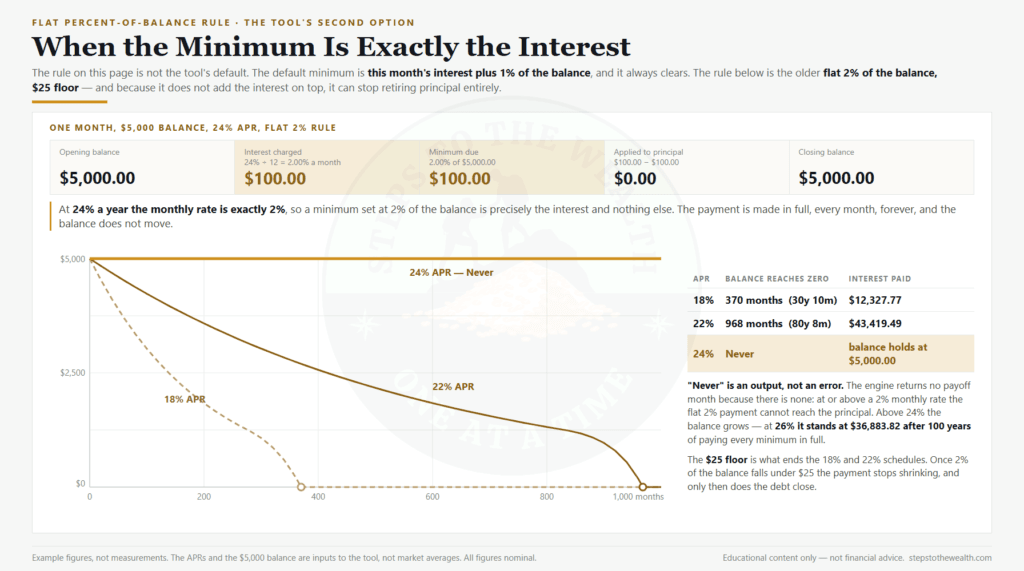
On the same $5,000 at 22 percent, a flat two percent minimum with a $25 floor takes 968 months. That is 80 years and 8 months, and it costs $43,419.49 in interest — 868 percent of the sum borrowed.
At 18 percent the same rule takes 30 years and 10 months and costs $12,327.77.
At 24 percent it never clears at all.
Not “takes a very long time”. Never. And the arithmetic is almost rude in how simple it is: 24 percent a year is 2 percent a month. A minimum of 2 percent of the balance is therefore exactly the interest charged on that balance. The first payment is $100.00. The first month’s interest is $100.00. The balance after that payment is $5,000.00, which is where it started, and it is where it stays for as long as you keep paying.
At 26 percent it does not stall — it climbs. Paying the stated minimum every month for a hundred years leaves you owing $36,883.82 on an original $5,000.
The tool reports this as what it is: no payoff date, because there is not one. It does not round the answer up to its iteration ceiling, does not print a hundred-year figure to look decisive, and does not soften it into “this may take a long time”. A schedule that never retires the debt is a legitimate output, and stating it plainly is the whole job. It is the same discipline that makes the rent-versus-buy tool say “never breaks even” when that is what the arithmetic says.
It is the size, not the schedule
Everything above makes the fixed payment look like the hero and the minimum look like the villain. That framing is wrong, and the minimum payment calculator will happily prove it wrong on your own numbers.
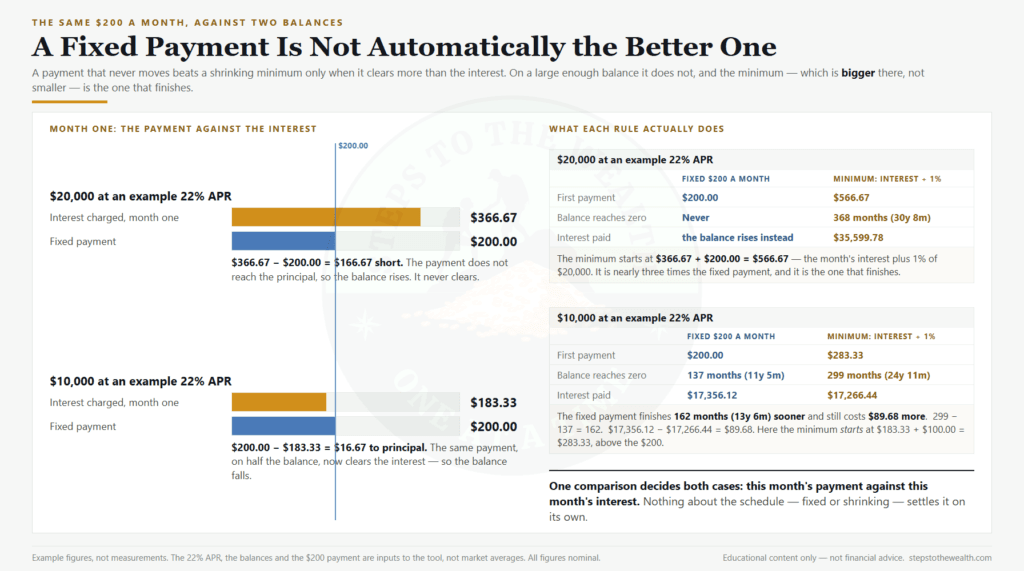
Take $20,000 at 22 percent, and pay a disciplined, fixed, never-shrinking $200 a month.
It never clears.
The first month’s interest on $20,000 at that rate is $366.67. A $200 payment does not cover it. The balance grows the moment you start, and it keeps growing, and it does not care in the slightest that the payment is fixed and disciplined and arrives on the same day every month.
The minimum, on that same debt, clears it — 368 months, 30 years and 8 months, $35,599.78 in interest. Slow and enormously expensive, and finite, which is more than the “disciplined” plan managed.
The middle case is sharper still. At $10,000 and 22 percent:
- The minimum clears in 299 months (24 years 11 months) with $17,266.44 interest.
- A fixed $200 a month clears in 137 months (11 years 5 months) with $17,356.12.
The fixed payment finishes thirteen and a half years sooner and costs $89.68 more.
Both of those are real, and the explanation is the same one both times. The minimum on $10,000 under this rule starts at $283.33 — considerably more than $200. Paying “the minimum” is not automatically paying less. Early on, when the balance is large, it can be paying substantially more, and those early large payments are the ones that do the work.
So the useful question is not whether your payment has a fixed label or a minimum label. It is a single comparison: is the payment larger than this month’s interest, and by how much. Everything else — the payoff date, the total, the ratio — falls out of that one gap. A schedule is just a rule for choosing the payment. It is the payment that pays.
Where interest costs as much as the thing
One more figure, because it puts a boundary on the whole discussion.
Hold everything constant — $5,000, the default minimum rule — and sweep the rate. The interest-to-principal ratio moves like this:
- At 12 percent: 85 percent. 208 months.
- At 14 percent: 100 percent. 213 months, $4,999.84 in interest.
- At 18 percent: 131 percent. 222 months.
- At 22 percent: 162 percent. 230 months.
- At 29.99 percent: 225 percent. 245 months.
Fourteen percent is the line where the interest on a minimum-paid balance costs the same as the balance. Four thousand, nine hundred and ninety-nine dollars and eighty-four cents of interest, on five thousand dollars borrowed. Below that line the debt costs less than itself. Above it, more.
Notice the other column. The payoff time barely moves — 208 months at 12 percent, 245 months at 30 percent. Under a minimum that scales with the balance, tripling the rate adds about three years to a seventeen-year schedule. It does not add three times the wait. What it does is nearly triple the bill, quietly, while the payoff date stays roughly where it was and the schedule keeps looking about as manageable as it always did.
Every figure here is nominal
There is no inflation input in this tool, and there is not going to be one.
Its siblings all have one. The DCA simulator, the rent-versus-buy engine, the degree-ROI tool — every one of those asks a real-return question, where money goes in over a horizon and the only honest comparison is in today’s terms. This is not that question.
A debt is repaid in the nominal dollars of the day. The interest is charged in nominal dollars. And “you repaid $13,099.77 on a $5,000 balance” is a nominal fact about a contract, not an estimate about purchasing power.
The dishonest move would be to deflate it anyway. Interest here is paid across nineteen years, so a single deflator applied to the total is simply the wrong operation, and the correct year-by-year real figure would bury the headline under a caveat nobody asked for and gain nothing. So every number in this article and in the minimum payment calculator is nominal, and it says so.
Read the totals as what they are. Nineteen years is long enough for a dollar to mean less at the end than at the start, and this tool does not model that. It models the contract.
What the minimum payment calculator refuses to tell you
It will not tell you what to pay.
There is no recommended payment in it, no green zone, no “here is your optimal payoff strategy”, and no arrow pointing from where you are to where a calculator thinks you should be. It computes what a rule does to a balance. What you do about it is a question about your income, your other obligations and your life, and a web page that has met none of those has no business having an opinion.
It also will not rank this against anything else. Whether a dollar is better spent on a balance or in a market is one of the most confidently over-answered questions on the internet, and the honest answer depends on facts about you that this tool does not have and does not ask for. There is no debt-versus-investing verdict anywhere in it, and there is not one in this article either.
It has no rate feed. The 22 percent is an example. So is the $5,000, so is the $200, and the form says so beside each field.
It models one debt. Real balance-carrying is often several at once, at different rates, and the interaction between them is a different problem than the one this solves.
And it is not a statement. Real accounts have promotional rates that expire, cash-advance tiers priced differently from purchases, fees, and the effect of new spending on a balance you are trying to clear. The engine models a single balance at a single rate under a single minimum rule, which is enough to show you the shape of the thing and not enough to reconcile your account.
If none of that is worth ten minutes to you, that is a completely reasonable conclusion. No hard feelings.
What you can do with it
Enter the balance, the APR from your own statement, and which minimum rule your agreement uses. Enter a payment you want to test against it. The tool returns the payoff time for both, the total repaid, the interest, and the ratio — the interest as a percentage of what you borrowed.
That is the free version, in full. Not a preview of it. The result link you can send to someone else is free too, and stays free, because a number that unsettles you is worth more where it can be passed on than where it is locked up. One thing to know about that link: it carries the figures you entered. It is a share link, not a private one. Do not post it somewhere you would not post the balance.
The paid layer adds an accelerator grid — a ladder of monthly payments, each run through the same simulation, showing what every step up buys in months and in interest. On the $5,000 example it runs from $150 a month, which clears in 52 months and saves $5,301.72 against the minimum, up to $900 a month, which clears in 6 months and saves $7,777.57. It also pins several debts side by side and exports the card and the underlying schedule. That layer is described here for completeness and is not on sale yet.
The point of the exercise is not the payment. It is the ratio. Once you have seen what a schedule costs in units of the thing you bought, the monthly figure in the box on the statement stops being the number you are managing — and the difference between a payment that shrinks and one that does not stops looking like a technicality.
Run your own balance through the minimum payment calculator here: Minimum Payment Visualizer
The free version gives the whole answer for your own debt and never clamps it: the payoff time, the interest total, and the comparison against a single fixed payment. Pro adds the accelerator grid — what every extra amount a month actually buys you, from a few dollars up — lets you pin several debts side by side, and adds image and CSV export. Pro is $29, paid once — not a subscription and not a bundle. The checkout is here. If the free schedule already showed you what the minimum was costing, you do not need it.
Educational content only — not financial advice.