What goes in
3 exchanges
Deribit, Bybit and OKX. Every open call and put, per strike, converted to units of the coin before it is summed. Refreshed every ten minutes.
Crypto Max Pain
Crypto max pain — where the book is positioned
The strike where option holders, collectively, get paid the least.
Call and put open interest by strike, summed across three exchanges, for every listed expiry. Read the crypto max pain chart yourself, then
see why a max pain number without its book is not a reading.
What comes out
1 strike
The settlement price that pays out the least across every open contract for the expiry you pick, with the pain curve around it and the index price beside it.
1 strike
The settlement price that pays out the least across every open contract for the expiry you pick, with the pain curve around it and the index price beside it.
Light
Dark
CRYPTO OPTIONS MAX PAIN
BTC options max pain
Open interest aggregated across Deribit, Bybit and OKX.
Max pain
–
Index price
–
Open interest
–
Put / call ratio
–

Reading the exchanges...
Calls
Puts
Pain curve (right axis)
Max pain
Index
OPEN INTEREST BY EXPIRY
| Strike | Calls | Puts | Total | Pain at strike |
|---|
You are looking at the free tier.
It carries the full chart for every expiry settling within the next 30 days — the dailies, the weeklies and the front monthly — on BTC, ETH, SOL and XRP. Pro adds:
- Every listed expiry beyond that: the quarterlies and the year-end book, where the largest open interest sits
- Open interest by expiry across the whole curve
- The per-strike table, and CSV export
- Chart image and PDF report
How to read this
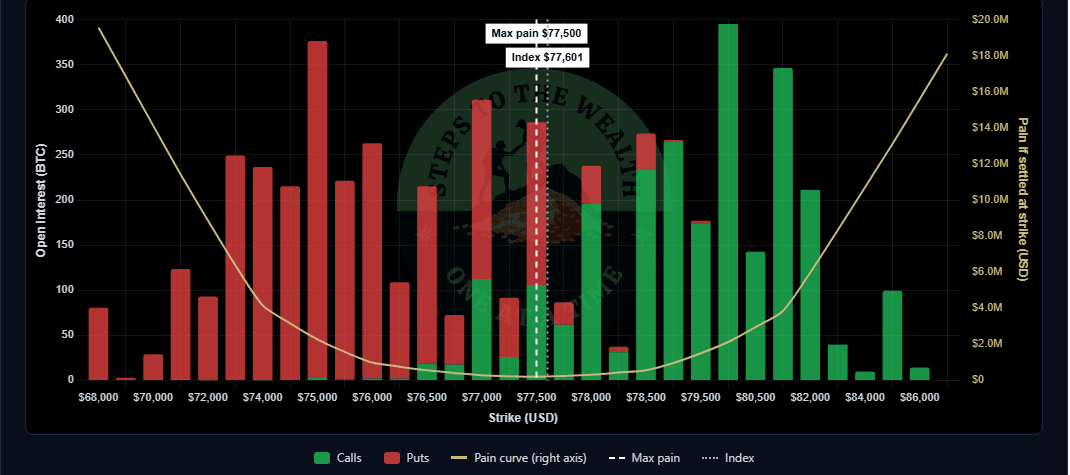
Every bar is the open interest at one strike for the expiry selected above: green for calls, red for puts, in units of the coin, summed across the exchanges named under the chart. The pain curve is the total intrinsic value all of those contracts would have if the underlying settled at that strike. The strike where the curve bottoms out is max pain: the settlement price at which option holders, collectively, are paid the least.
That is a description of how the book is positioned. It is not a forecast. Price sometimes drifts toward max pain into an expiry and often ignores it entirely; the figure moves as positions open and close, and a large book at one strike can be a hedge as easily as a bet. Treat it as one reading of where the pressure sits, alongside everything else you look at, and nothing more.
The put/call ratio is open-interest based: puts divided by calls for the selected expiry. The index price is the exchanges' own reference price for the underlying and is the same for every expiry. When an exchange does not answer, its book is left out and the page says so; nothing is estimated in its place.
Educational content only — not financial advice. Open interest from Deribit, Bybit and OKX as published by each exchange, refreshed every ten minutes, and subject to their reporting. Max pain describes positioning; it predicts nothing. Nothing here is a recommendation to buy, sell or hold any asset or derivative.
01 — Why a max pain headline is the wrong instrument
A single number with no book behind it is a rumour, not a reading.
Every expiry week the same post goes around: “BTC max pain is at such-and-such.” One figure, one exchange, no expiry named, no open interest shown. It is the most repeated number in crypto options and the least examined.
The version you usually get
One number
One number
Lifted from one exchange, for one expiry that is rarely named, with nothing to say whether it sits on a wall of open interest or on a shelf next to nothing. You cannot tell how much the book would have to move for the figure to move, so you cannot tell what it is worth.
What this is instead
The whole book
The whole book
Every strike, calls and puts, on three exchanges, for every listed expiry — with the pain curve drawn through it so you can see whether the minimum is a sharp trough or a flat floor. The strike is the last thing you read, not the only thing.
The reason this matters is not pedantry. Three exchanges publish three different books, and they report them in different units: one counts coins, another counts contracts that are a fraction of a coin. Sum those naively and one venue outweighs the others many times over, and the crypto max pain you get is a rounding error wearing a dollar sign. This crypto max pain chart converts everything to units of the coin before adding a single strike, and prints which exchanges answered under the chart so you know whose book you are looking at.
The second reason is shape. Two expiries can share the same crypto max pain strike and mean opposite things: on one the curve is a steep V, so option holders lose money fast in either direction from that strike; on the other it is a shallow bowl, so the “minimum” is a coin toss between three neighbouring strikes. A headline gives you the strike. The curve tells you whether the strike means anything.
What this is not, and it is worth saying before you scroll: it is not a forecast. Crypto max pain describes how the book is positioned on the day you look at it. Price sometimes drifts toward it into an expiry and often ignores it entirely, and a large book at one strike can be a hedge as easily as a bet. The crypto max pain chart computes open interest, the pain curve, the max pain strike, the index price and the put/call ratio. It does not compute gamma exposure, implied volatility, dealer flow or anything it would have to guess at, and it does not pretend to.
02 — The arithmetic
Crypto max pain: one question per strike, asked at every strike.
Crypto max pain is not a model. It is a sum, and the whole of it fits in a short table. Here it is, so that you can check the crypto max pain chart rather than trust it.
Open interest
IN
Every open call and put, per strike, for one expiry, from Deribit, Bybit and OKX.
calls_oi, puts_oiUnits
=
Converted to units of the coin on every exchange before anything is added. One venue reports contracts; that field is never read. A strike listed on two venues is one strike with the sum of both books.
Pain at a strike
Σ
Suppose the coin settled exactly at strike K. Every call struck below K is in the money by the difference; every put struck above K likewise. Weight each by its open interest and add it all up.
pain(K) = Σ calls(k)·(K−k) + Σ puts(k)·(k−K)Crypto max pain
min
Repeat that for every listed strike and take the lowest total. That strike is max pain: the settlement price at which option holders, collectively, are paid the least. An expiry with fewer than two strikes carrying open interest is not solved at all, because a one-strike minimum is that strike by definition.
Index price
~
The exchanges’ own reference price for the underlying, taken as the median across the venues that publish one. It is the same figure for every expiry, and the tile beside it shows how far max pain sits from it.
Put / call ratio
÷
Open interest in puts divided by open interest in calls, for the selected expiry. Open interest, not traded volume: it describes what is held, not what changed hands today.
The reading
=
One strike per expiry, the curve of totals around it, and the book that produced both, refreshed every ten minutes.
The curve is the part worth a second look. The crypto max pain chart draws pain(K) for every strike, not just the minimum, on the right-hand axis. A steep V means the book pays out sharply more a strike or two away from max pain in either direction; a shallow bowl means several neighbouring strikes are nearly tied and the “max pain strike” is whichever happened to be lowest by a rounding margin this morning. Same headline number, very different amount of information in it.
Units are the second part, and the one that quietly breaks other versions of this chart. Exchanges do not agree on what “open interest” is counted in: one publishes coins, another publishes contracts that are a fraction of a coin, and a third publishes both fields side by side. This crypto max pain chart reads the coin-unit field on every exchange and never the contract count, so no single venue’s book is over-weighted before the sum is taken.
The last rule is that nothing is estimated. If an exchange does not answer, its book is left out and its name is printed under the chart as missing. If all three fail, the last real reading is served, marked stale with its own fetch time, for up to a day, and then the crypto max pain chart says it has nothing rather than drawing something. A blank that is labelled is information. A number that was filled in to keep the chart tidy is a lie.
03 — How it works
Pick the expiry, read the tiles, then look at the shape.
The crypto max pain chart opens on the nearest expiry you can see and fills four tiles from the live book. The order below is the order that keeps you from over-reading the first number you see.
01
Pick the asset and the expiry
Bitcoin, Ethereum, Solana or XRP, then any expiry on the list: the dailies, the weeklies and the front monthly are open to everyone. Each expiry is its own book with its own max pain; there is no such thing as “the” crypto max pain for a coin, only the one for the settlement date you are looking at. Expiries further out than thirty days are listed and marked Pro.
02
Read the four tiles together
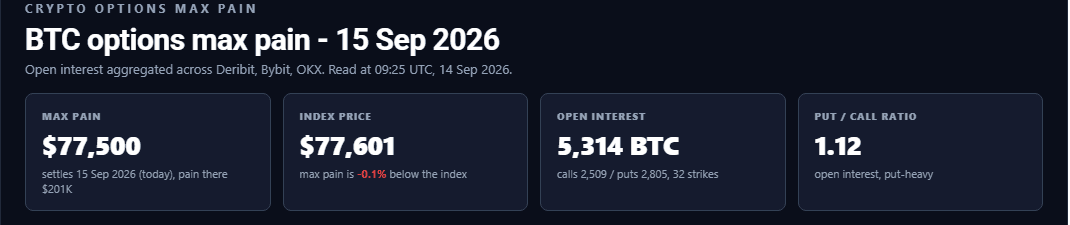
Max pain, with the total pain at that strike under it. The index price, with how far above or below it max pain sits. Total open interest, split into calls and puts. The put/call ratio, which is open interest rather than volume. The second tile is the one to read twice: a crypto max pain strike a long way from the index is a book that is a long way from where price is, and that is the whole reading.
03
Look at the curve, not just the marker
The pain curve runs across the chart on the right-hand axis. Follow it away from the crypto max pain line in both directions. A steep V is a book with a strong preference; a flat trough is a book that barely cares. “Near the money” keeps the chart to strikes within 40% of the index so the shape is readable; “All strikes” shows the whole tail.
04
Check who answered before you quote anything
The exchanges that responded are printed under the chart, and one that did not is named as missing. A reading built from two books is a different reading from one built from three. The crypto max pain chart never fills in a missing venue, so the sources line is part of the figure, not a footnote to it.
Every control, free
No account, no email.
- Asset: Bitcoin, Ethereum, Solana or XRP
- Expiry: every one settling within the next thirty days
- Near the money (within 40% of the index) or all strikes
- Open interest by expiry, for the expiries you can open
- Light or dark; expand to the page width
- Copy link: a URL that opens on this asset and expiry
- Share on X, with the figure and the settlement date in the post
What Pro adds
A separate one-time purchase. Not part of DCA Simulator Pro.
- Every listed expiry beyond thirty days: the quarterlies and the year-end book
- Open interest by expiry across the whole curve, so you can see where the book is concentrated
- The per-strike table: calls, puts, total and pain at every strike
- CSV of every expiry, every strike, every figure on the page
- The chart as an image and the reading as a PDF, dated
- Everything the free version has. Nothing is taken away.
04 — Objections
What this crypto max pain chart cannot do.
Listed here rather than buried, because a tool that only advertises its strengths is not a measuring instrument, it is an argument.
Objection
“Your crypto max pain does not match the number on my exchange.”
It will not, and it should not. An exchange’s own max pain page describes that exchange’s book. This one sums three books, in units of the coin, and solves the combined curve. Where a strike carries open interest on two venues, both are counted, so the minimum can land a strike away from any single venue’s figure. The sources line under the chart tells you which books went into the reading you are looking at.
It will also differ from aggregators that add one venue’s contract count to another venue’s coin count. That is not a difference of opinion; one of the two sums is wrong, and it is not the one that converted units first.
Objection
“So price is going to max pain?”
Sometimes it drifts there into an expiry. Often it ignores the figure entirely. Crypto max pain describes how the book is positioned on the day you read it; it does not describe what the book will do, and the figure itself moves as positions open and close. A large stack of open interest at one strike can be a hedge as easily as a bet, and the chart cannot tell the two apart.
Treat it as one reading of where the pressure sits, alongside everything else you look at. If you want the risk-first framework this site actually runs on, that lives in the weekly issue, in the market risk indicator and in the tools built for it. This one is a description of a book, not a view on a coin.
Objection
“Where is the gamma exposure? The IV skew? The dealer flow?”
Not here, on purpose. Those need inputs the public open-interest feeds do not carry — who is long and who is short each contract, at what implied volatility, hedged how — and a panel that prints them anyway is printing a guess with a technical name. This crypto max pain chart computes open interest, the pain curve, the max pain strike, the index price and the put/call ratio, all of which follow from the published book, and nothing that does not.
The earlier version of this tool had six such panels. They were removed because it had never computed any of them. If you need the greeks, you need a data vendor that has the trades, not a page that has the open interest.
Objection
“I opened it twice and got two different strikes.”
Correct, and deliberately so. The page itself carries no market data, so it can be served from cache instantly; your browser then asks the plugin for the current book, and the plugin fetches from the exchanges at most once every ten minutes per asset. Two readers a few minutes apart can see two slightly different books, and neither is wrong. Open interest moves; crypto max pain moves with it.
The one thing that will not happen is a silent substitute. If an exchange does not answer, its book is left out and it is named as missing under the chart. If all three fail, the last real reading is shown with a stale label and its own fetch time, for up to a day. Nothing is smoothed, filled in or invented to keep the chart populated.
05 — Who this is for
A reading for people who hold the coin and do not trade the options.
Most people who look at crypto max pain will never write an option. That is fine. The crypto heatmap and global net liquidity sit beside it for the rest of the picture. The book is still public information about where a lot of money is positioned, and it costs a minute a week to read.
Worth your time if
- You hold or accumulate Bitcoin, Ethereum, Solana or XRP and want to know how the options book is positioned into a settlement date, in the time it takes to read this sentence.
- You already run a systematic plan and want the book as context for what the market is doing, not as a trigger for what you do.
- You are tired of a single crypto max pain number in a post with no exchange, no expiry and no open interest behind it.
- You want the arithmetic shown, so that the strike is something you can check rather than something you were told.
- You look once a week, around the expiry, and then get on with your life.
Skip it if
- You want a price target. Crypto max pain is not one, and the tool says so on the page.
- You trade options intraday. The book refreshes every ten minutes; that is a reading, not a tape.
- You need gamma exposure, implied volatility, skew or dealer positioning. None of that is computed here, and nothing that looks like it is.
- You want the exact figure for one venue. This is three books summed in coin units, and it will not match any one of them by itself.
- You want to be told what to buy. The page describes a book. It has no opinion about a coin.
06 — Questions
What the crypto max pain strike is, and what it is not.
Answered against what the crypto max pain chart actually does, not against what would be convenient to claim.
What is crypto max pain?
The strike price at which, if the coin settled there on expiry, the holders of every open option would collectively be paid the least — and the writers of those options would keep the most. It is a property of the open-interest book: for each listed strike, add up what every open call and put would be worth if the coin closed at that strike, and the strike with the lowest total is crypto max pain.
It is computed per expiry, because each settlement date has its own book. There is no single max pain for Bitcoin, only one for each date the options settle on.
How is it calculated here?
Open interest per strike is read from Deribit, Bybit and OKX and converted to units of the coin on each exchange before anything is added — one venue publishes contract counts beside its coin figure, and the contract count is never used. Where a strike is listed on more than one venue, the books are summed into one strike.
Then, for every strike K, the tool computes Σ calls(k)·(K−k) for the calls struck below K plus Σ puts(k)·(k−K) for the puts struck above it. The strike with the smallest total is crypto max pain, and the whole set of totals is drawn as the pain curve so you can see how sharp the minimum is. An expiry with fewer than two strikes carrying open interest is not solved, because a one-strike minimum says nothing.
Which exchanges, which coins, and how often does it refresh?
Deribit, Bybit and OKX, for Bitcoin, Ethereum, Solana and XRP. Solana’s and XRP’s options on Deribit live in its USDC-settled book and are read from there; OKX lists no XRP options, so XRP is read from Deribit and Bybit. The exchanges that answered are printed under the chart; one that did not is named as missing and its book is left out rather than estimated.
The plugin fetches from the exchanges at most once every ten minutes per asset, and every visitor in that window sees the same book. If every exchange fails, the last real reading is served with a stale label and its own fetch time, for up to a day. Nothing is smoothed, carried forward without saying so, or invented.
Why does the expiry list stop at thirty days, and what does Pro add?
The free version carries the full chart — every strike, the curve, the tiles — for every expiry settling within the next thirty days: the dailies, the weeklies and the front monthly, on all four coins. Expiries further out are listed and marked Pro, and a free session is never sent their figures; the lock is enforced on the server, not drawn over the chart.

Pro is a separate one-time purchase, not a subscription, and it is not included in DCA Simulator Pro. It adds every listed expiry beyond thirty days (the quarterlies and the year-end book), open interest by expiry across the whole curve, the per-strike table, and CSV, image and PDF export. Nothing is taken away from the free version to make room for it.
Does price move to crypto max pain at expiry?
Sometimes it drifts toward it into an expiry, and often it ignores the figure entirely. Crypto max pain describes how the book is positioned on the day you read it; it says nothing about what the book, or the price, will do next, and the figure itself moves as positions open and close. A large stack of open interest at one strike can be a hedge as easily as a bet, and the chart cannot tell the two apart.
Treat it as one reading of where the pressure sits, alongside everything else you look at, and nothing more. Nothing here is a recommendation to buy, sell or hold any asset or derivative. Educational content only, not financial advice.
What do the tiles under the chart mean?
Crypto max pain is the strike, with the total pain at that strike beneath it. Index price is the exchanges’ own reference price for the coin, taken as the median across the venues that publish one, with how far above or below it max pain sits. Open interest is the total for the selected expiry, split into calls and puts, with the number of strikes that carry any. Put / call ratio is open interest in puts divided by open interest in calls — what is held, not what traded today.
“Near the money” keeps the chart to strikes within 40% of the index so the shape of the curve is readable; “All strikes” draws the whole tail. The max pain strike is always drawn, whichever view you are in.
Do I need an account, and is anything stored?
No account, no email and no sign-up for the free version. There is nothing to enter, because the crypto max pain chart reads public exchange data rather than anything about you. The other free tools work the same way. The only thing kept in your browser is whether you switched the chart to light or dark. Your choice of asset and expiry lives in the page address, so “Copy link” hands you a URL that opens on exactly what you were looking at.
The three exchange buttons beneath the chart are affiliate links and are marked as such in the page. Exporting an image or a PDF happens in your browser; nothing is uploaded anywhere.
One purchase · no subscription
The front month shows you where the pain is this week. The quarterlies show you where the money is.
Free carries the full chart for every expiry settling within the next 30 days on BTC, ETH, SOL and XRP. Pro adds every listed expiry beyond that — the quarterlies and the year-end book, where the largest open interest sits — plus open interest by expiry across the whole curve, the per-strike table, and export of the data as CSV, the chart as an image, and the page as a PDF.
Paid once. Not a subscription, not a bundle.
The free version is the working tool, not a screenshot of one: call and put open interest by strike, the pain curve and the max pain strike for every expiry inside 30 days, summed across Deribit, Bybit and OKX. Pro is a separate one-time purchase; if you already subscribe to DCA Simulator Pro, this is not included in it. If the front month answers your question, it answers it, and you do not need this. Educational content only — not financial advice.