
A market risk indicator is a single reading that tells you how much risk the market is carrying right now, so the decision to buy, hold, or scale out comes from a measurement instead of from how the news felt that week. It does not forecast prices. It describes conditions — and conditions are the only thing a working investor can act on without watching charts all day.
Most people do not have one. They have a substitute: a vague sense, assembled from headlines, a colleague’s confidence, and whatever their account balance did last Friday. That substitute has a specific failure mode. It gets most bearish after prices have already fallen and most comfortable after they have already risen, which is exactly backwards. A measured reading is not smarter than you are. It is just steadier than you are, and steadiness is what compounds.
What is a market risk indicator?
A market risk indicator is a measurement of how much downside the current environment is carrying, expressed as a level you can act on. It is built from structural conditions rather than opinion, and its output is a position on a scale — low, moderate, elevated, high — not a target price and not a date.
Think of it the way a structural engineer thinks about load. Nobody predicts the exact moment a bridge fails. You measure the stress it is carrying, and you stay well inside the safe range. A risk reading does the same job for a portfolio: it reads the stress in the system so your exposure can be sized to match it, and so the sizing decision is made by a rule rather than by your mood on the day.
That distinction — condition versus forecast — is the whole thing. A forecast says what will happen. A condition says what is true now. Forecasts cannot be verified until it is too late to use them. Conditions can be read this Sunday, acted on this Sunday, and read again next Sunday.
What does a market risk indicator actually measure?
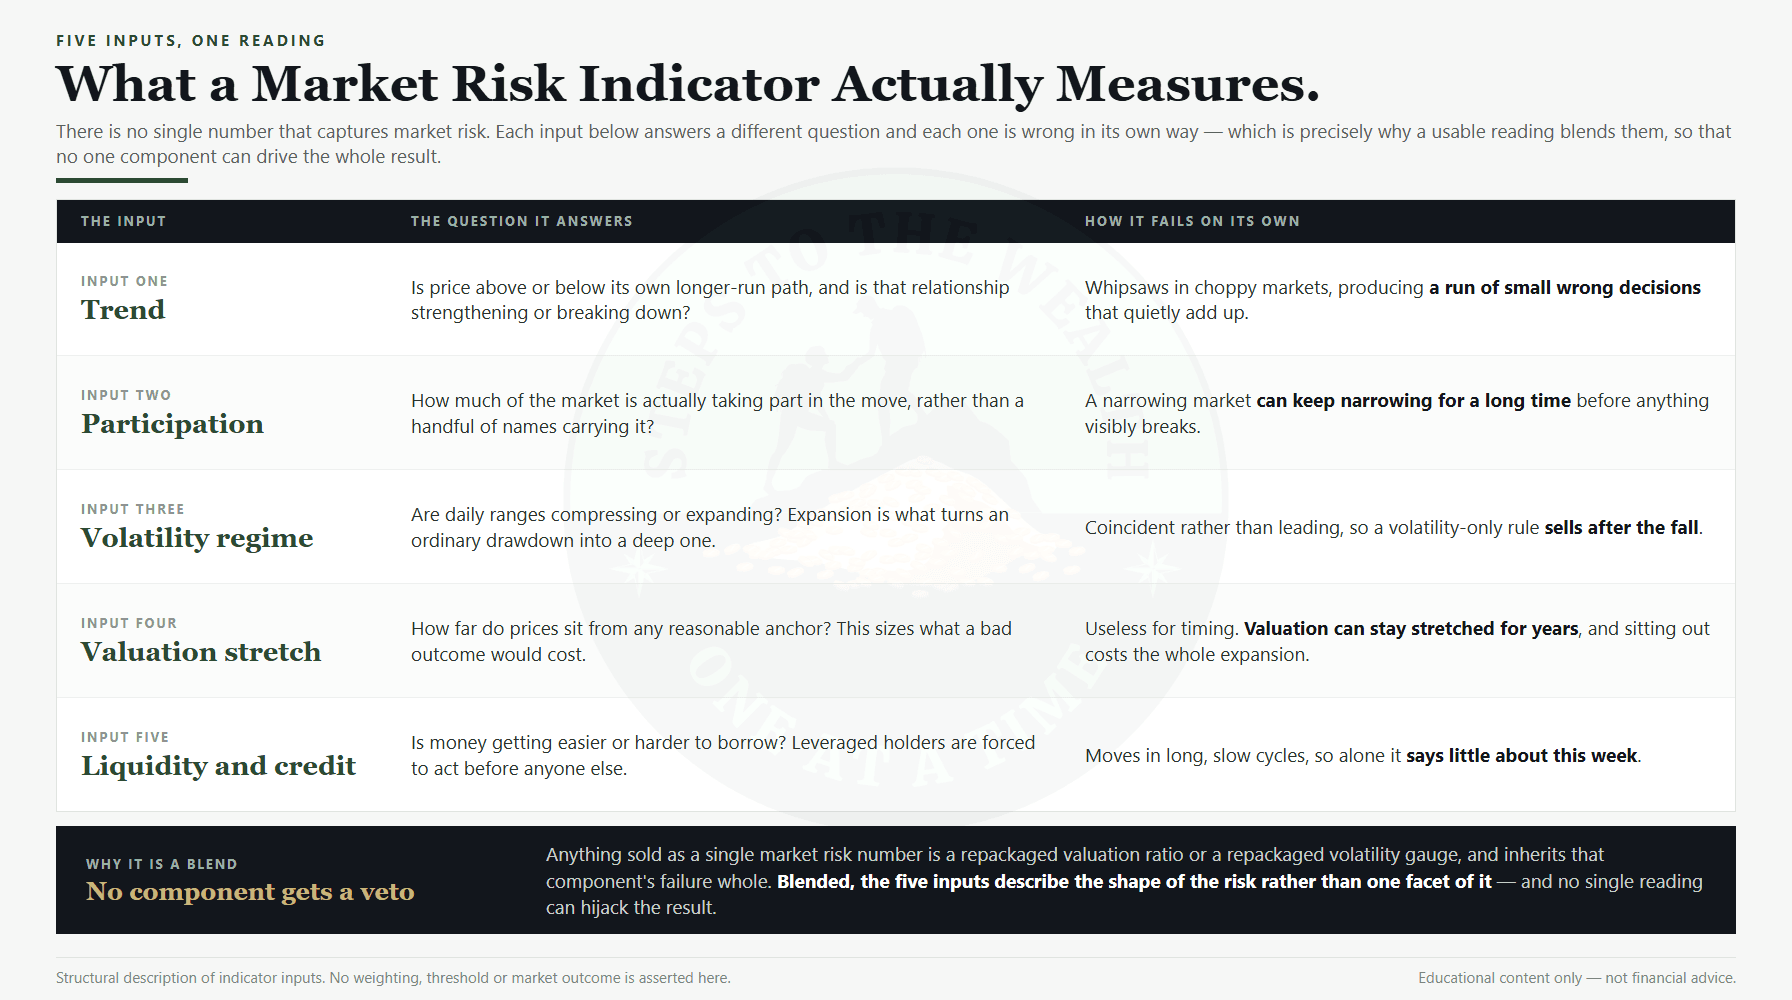
There is no single number that captures market risk. Anything sold as one is either a repackaged valuation ratio or a repackaged volatility gauge, and both fail in well-documented ways. A usable indicator blends several structural inputs so that no single input can drive the whole reading.
- Trend. Whether price is above or below its own longer-run path, and whether that relationship is strengthening or breaking down. Trend is the closest thing markets have to inertia.
- Participation. How much of the market is actually taking part in a move. A rise carried by a handful of names is structurally weaker than the same rise carried broadly, even though the index prints the same number.
- Volatility regime. Not the level of volatility on any one day, but which regime you are in — whether daily ranges are compressing or expanding, because expansion is what turns an ordinary drawdown into a deep one.
- Valuation stretch. How far current prices sit from any reasonable anchor. Valuation is useless for timing and essential for sizing: it tells you what a bad outcome would cost, not when one arrives.
- Liquidity and credit conditions. Whether money is getting easier or harder to borrow. Credit stress usually shows up before equity stress, because leveraged holders are forced to act first.
Each input answers a different question, and each one is wrong in its own way. Blended, they describe the shape of the risk you are standing in rather than one facet of it.
Why no single metric works on its own
Every input above has a failure mode that is obvious in hindsight and invisible while you are inside it.
Valuation can stay stretched for years. An investor who went to cash on valuation alone in a long expansion sits out the entire expansion, and the arithmetic of that decision is brutal — the cost of waiting is not the drawdown you avoided, it is the compounding you never started. Volatility is largely coincident: it tells you the storm is here, not that it is coming, so a volatility-only rule sells after the fall. Trend whipsaws in choppy markets, generating a series of small wrong decisions that add up. Participation is the most useful of the four and the least legible on its own, because a narrowing market can narrow for a long time before it breaks.
This is why the blend matters more than any component, and why a serious reading is a composite. It is also why a risk reading pairs naturally with a portfolio stress test: the indicator tells you what the environment is doing, the stress test tells you what your specific holdings would do inside it. One is about the weather, the other is about your roof.
The four risk zones and the decision each one triggers
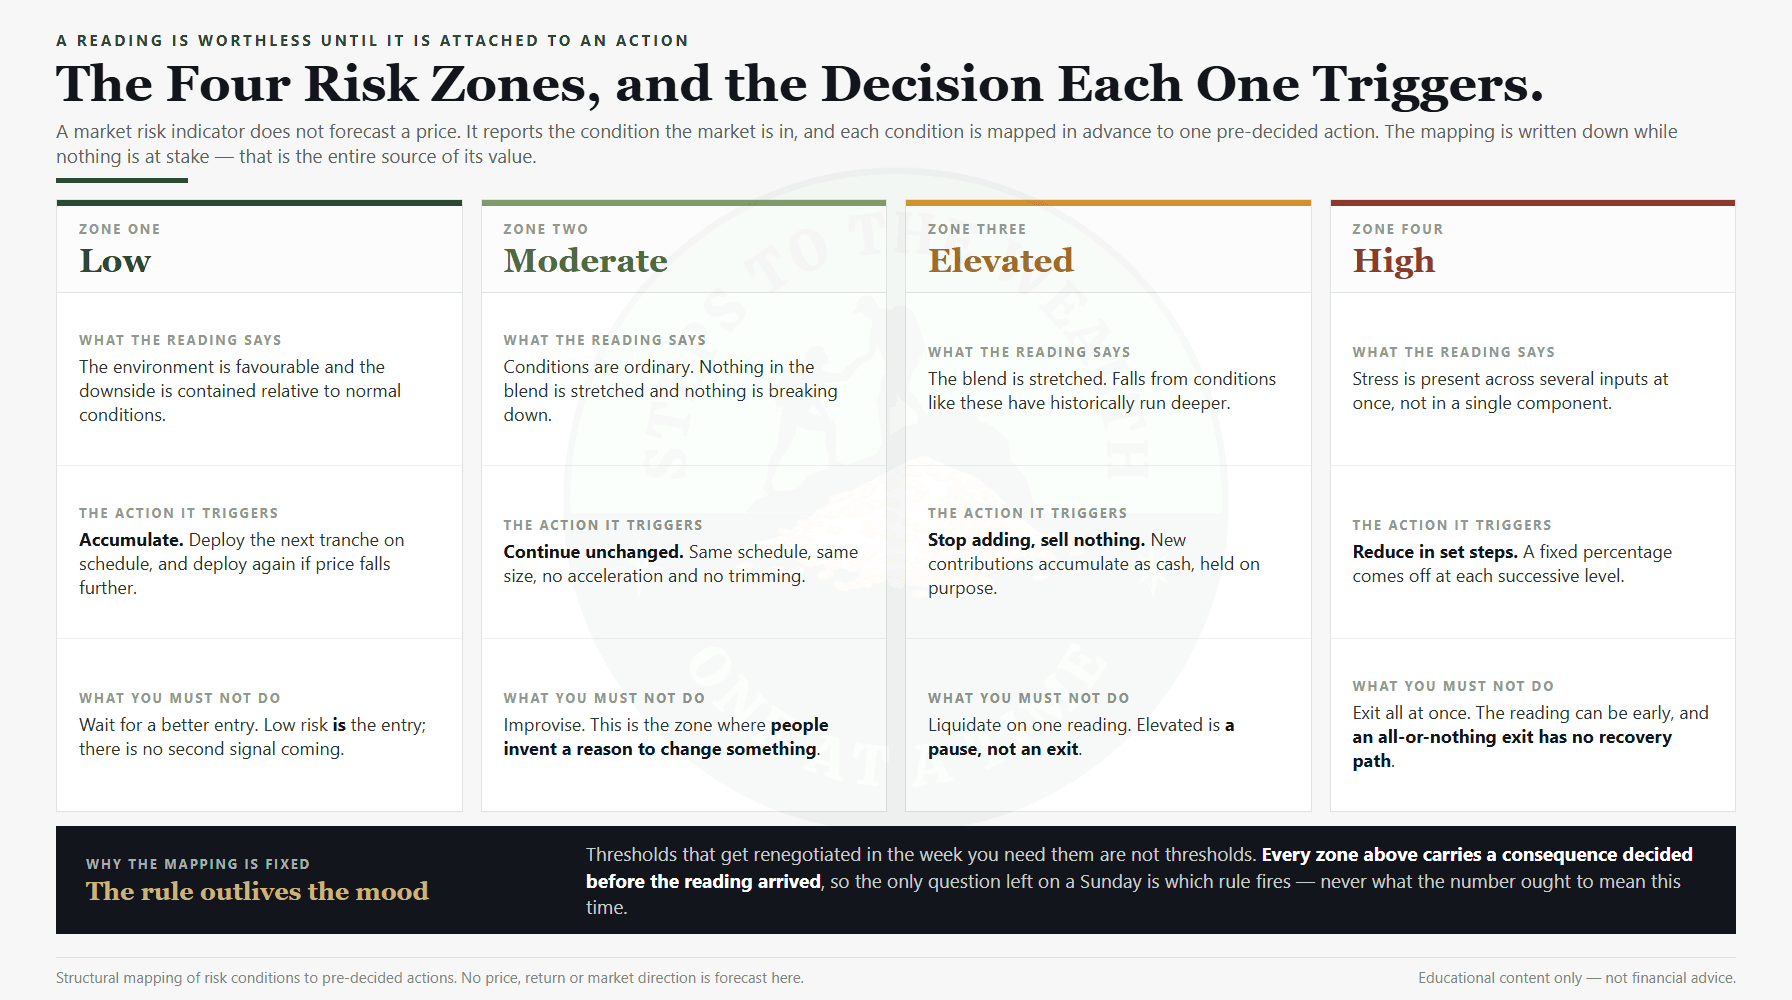
A reading is worthless until it is attached to an action. The point of the zones is not precision — it is that the mapping from level to decision is written down before you need it, at a moment when you are calm and nothing is at stake.
Low risk. The environment is favourable and the downside is contained. This is when you accumulate. In a risk-first framework, low risk is the buy signal — not a price level, not a headline, not a feeling that things have calmed down.
Moderate risk. Conditions are ordinary. You keep doing what you were doing, at the size you already decided. The discipline being tested here is the discipline of not improvising: moderate is the zone where people invent reasons to change something.
Elevated risk. You stop adding. You do not sell what you hold, and you do not liquidate on a single reading. New contributions accumulate as cash instead of buying into a stretched environment. Holding cash deliberately is a position with a purpose, not a failure to act.
High risk. This is where exposure comes down in steps rather than all at once, selling a set percentage at each successive level. The staged exit exists because the reading can be early, and a staged exit that is early costs you a little, while an all-at-once exit that is wrong costs you the whole recovery.
The numeric bands behind those four labels are yours to set and are far less important than the fact that they never move once set. An indicator whose thresholds get renegotiated in the week you need them is not an indicator. It is a rationalisation with a chart attached.
What acting on the reading looks like in dollars
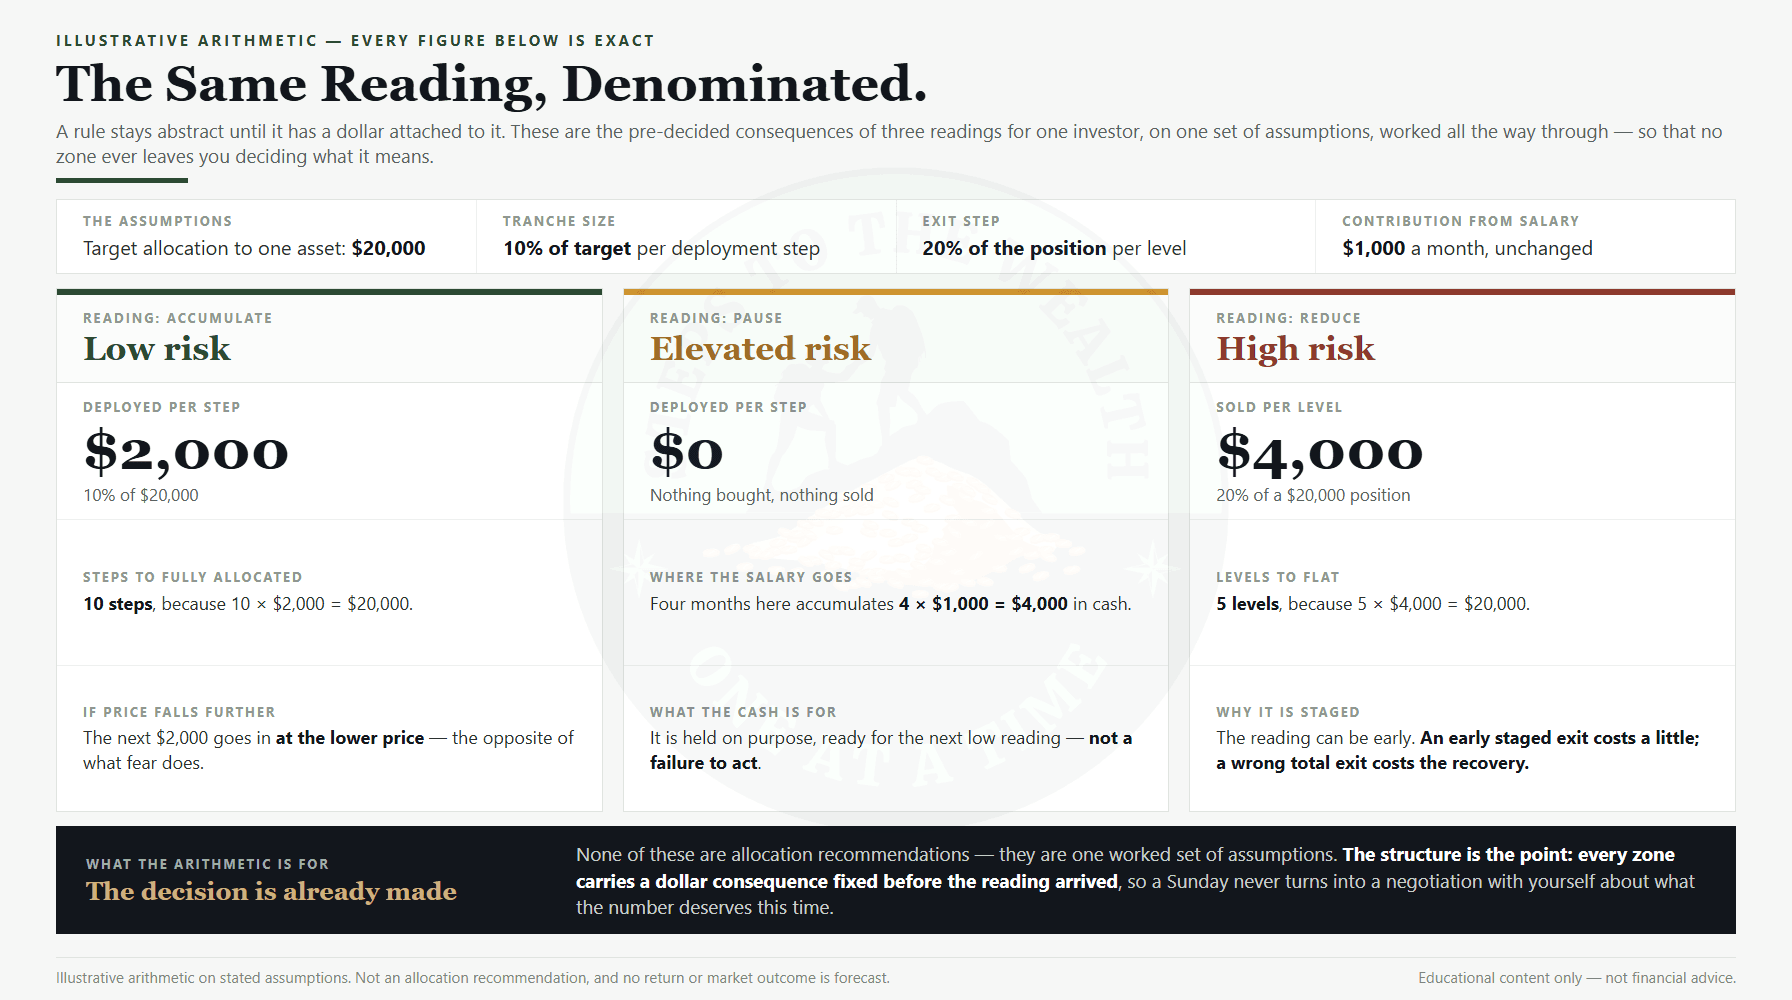
Abstract rules stay abstract until they are denominated. Take an investor with a target allocation of $20,000 to one asset, deployed in tranches of 10% of target, contributing $1,000 a month from salary.
At low risk, each step deploys 10% of $20,000, which is $2,000. Ten such steps take the position from zero to fully allocated. If price falls a further set increment while risk stays low, the next $2,000 goes in at the lower price — that is the entire mechanic of a dynamic DCA strategy, and it is the opposite of what fear does.
At elevated risk, deployment stops. Four months in that zone accumulates 4 × $1,000 = $4,000 in cash, held on purpose and ready. Nothing was sold and nothing was bought.
At high risk, exposure comes down in steps of 20% of the position. On a $20,000 holding that is $4,000 per step, and five steps take the position to flat. Each step is a rule firing, not a judgment call.
The numbers above are illustrative arithmetic, not a recommended allocation. What matters is the structure: every zone has a pre-decided dollar consequence, so the reading never leaves you sitting there deciding what it means. This is also the honest answer to the lump sum versus dollar-cost-averaging question — a risk-driven schedule is not chosen because it produces the highest expected return, it is chosen because it is the one you will actually execute. Several of the common myths about dollar-cost averaging come from comparing it against a version of yourself who never flinches.
Why the reading is weekly, not daily
Risk conditions change over weeks. Prices change every second. Reading the indicator daily does not give you a fresher signal, it gives you the same signal wrapped in noise, and it multiplies the number of moments in which you can talk yourself into acting.
The cost of that is measurable. In a study of 66,465 households from 1991 to 1996, Barber and Odean found the market returned 17.9% annually while the average household earned 16.4% — a gap of 1.5 points. The busiest fifth of traders earned 11.4%, which is 6.5 points behind the market they were trading. The full paper is available from the Haas School of Business at Berkeley. Nothing in that gap is explained by bad analysis. It is explained by frequency.
A weekly cadence is also the only one that survives a real job. The entire premise of investing while working full time is that the system has to fit into the margins of a working week, run in a fixed slot, and produce the same output whether or not you were paying attention on Wednesday.
What a market risk indicator will not do
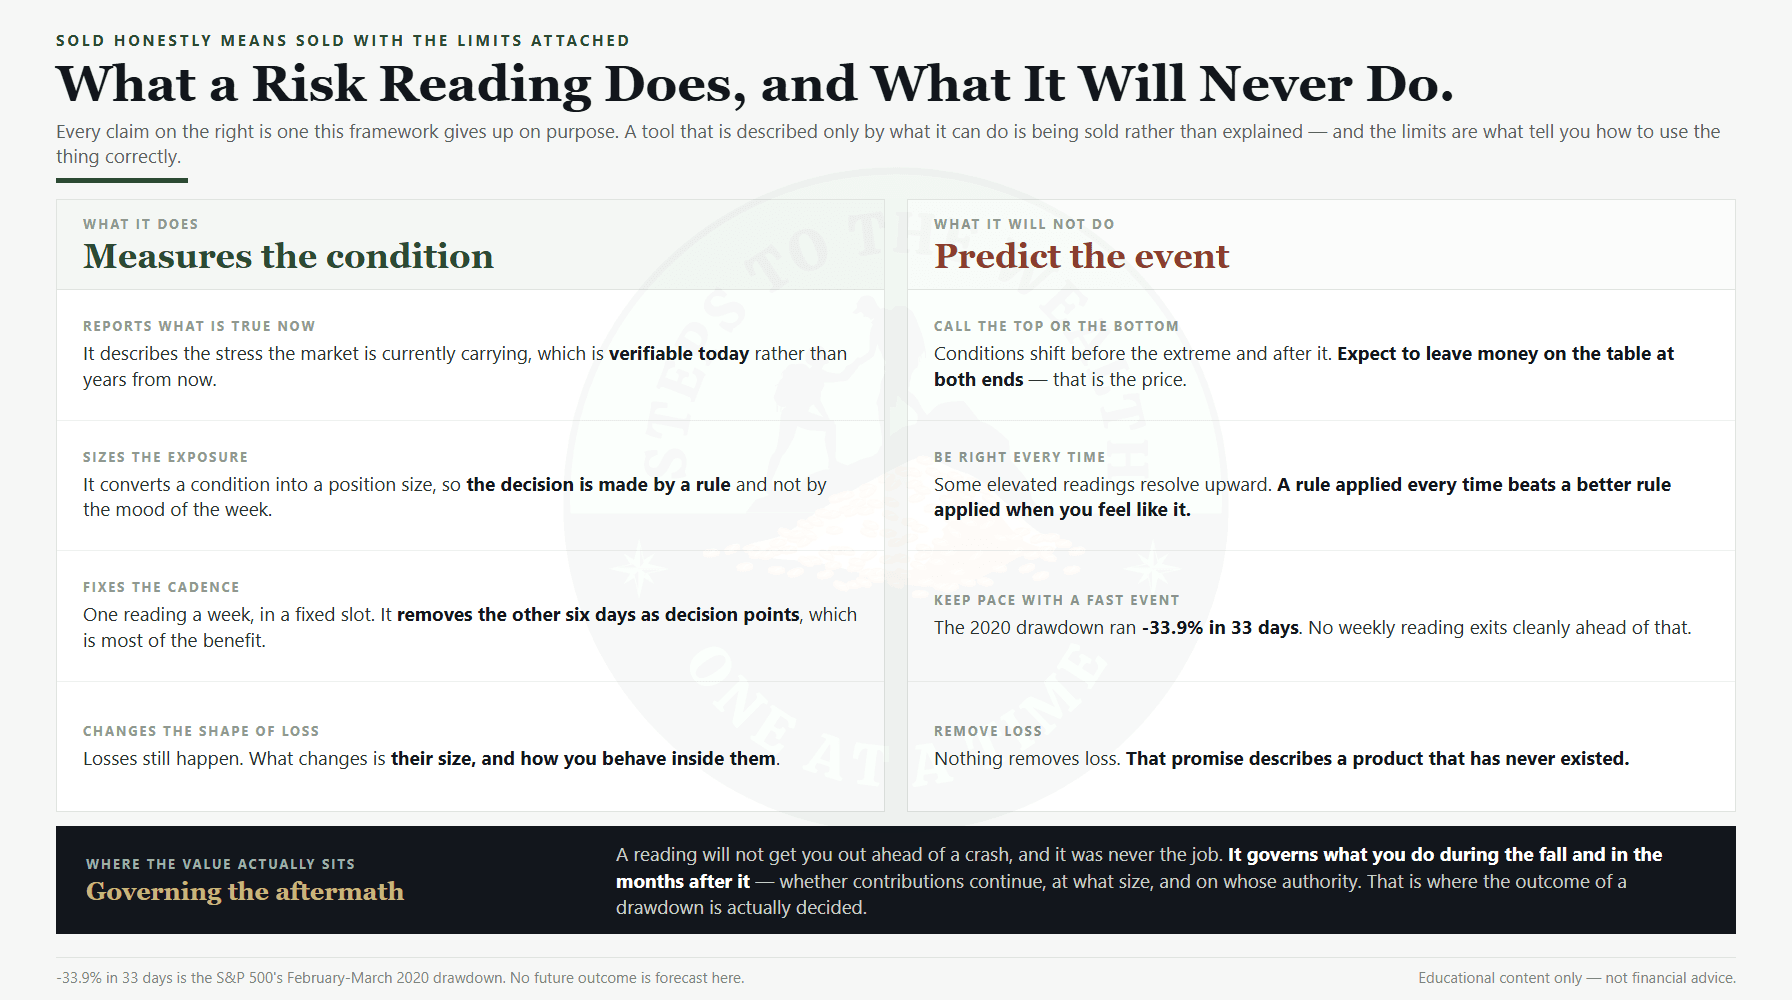
An indicator that is sold honestly has to be sold with its limits attached.
It will not call the top or the bottom. It reads conditions, and conditions shift before the extreme and after it. Expect to leave money on the table at both ends. That is the price of not needing to be right about the turn.
It will be wrong. Some elevated readings resolve upward and some low readings are followed by a fall. A rule that is right most of the time and applied every time beats a rule that is right all of the time and applied when you feel like it, because the second one does not exist.
It lags fast events. The 2020 drawdown ran -33.9% in 33 days; no weekly reading gets you out cleanly ahead of something moving that fast. What a reading does there is govern what you do during and after, which is where the outcome is actually decided — as the COVID crash, the 2008 financial crisis and the 2021-2022 Bitcoin drawdown each show in different ways.
It does not remove loss. It changes the size and the shape of loss. Anyone promising the removal of loss is describing a product that has never existed.
Five ways people misread a market risk indicator
1. Treating the level as a forecast. “Risk is high” does not mean a fall is coming this month. It means the environment is one in which falls have historically been deeper. Those are different claims, and the second one is the only defensible one.
2. Changing the rule after seeing the reading. The moment you renegotiate thresholds in response to a specific reading, you have converted a system back into a set of opinions, and you have done it at the exact moment your judgment is least reliable.
3. Reading it daily. A weekly indicator checked daily is a daily indicator with extra steps. The cadence is part of the design, not packaging.
4. Using it as confirmation. Most people arrive at the reading having already decided what they want to do, then read it selectively. Morningstar’s work on behavioural investor types is a useful mirror here, mostly because it makes it uncomfortable to pretend you are the calm one.
5. Going fully to cash on one high reading. The staged exit exists precisely to prevent this. A binary in-or-out response converts a probabilistic tool into a coin flip, and the cost is not hypothetical — the real cost of waiting and the opportunity cost of time out of the market are both larger than most people estimate before they run the numbers.
How to run the read in practice
The operational version is four steps and takes minutes, not hours.
- Read the level. One number or one zone. Do not read commentary first — commentary is written to be interesting, and interesting is not a risk input.
- Match it to your written rule. The rule was set when nothing was at stake. Its whole value is that it was.
- Act, or confirm no action. Most weeks the correct output is “no change.” Confirming that deliberately is a completed decision, not a skipped one.
- Log it and stop. One line: date, level, action taken. The log is what makes next quarter’s review honest, because memory quietly rewrites what you believed at the time.
Two things sit upstream of all of this and are worth getting right first: the size of the contribution feeding the system, which is usually decided by how much of a raise gets absorbed by lifestyle creep rather than by anything market-related, and the underlying allocation the reading is modulating — the SEC’s investor education site has a plain-English primer on asset allocation that is a reasonable starting point. If you are trying to work out whether your total is on track at all, retirement savings by age gives the benchmarks.
Where to get a reading you did not build yourself
Building a composite indicator from scratch is real work: sourcing the inputs, deciding the weights, and then, hardest of all, not touching the weights. Most people with a full-time job will not do it, and pretending otherwise is how systems end up existing only on paper.
Steps To The Wealth Weekly lands every Sunday with a plain-English risk reading across five major assets, plus the action each level triggers. No predictions, no countdown timers, no urgency. Just the reading, so the decision in front of you is which rule fires rather than what you think about the market this week.
If that is not for you, no hard feelings — the framework in this article works just as well with an indicator you build yourself, provided you write the rules down before you need them.
Frequently asked questions
What is a market risk indicator?
A market risk indicator is a single reading that measures how much downside risk the current market environment is carrying, expressed as a level such as low, moderate, elevated or high. It blends structural inputs like trend, participation, volatility regime, valuation and credit conditions into one number so that an investor can size exposure by rule rather than by opinion. It measures conditions; it does not predict prices.
How often should I check a market risk indicator?
Once a week is the right cadence for most long-term investors. Risk conditions shift over weeks, so daily checking adds noise rather than information, and it multiplies the opportunities to act impulsively. Barber and Odean found the busiest fifth of traders earned 11.4% annually against a market return of 17.9% over the same period.
Can a market risk indicator predict a crash?
No. It measures the stress in the current environment, not the timing of any future event. A high reading means falls have historically been deeper from conditions like these, which is a statement about the distribution of outcomes rather than a forecast of one. It will also lag fast events — the 2020 drawdown ran -33.9% in 33 days.
What should I do when the market risk indicator is high?
Follow the rule you wrote down before the reading arrived, which typically means stop adding new money and reduce exposure in set steps rather than all at once. The staged approach exists because the reading can be early. What you should not do is invent a new response after seeing the number.
Do I need a risk indicator if I just dollar-cost average?
Not strictly. A fixed schedule works and beats improvising. A risk reading adds one thing: it varies the size of what you deploy according to conditions, so more capital goes to work when the environment is favourable and less when it is stretched, without ever requiring you to predict anything.
Educational content only — not financial advice. Nothing here is a recommendation to buy or sell any security. Figures used are illustrative arithmetic or cited historical data, and past performance does not indicate future results.