
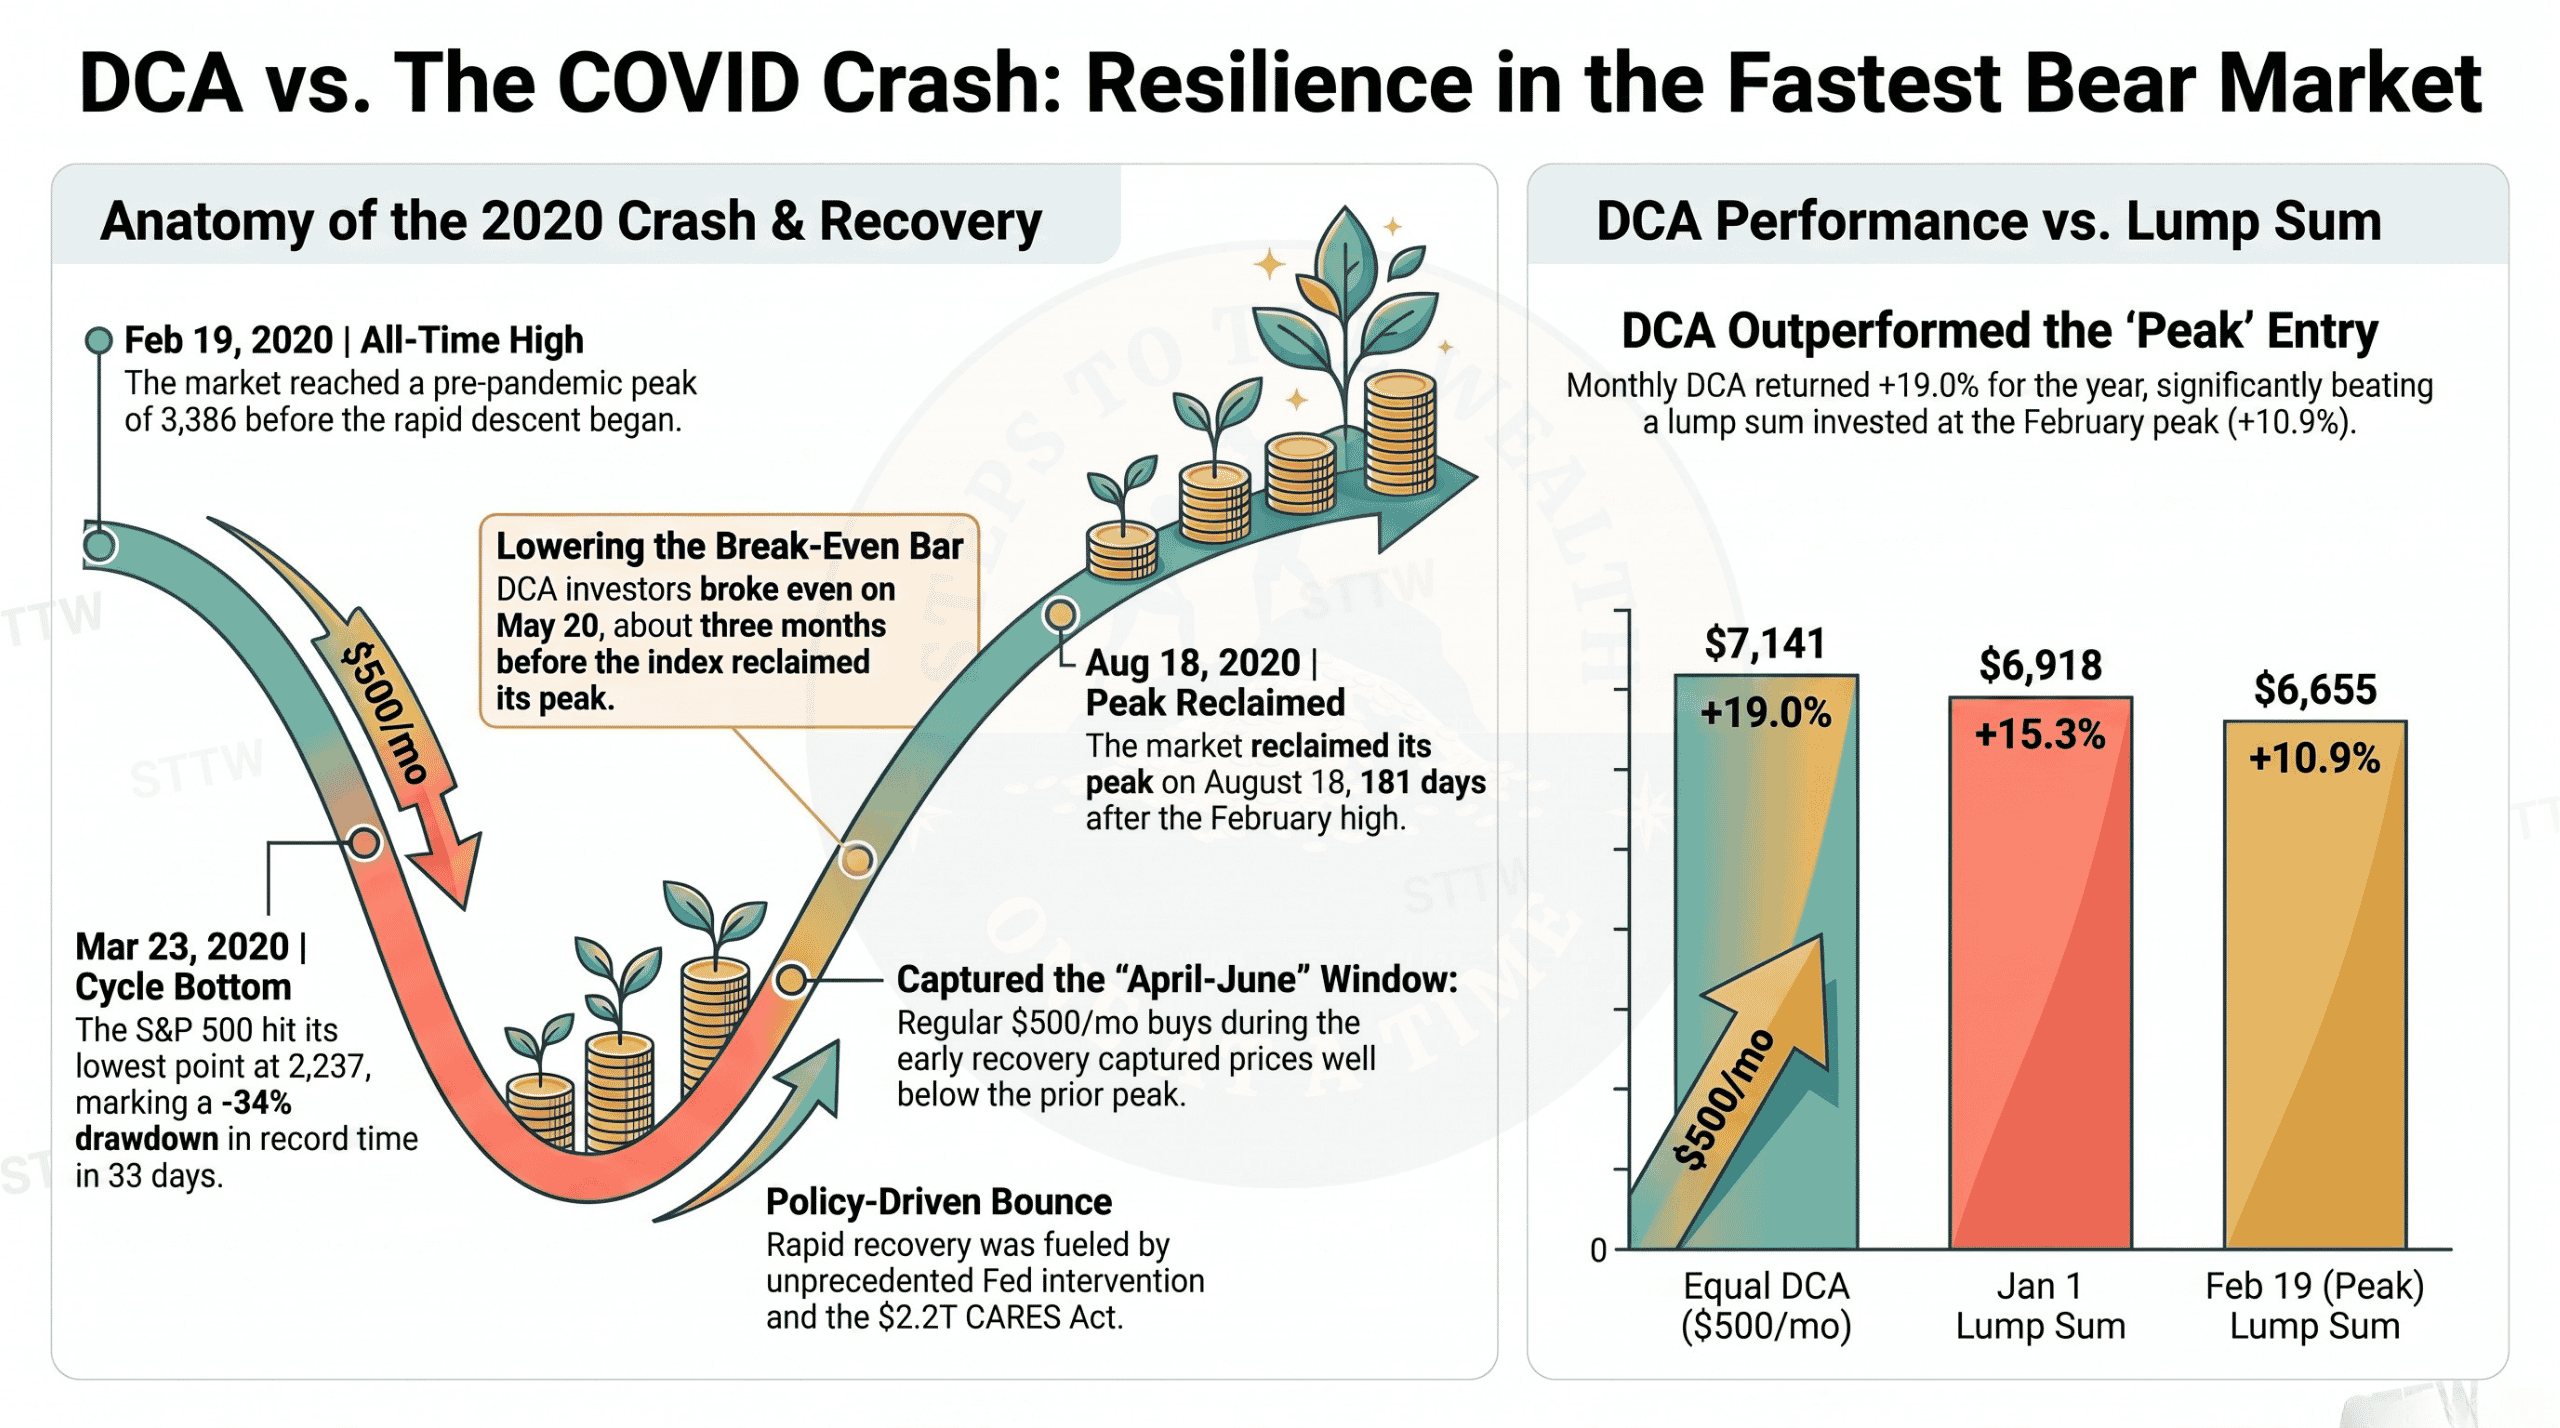
The COVID crash of February and March 2020 was unusual in two ways: it was the fastest bear market in U.S. equity history, and the fastest recovery from a drawdown that deep. Peak to -34% in 33 calendar days. Prior peak reclaimed 148 days after the bottom. This article runs a real dollar-cost average through the entire 2020 window and shows exactly what happened to the money — because the speed of this particular cycle made the usual DCA versus lump-sum debate behave in a counterintuitive way.
Educational content only — not financial advice. Past performance is not indicative of future results.
Every S&P 500 level below is a daily close, verified against a full daily price series before publication.
On this page
- What would DCA into the S&P 500 through the COVID crash have returned?
- How deep was the COVID crash?
- Did DCA beat lump sum during the COVID crash?
- Why did the S&P 500 recover so fast from the COVID crash?
- How does equal DCA compare to dynamic DCA through the COVID crash?
- How long did it take the S&P 500 to recover from the COVID crash?
- Should you keep investing during a fast crash?
- Frequently asked questions
What would DCA into the S&P 500 through the COVID crash have returned?
A $500-per-month equal DCA into the S&P 500 across 2020 — twelve buys on the first trading day of each month, $6,000 invested in total — would have ended the year worth approximately $7,141. A gain of roughly 19%, driven by three specific buys in April, May, and June that landed while price was still well below the February peak but while the eventual recovery was already underway.
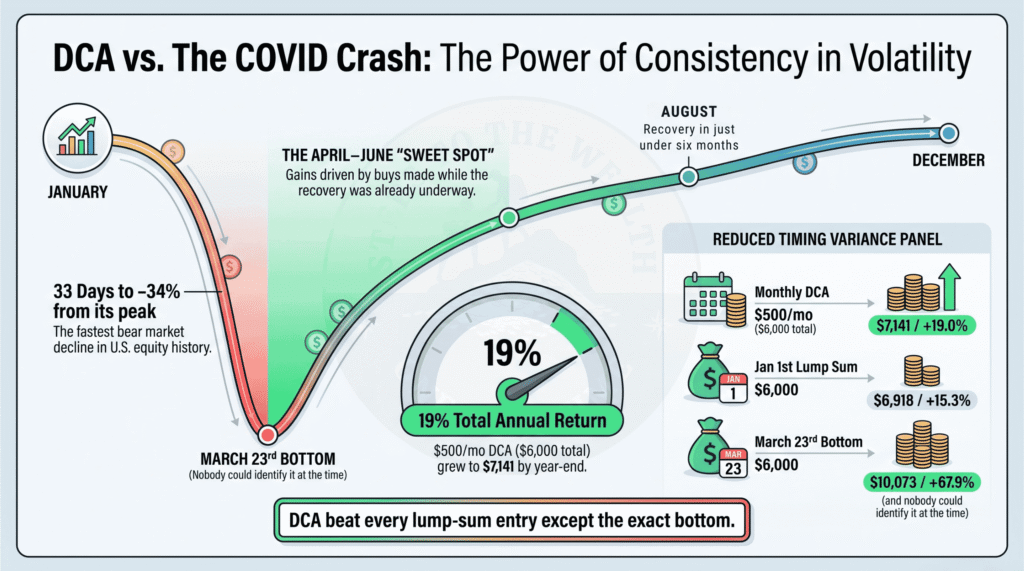
Those twelve buys accumulated 1.9013 index units at an average cost basis of 3,155.75, against a December 31 close of 3,756.07. Here is every buy made through the COVID crash year:
| Buy date | S&P 500 close | Units bought with $500 |
|---|---|---|
| Jan 2, 2020 | 3,257.85 | 0.15348 |
| Feb 3, 2020 | 3,248.92 | 0.15390 |
| Mar 2, 2020 | 3,090.23 | 0.16180 |
| Apr 1, 2020 | 2,470.50 | 0.20239 |
| May 1, 2020 | 2,830.71 | 0.17663 |
| Jun 1, 2020 | 3,055.73 | 0.16363 |
| Jul 1, 2020 | 3,115.86 | 0.16047 |
| Aug 3, 2020 | 3,294.61 | 0.15176 |
| Sep 1, 2020 | 3,526.65 | 0.14178 |
| Oct 1, 2020 | 3,380.80 | 0.14789 |
| Nov 2, 2020 | 3,310.24 | 0.15105 |
| Dec 1, 2020 | 3,662.45 | 0.13652 |
| Total | Avg basis 3,155.75 | 1.90129 |
Notice the April line. That single buy, placed nine days after the low of the COVID crash, purchased more units than any other month in the year — 32% more than the January buy for the same $500. That is the entire mechanic of dollar-cost averaging, visible in one row.
This is a better result than the same investor would have gotten from a lump sum on January 2, 2020, and better than a lump sum at the February peak. It is of course far worse than a lump sum at the March 23 bottom — but nobody knew March 23 was the bottom while they were standing in it.
The outcome is a clean example of DCA’s core design goal: reduce the variance of outcomes around timing, at the cost of giving up best-case returns.
How deep was the COVID crash?
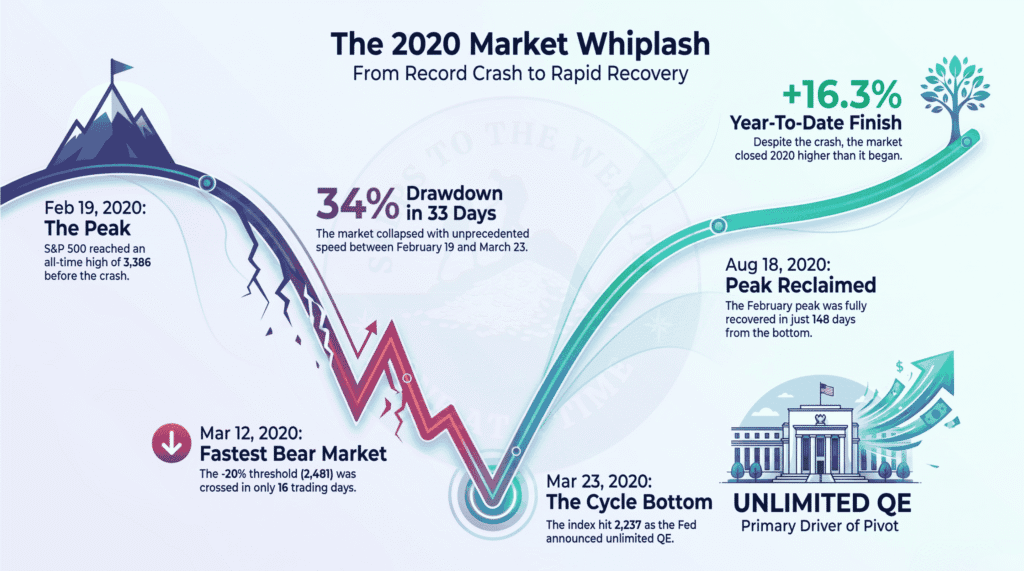
The S&P 500 peaked at 3,386.15 on February 19, 2020 and bottomed at 2,237.40 on March 23, 2020 — a drawdown of 33.9% in just 33 calendar days, or 23 trading days. It crossed the official bear-market threshold, a decline of 20% from the peak, on March 12 after only 16 trading days. That is the fastest bear market in U.S. equity history by that measure.
| Date | S&P 500 close | Event |
|---|---|---|
| Feb 19, 2020 | 3,386.15 | All-time high at the time |
| Mar 9, 2020 | 2,746.56 | First circuit-breaker halt; oil price war |
| Mar 12, 2020 | 2,480.64 | -20% crossed, 16 trading days from the peak |
| Mar 15, 2020 | — | Fed emergency cut to 0-0.25%; QE resumed |
| Mar 23, 2020 | 2,237.40 | Cycle bottom; Fed announces open-ended QE |
| Apr 1, 2020 | 2,470.50 | Recovery base |
| Aug 18, 2020 | 3,389.78 | February peak reclaimed, 148 days from the bottom |
| Dec 31, 2020 | 3,756.07 | Year-end: +16.3% for the year, +10.9% above the February peak |
The COVID crash was driven by a genuine shock — an unprecedented global shutdown, with earnings expectations rewriting themselves weekly. The recovery was driven by the fastest and largest monetary and fiscal response in modern history. Neither was knowable in real time. The NBER business-cycle record dates the associated recession from February 2020 to April 2020 — two months, the shortest on record.
Did DCA beat lump sum during the COVID crash?
Equal DCA across 2020 beat every lump-sum deployment except the one at the March 23 bottom. The speed of the recovery, and the fact that it began before anyone realized the crash was over, meant the lump-sum-wins-two-thirds-of-the-time historical average did not apply to this particular cycle.
Four scenarios for $6,000 deployed across the COVID crash year, all valued at the December 31 close of 3,756.07:
| Strategy | Entry | Units | Dec 31 value | Return |
|---|---|---|---|---|
| Equal DCA, $500/mo Jan-Dec | Avg basis 3,155.75 | 1.9013 | $7,141 | +19.0% |
| Lump sum, Jan 2, 2020 | 3,257.85 | 1.8417 | $6,918 | +15.3% |
| Lump sum, Feb 19, 2020 (peak) | 3,386.15 | 1.7719 | $6,655 | +10.9% |
| Lump sum, Mar 23, 2020 (bottom) | 2,237.40 | 2.6817 | $10,073 | +67.9% |
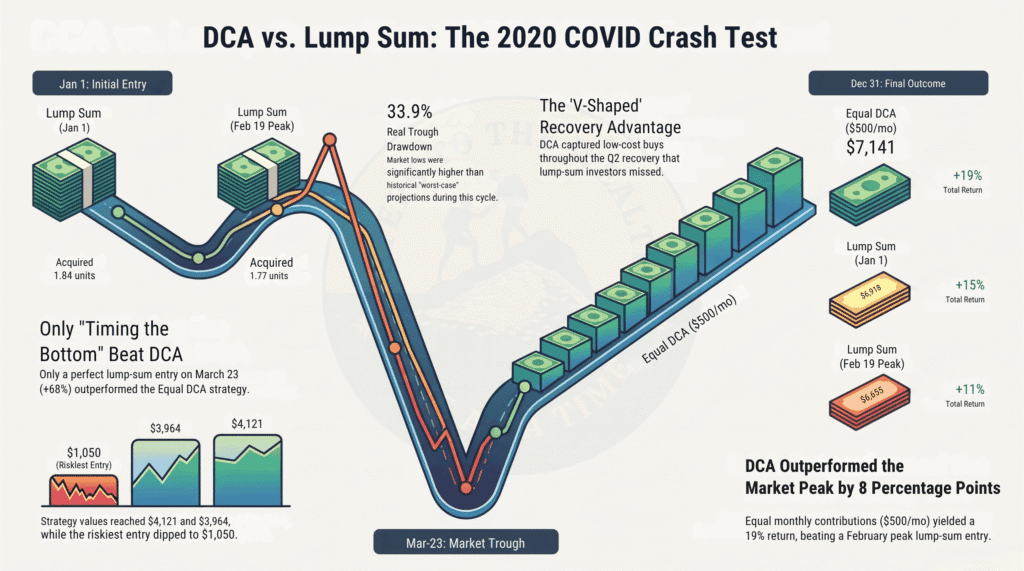
DCA beat the peak lump sum by roughly 8 percentage points, and the January lump sum by roughly 4. That is not the usual historical pattern. It happened specifically because the crash was short enough, and the recovery fast enough, that DCA’s spread-the-risk mechanic captured the dip without getting buried in an extended drawdown.
One honest caveat, because it matters
This comparison is not apples-to-apples on time in the market. The lump sums had all $6,000 exposed from a single date. The DCA plan running through the COVID crash had its average dollar exposed for only about half the year — and the back half of 2020 was a rising market.
So part of DCA’s margin here is genuine: the cheap April, May, and June buys did real work. And part of it is simply that a later average entry beat an entry made immediately before a 34% drawdown. Read this as one cycle where the mechanic paid, not as evidence that DCA beats lump sum in general. Across history, it usually does not.
That distinction is the whole reason to test a plan against specific historical windows rather than trusting a slogan in either direction.
Why did the S&P 500 recover so fast from the COVID crash?
The S&P 500 reclaimed its prior peak within about five months of the March bottom primarily because the policy response was immediate, coordinated, and unprecedented in scale. The Fed cut rates to 0-0.25% on March 15 and announced open-ended asset purchases on March 23 — the exact day of the bottom — expanding its balance sheet by roughly $3 trillion within three months. Fiscal stimulus, the $2.2 trillion CARES Act, was signed on March 27.
Four factors, in rough order of impact:
- Monetary response. Rate cuts and open-ended QE established a floor under risk assets within two weeks of the bear-market threshold.
- Fiscal response. The CARES Act plus subsequent supplemental stimulus materially supported consumer demand and corporate balance sheets.
- Earnings composition. Technology, e-commerce, and digital infrastructure names saw accelerated demand, lifting index earnings faster than the real economy recovered.
- No banking crisis. Unlike 2008, there was no systemic failure in financial plumbing. The shock was exogenous and the transmission mechanism stayed intact.
This matters for how you generalize the COVID crash outcome: it was a shock-and-response cycle, not a structural bear market. Applying the recovery speed of 2020 to a future crash with different causes is a mistake. The 2008 precedent, where recovery took 5.5 years, is equally relevant — and a plan that only works in a 2020-shaped crash is not a plan.
How does equal DCA compare to dynamic DCA through the COVID crash?
Dynamic DCA — risk-weighted position sizing that scales up buys when market risk reads Low — would have outperformed equal DCA in the 2020 window, but by a smaller margin than in slower crashes. The speed of the recovery compressed the window in which the risk signals could actually fire.
The mechanics played out like this:
- January to early February 2020. Risk readings were High: elevated valuation, bullish sentiment. Dynamic DCA would have reduced or paused buys. Equal DCA kept buying above 3,200.
- Late February through March. Sentiment collapsed and valuations compressed. Risk rolled to Low by mid-March. Dynamic DCA would have scaled buys up to two or three times standard size.
- April through July. Risk stayed Medium-to-Low as price recovered. Dynamic DCA would have sized up into the first two months of the recovery.
- August onward. Risk climbed back to Medium and High as the index made new highs. Dynamic DCA would have tapered.
The catch, in the COVID crash specifically, is execution rather than arithmetic. Dynamic DCA requires a framework that fires risk readings in near-real time, and an operator willing to act on them. In March 2020 most risk signals were reading Low. Most investors were paralyzed. The engine is only as good as the willingness to place the oversized buys the framework calls for.
Equal DCA’s advantage remains its simplicity. It required the investor to do nothing except not stop. Dynamic DCA requires leaning into the worst week of the cycle. In a 33-day crash there are only three or four scheduled buy dates inside the sharpest part of the drawdown — missing even one is expensive.
How long did it take the S&P 500 to recover from the COVID crash?
The S&P 500 reclaimed its February 19, 2020 peak on August 18, 2020 — 148 calendar days from the March 23 bottom, and 181 days, just under six months, from the peak itself. For comparison, the 2008 bear market took 5.5 years to reclaim its prior peak. Measured peak to reclaim, the COVID crash recovered roughly 11 times faster.
For the DCA investor, break-even came far earlier: May 20, 2020, with the index at 2,971.61 — still 12.2% below its February peak. That was the date the running position moved back above the total invested in it and stayed there for the remainder of the year.
The reason is the cost basis. Each buy in April (2,470.50), May (2,830.71), and June (3,055.73) landed below the January entry and pulled the running average down. The investor never needed the index to reach its prior peak in order to be whole. They only needed price to cross their own average cost — which happened three months before the index recovered.
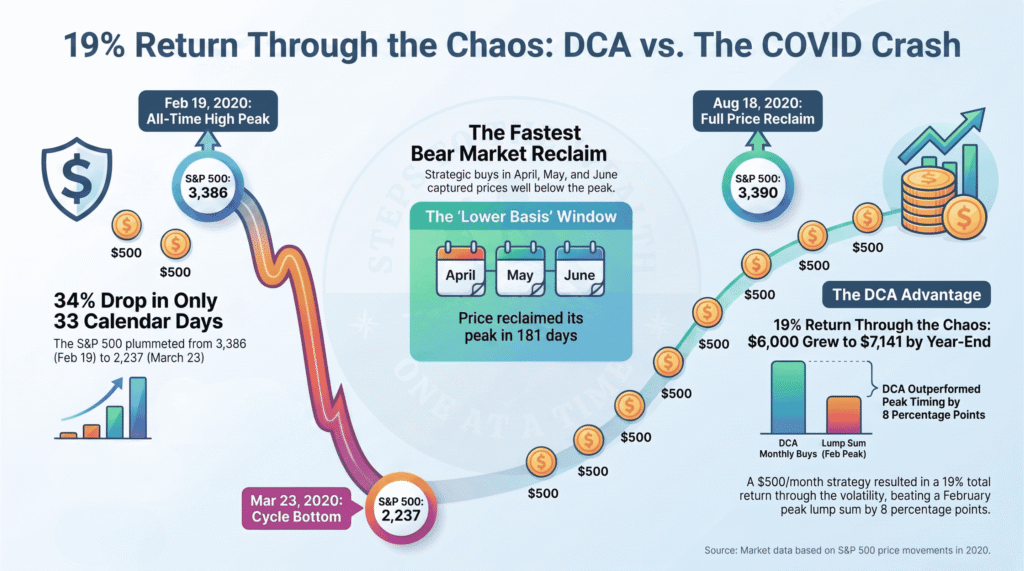
This is the asymmetry that made DCA through the COVID crash more durable than it looks from the outside. The headline “the market is still down 12%” and the reality “my position is profitable” can be true on the same day.
Should you keep investing during a fast crash?
Whether you should keep investing during a fast crash depends on the same four things that govern any crash decision: time horizon, financial stability, thesis integrity, and a pre-committed plan. Fast crashes add a fifth consideration — the recovery can outrun your decision-making speed. By the time you feel comfortable buying again, the window is usually closed.
A practical checklist for fast crashes specifically:
- Do not wait for confirmation. In 2020, confirmation that the crash was over arrived in August. The bottom was in March. Anyone waiting for the all-clear missed the entire recovery.
- Treat the scheduled buy as the default action. If your plan says buy on the first of the month, and the first arrives during a crash, the default is to execute — not to pause and reassess. Pauses during fast crashes are almost always wrong in hindsight.
- Scale up only if your framework says so. If you run dynamic DCA and your risk readings roll to Low, the entire point of the system is to buy more at that moment. Not less. Not the same. More — but because the framework said so, not because the headlines felt bad.
- Do not over-learn from 2020. The COVID crash recovery was historically fast because the policy response was historically aggressive. The next crash might behave like 2008, or like 1973, or like nothing on record. The 2021-2022 Bitcoin drawdown is the useful counterweight: the same monthly discipline, in a different asset class, took roughly 34 months to reach break-even. Your plan should survive several cycle shapes, not be optimized for one.
None of this requires predicting anything. It requires deciding in advance what you will do, and then doing it while it feels wrong. If that sounds unremarkable, that is the point — and if this approach is not for you, no hard feelings.
Run this scenario with your own numbers
The $500-per-month baseline above is illustrative. Your plan is probably different: a different starting month, a different contribution, a different end date, a different strategy.
The DCA Simulator lets you run this exact scenario with your own inputs, compare equal versus dynamic DCA head to head, and replay the COVID crash timeline at different buy cadences — weekly, bi-weekly, monthly — to see how frequency changed the outcome. DCA Simulator Pro adds the 2008 financial crisis, the 2022 crypto drawdown, and the dot-com bust for comparative testing, so you can check whether a plan that survives 2020 also survives a crash that does not bounce.
If you would rather have the risk readings delivered instead of running them yourself, that is what the weekly newsletter does. More on who writes this and why on the about page.
Frequently asked questions
What was the lowest S&P 500 price during the COVID crash?
The S&P 500’s cycle low on a closing basis was 2,237.40 on March 23, 2020 — reached the same day the Federal Reserve announced open-ended quantitative easing. Intraday lows in some March sessions printed below 2,200; the 2,237.40 figure refers to the daily close.
How long did the COVID bear market last?
The COVID crash ran from the February 19, 2020 peak to the March 23, 2020 bottom — 33 calendar days, or 23 trading days. It is the shortest bear market in modern S&P 500 history. The prior peak was reclaimed on August 18, 2020, giving a full peak-to-peak cycle of 181 days, just under six months.
Is DCA better than lump sum for the S&P 500?
Across historical rolling windows, lump sum beats DCA approximately two-thirds of the time on expected value (Vanguard, 2012). DCA reduces the variance of outcomes: better worst case, worse best case. The COVID crash was an exception in which DCA beat most lump-sum timings inside a single calendar year, because the crash was short and the recovery fast. Note also that a 12-month DCA has less time in the market than a January lump sum, which flatters DCA in any year that finishes higher than it started.
How much would $100 per month have been worth after DCA through 2020?
Approximately $1,428 on $1,200 invested, using the same cost-basis logic as the $500-per-month example — a gain of roughly 19% by December 31, 2020. The percentage return is identical at any contribution size, because scaling every buy by the same factor scales the ending value by the same factor.
What is a circuit breaker in the stock market?
A circuit breaker is an automated trading halt triggered when an index falls by a set percentage in a single session. U.S. markets use three levels: Level 1 at -7%, Level 2 at -13%, and Level 3 at -20%. Levels 1 and 2 trigger 15-minute halts; Level 3 halts trading for the rest of the day. Four Level 1 halts fired during the COVID crash — March 9, 12, 16, and 18 — the first time circuit breakers had triggered since 1997.
Did the S&P 500 finish 2020 higher than it started?
Yes. The index closed 2020 at 3,756.07 against 3,230.78 at the end of 2019, a price return of +16.3% for the year, despite the 33.9% drawdown of the COVID crash inside it. A separate and often-confused figure is +10.9%, which is where the year-end close sat relative to the February 19 peak.
Educational content only — not financial advice. Nothing in this article is a recommendation to buy, sell, or hold any asset. Past performance is not indicative of future results. Do your own research.