
Most “DCA works” content online uses cherry-picked windows. This article does the opposite. It takes the single most punishing 24-month stretch in recent crypto history — January 2021 through December 2022 — and shows exactly what a DCA Bitcoin plan would have returned. Real daily-close prices. No smoothing. No hindsight.
If you’ve been told DCA “always works,” this is the test case that matters. Every figure below is nominal, and every price can be checked against the daily closes on CoinGecko’s Bitcoin historical data.
Educational content only — not financial advice. Past performance is not indicative of future results.
What this DCA Bitcoin case study covers
- What a DCA Bitcoin plan from 2021 actually returned
- How deep the 2022 Bitcoin crash went
- DCA Bitcoin versus lump sum
- Whether DCA Bitcoin works in bear markets
- Equal DCA versus dynamic DCA
- How long break-even took
- Whether to keep buying through a crash
- The honest summary
What would a DCA Bitcoin plan from 2021 have returned through the 2022 crash?
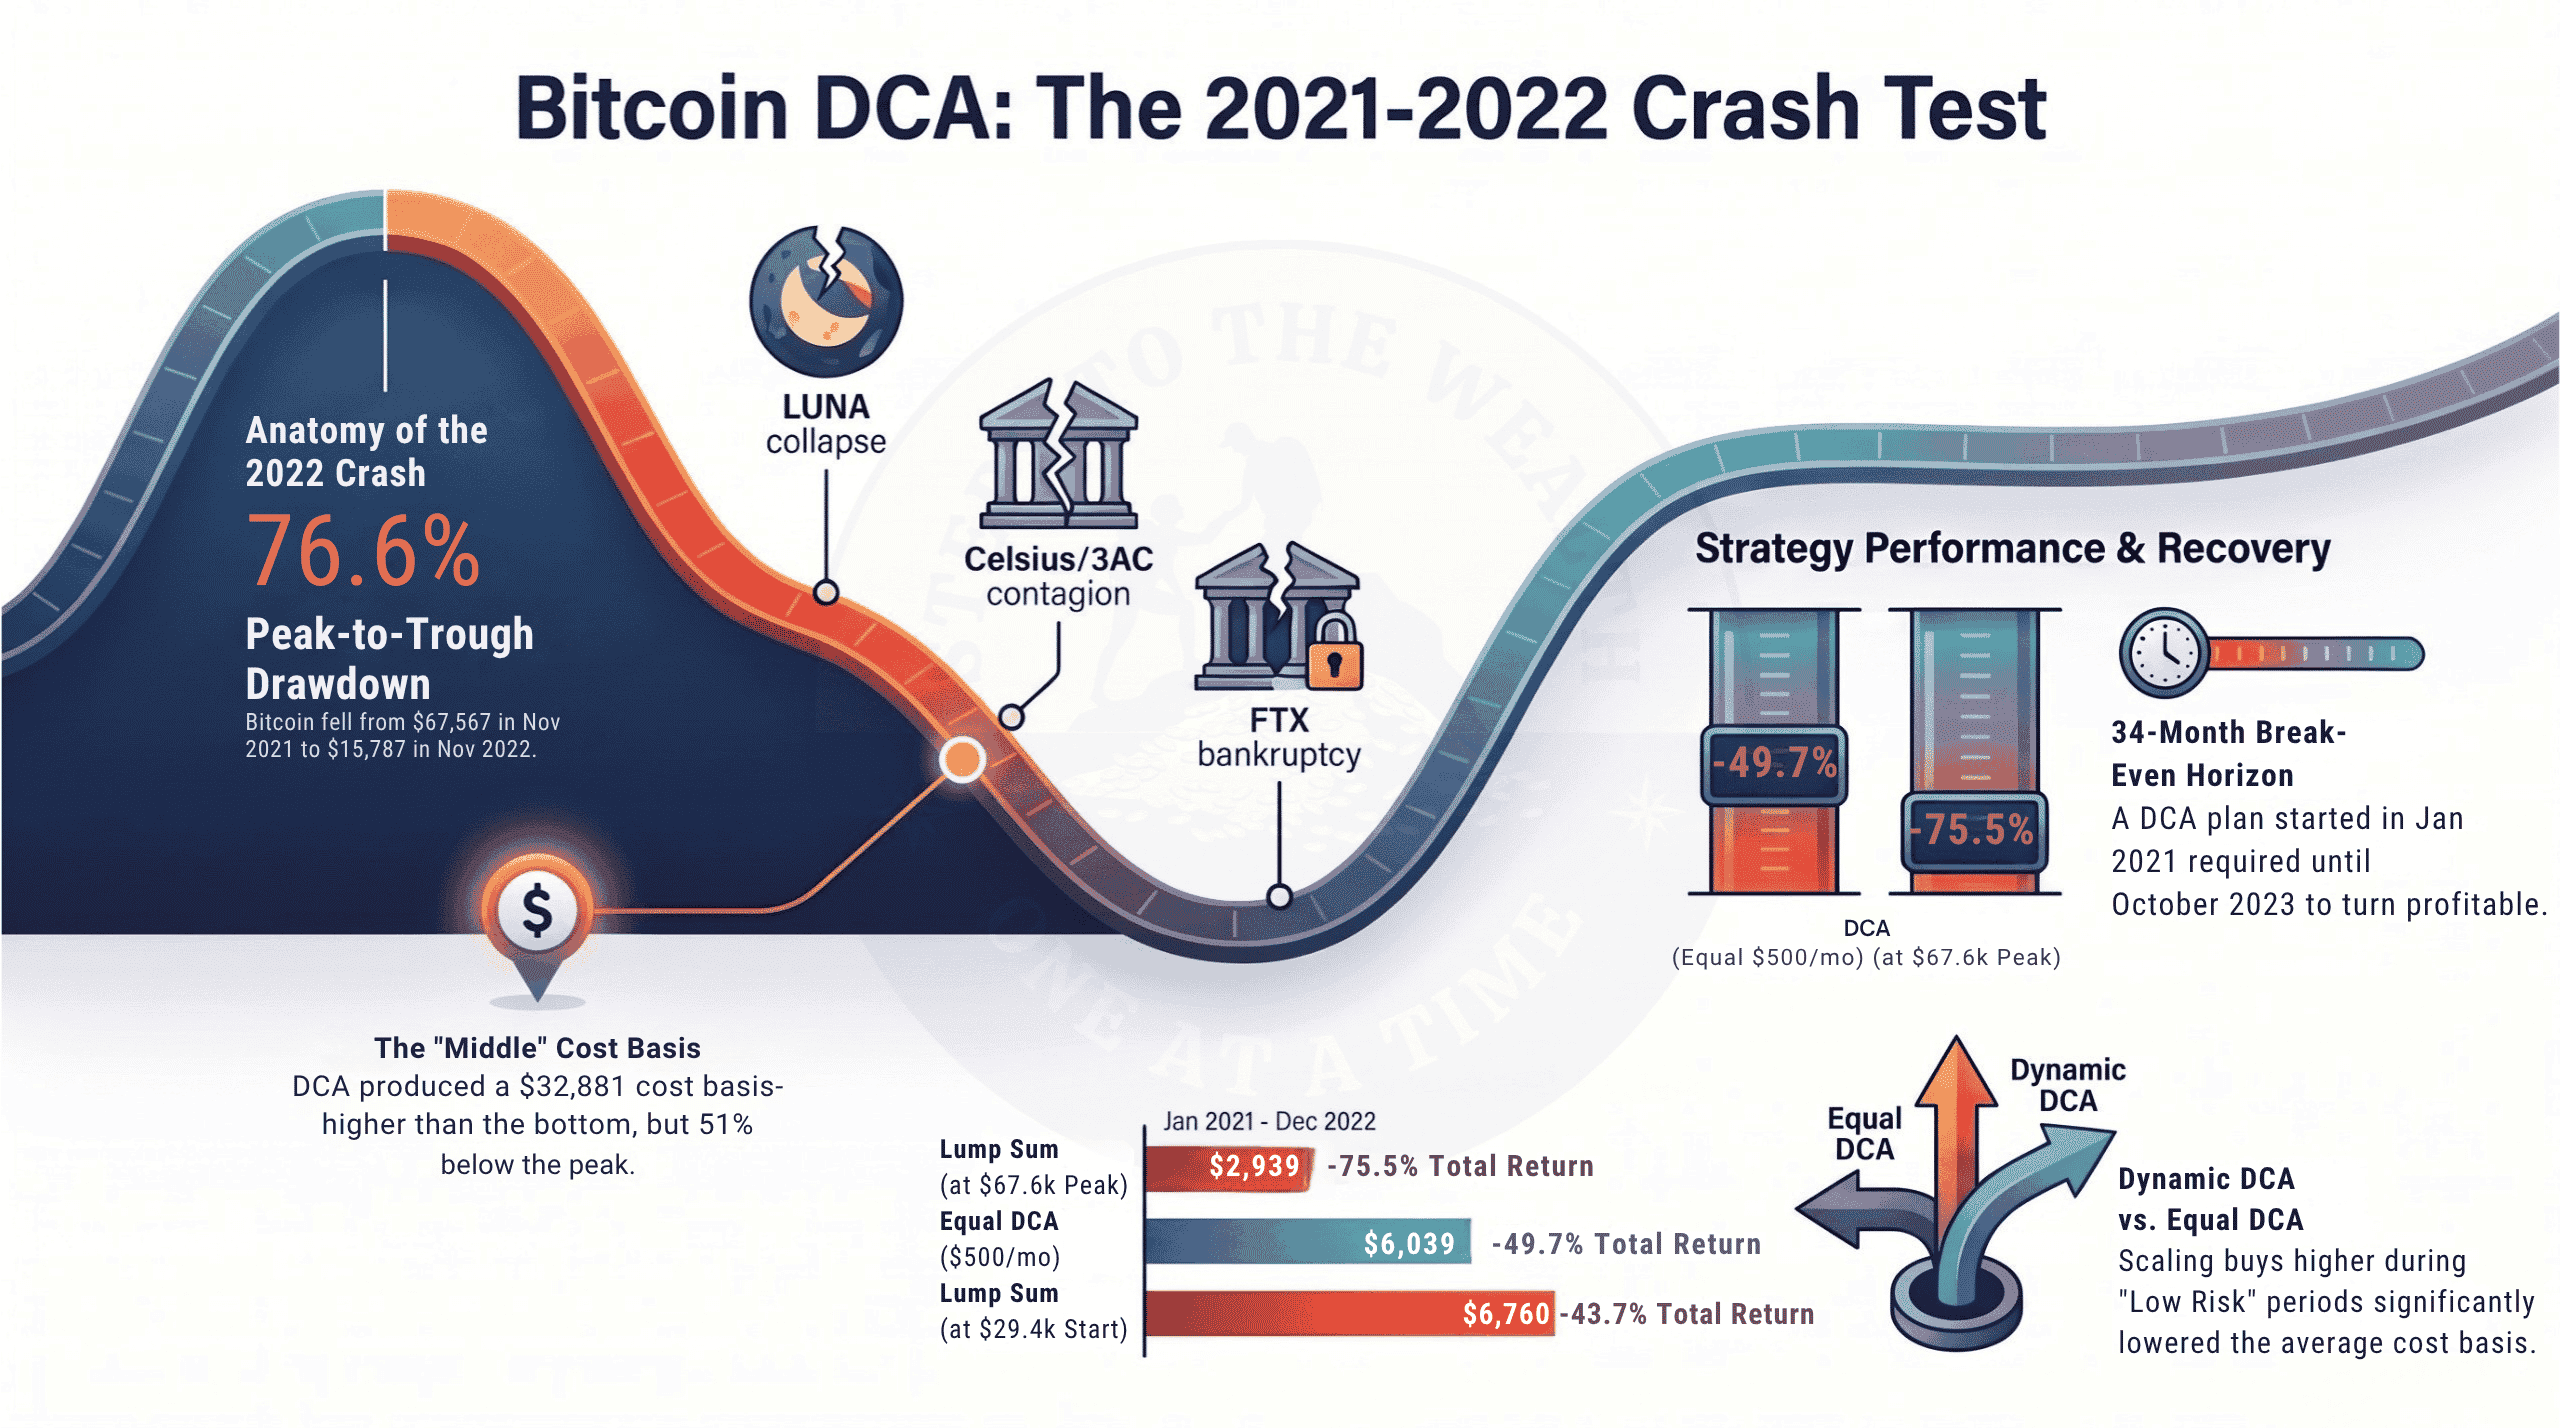
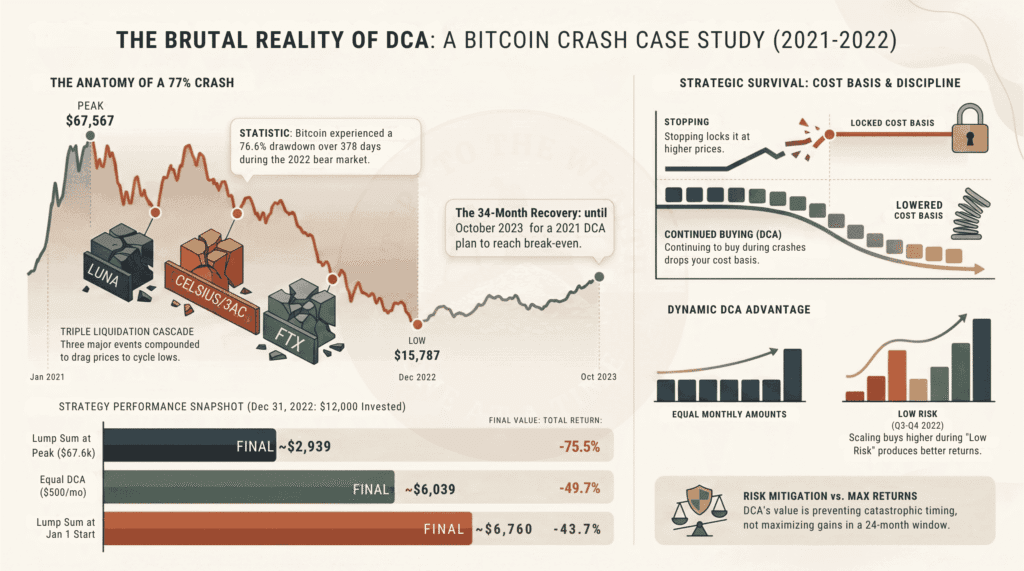
A $500-per-month DCA Bitcoin plan running from January 1, 2021 through December 31, 2022 — $12,000 invested in total — would have accumulated 0.3649 BTC. At the December 31, 2022 close of $16,547, that position was worth $6,039. A paper loss of 49.7%. DCA did not save you inside that specific 24-month window.
This is the number nobody on Twitter wants to lead with. It’s also the honest starting point.
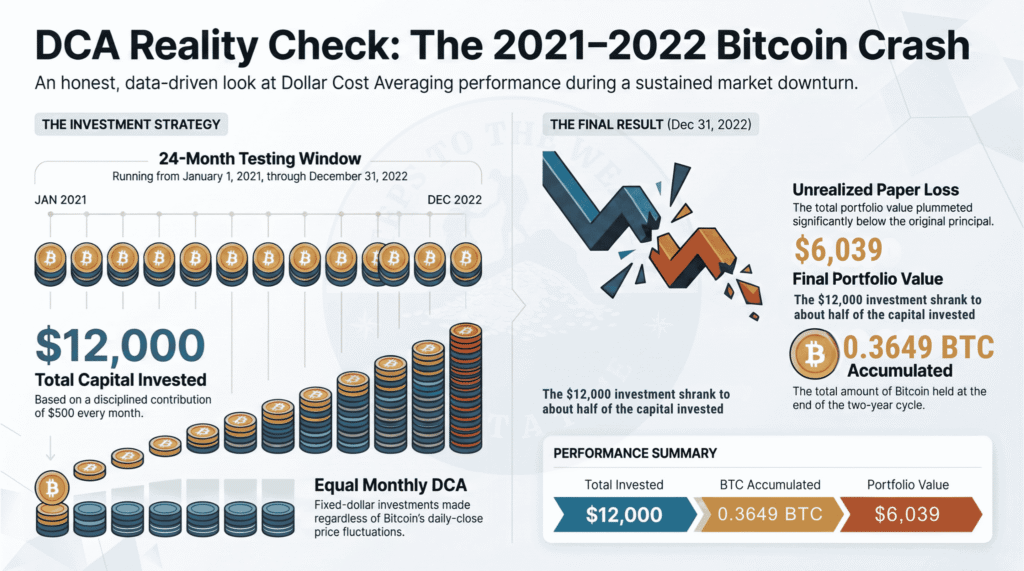
The full picture changes materially depending on when you extended the plan, whether you used equal or dynamic sizing, and how you defined “the crash” — but the baseline fact is that starting a DCA Bitcoin plan near a cycle top and measuring only through the bottom produces a deep unrealized loss, every time.
How deep was the 2022 Bitcoin crash?
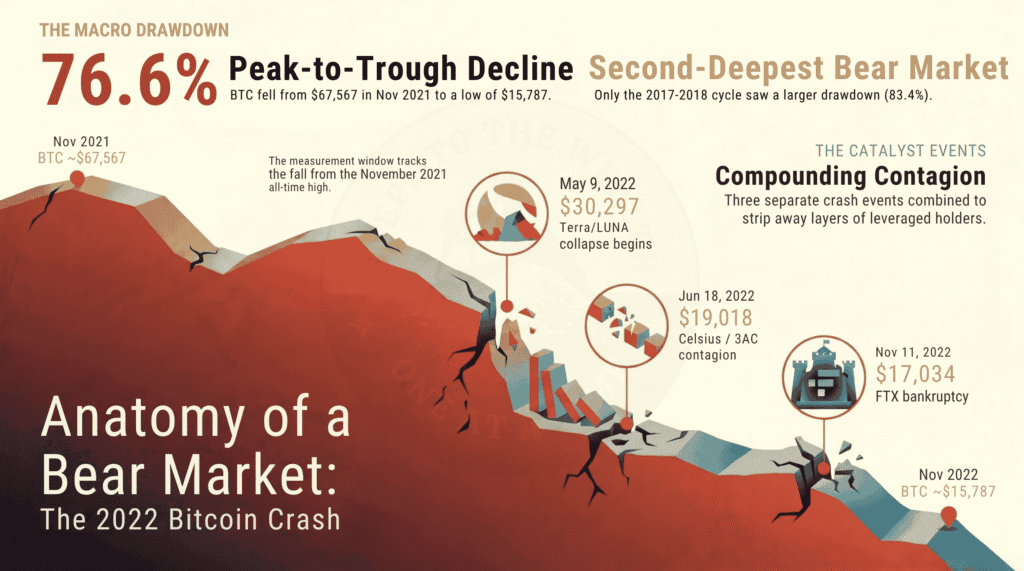
Bitcoin peaked at a daily close of $67,567 on November 8, 2021 and bottomed at $15,787 on November 21, 2022 — a drawdown of 76.6% over 378 days. It was the second-deepest BTC bear market on record, behind only the 2017–2018 cycle, which drew down 83.4% close-to-close.
Key dates inside the window:
| Date | BTC Close | Event |
|---|---|---|
| Jan 1, 2021 | $29,374 | Start of accumulation window |
| Apr 13, 2021 | $63,503 | First cycle high |
| Jul 20, 2021 | $29,807 | Mid-cycle low (-53% from April) |
| Nov 8, 2021 | $67,567 | All-time high close (at the time) |
| May 9, 2022 | $30,297 | Terra/LUNA collapse begins |
| Jun 18, 2022 | $19,018 | Celsius / 3AC contagion |
| Nov 11, 2022 | $17,034 | FTX bankruptcy |
| Nov 21, 2022 | $15,787 | Cycle bottom |
| Dec 31, 2022 | $16,547 | End of measurement window |
Three discrete crash events compounded into a single bear market: the Terra/LUNA collapse in May 2022, the Celsius and 3AC contagion that followed in June, and the FTX bankruptcy filing on November 11, 2022. Each one took out a layer of leveraged holders and dragged spot price lower. Anyone running a DCA Bitcoin plan through that year bought into all three.
Did DCA Bitcoin beat lump sum during the 2021–2022 cycle?
DCA Bitcoin beat lump sum if the lump sum was deployed near the cycle peak, and lost to lump sum if the lump sum was deployed at the cycle trough. Timing of the starting point dominates the comparison — not the strategy choice.
Three lump-sum scenarios for a $12,000 deposit during this window:
- Lump sum on January 1, 2021 at $29,374 → 0.4085 BTC → $6,760 on December 31, 2022 (-43.7%)
- Lump sum on November 8, 2021 at $67,567 (the peak) → 0.1776 BTC → $2,939 on December 31, 2022 (-75.5%)
- Lump sum on November 21, 2022 at $15,787 (the bottom) → 0.7601 BTC → $12,578 on December 31, 2022 (+4.8%)
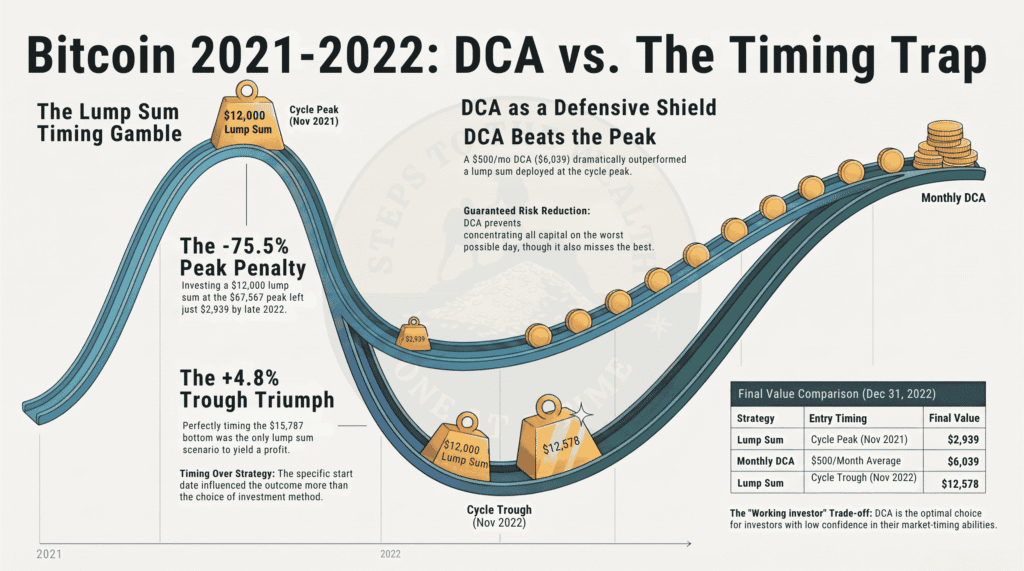
The $500/mo DCA Bitcoin plan landed at $6,039 — worse than the January 1 lump sum, dramatically better than the peak lump sum, dramatically worse than bottom-timing.
The value here was never “maximum returns.” It was risk reduction on the entry timing decision. It guaranteed you didn’t concentrate all your capital on the worst possible day. It also guaranteed you didn’t concentrate it on the best day.
Whether that trade-off is worth it depends on how confident you are in your own timing — which, for most working investors, is “not very.”
Does DCA Bitcoin actually work during bear markets?
DCA Bitcoin works in a bear market if “works” means “accumulates a lower average cost basis than a single entry near the top.” It does not work if “works” means “guarantees profit inside any 24-month window.” The method is designed to reduce timing risk across a cycle, not to eliminate drawdown inside one.
The $500/mo example above has a cost basis of $32,881/BTC — meaningfully lower than the $67,567 peak, meaningfully higher than the $15,787 bottom. A cost basis in the middle of a crashing range is exactly what DCA is supposed to produce.
The “does it work” question only resolves when you extend the window. If the same DCA Bitcoin plan had continued through 2023 and 2024, the cost basis would have kept dropping through the low part of the cycle, and the subsequent price recovery would have produced positive returns. How long that takes is the next question.
How does equal DCA compare to dynamic DCA through a Bitcoin crash?
Dynamic DCA — sometimes called risk-weighted DCA — scales buy size based on market risk level rather than buying a fixed amount every month. In the 2021–2022 window, a dynamic approach that paused or reduced buys while risk was high and scaled up buys as risk dropped to Low would have produced a meaningfully lower cost basis than a flat DCA Bitcoin plan using the same total capital.
The mechanics, simplified:
- Equal DCA: $500/mo every month, regardless of price. Simple. Emotion-free. Buys at every price equally.
- Dynamic DCA: Variable sizing based on a pre-committed risk framework. Small buys (or no buys) when market risk reads High. Standard buys at Medium. Size-up buys (e.g., 2x or 3x normal) when risk reads Low.
Across the 2021–2022 window, market risk readings (valuation, sentiment, and breadth) registered High through most of 2021 and dropped to Low during the June–November 2022 liquidation cluster. A dynamic DCA Bitcoin plan that deployed heavier capital in Q3–Q4 2022 would have accumulated more BTC per dollar than flat monthly buys. This is the mechanic the Dynamic DCA framework is built around.
The trade-off: dynamic sizing requires a risk framework you trust and the discipline to scale up buys during the scariest weeks — exactly when most investors freeze or sell. Most investors underestimate how hard that is until they live through it.
How long did a DCA Bitcoin plan from 2021 take to break even?
A $500-per-month DCA Bitcoin plan starting January 1, 2021 reached break-even on October 23, 2023, when Bitcoin closed at $33,086 and reclaimed the plan’s $32,881 average cost basis. Total elapsed time from start of accumulation to break-even: approximately 34 months. Investors who paused buying during the crash — and therefore stopped lowering their cost basis — took longer to recover, often well into 2024.
This is the answer the honest version of “DCA always works” has to include: it works on a multi-year horizon, not a 12–24 month horizon. Anyone promising faster is selling something.
Equities run on the same clock. A DCA plan through the 2008 financial crisis was profitable by late 2009, but the index itself did not reclaim its 2007 peak until March 2013 — the position recovered years before the market did, for exactly the same cost-basis reason.
The math also reveals why continuing to DCA Bitcoin through the bear market matters so much. Every buy below $25,000 in 2022 pulled the average cost basis down meaningfully. Investors who stopped buying when price fell preserved capital in the short term but locked in a higher cost basis — and therefore needed a higher recovery price to break even.
Should you keep DCA’ing Bitcoin during a crash?
Whether you should keep running a DCA Bitcoin plan during a crash depends on four things: your time horizon, your overall financial stability, whether your thesis on Bitcoin has changed, and whether you have a pre-committed plan. If all four are intact, continuing to buy during drawdowns is the entire point of the method. If any one of them has shifted materially, revisit the plan before the next buy.
A practical checklist, ordered by priority:
- Time horizon. If you genuinely don’t need this capital for 5+ years, short-term drawdowns are noise. If you might need it in 12 months, a volatile asset wasn’t the right vehicle in the first place.
- Financial stability. Emergency fund intact? Job stable? No high-interest debt growing? If yes, continue. If no, pause buys and address the upstream problem first.
- Thesis integrity. Has anything fundamental changed about why you were buying Bitcoin? Regulatory, technical, adoption-related? “Price went down” is not a thesis change.
- Pre-committed plan. Did you decide the rules for this scenario before the crash, or are you improvising now? Improvisation during drawdowns is where most self-directed investors bleed.
If all four check out, keep buying. The dollar buys that feel the worst emotionally — the ones in the middle of an FTX-style crash — are the ones that pull cost basis down the fastest.
The clock is not always this long, either. The entire peak-to-bottom move of the 2020 COVID crash took 33 calendar days, which left only three or four scheduled buys inside it — the opposite execution problem, and an argument for automating the buy rather than deciding it each month.
DCA Bitcoin through 2021–2022: the honest summary
Five things this window actually establishes, stated without spin:
- A DCA Bitcoin plan started at a cycle top and measured at a cycle bottom loses money. $12,000 in, $6,039 out, down 49.7%. No strategy label changes that arithmetic.
- Entry timing dominated method choice. The spread between the best and worst lump-sum entry was $2,939 to $12,578 on identical capital. That gap is far wider than the gap between DCA and lump sum.
- The cost basis landed in the middle, which is the design working, not failing. $32,881 against a $67,567 peak and a $15,787 trough.
- Break-even took about 34 months. Not 12. Not 24. Any DCA Bitcoin claim that skips the horizon is incomplete.
- Stopping was the expensive decision. Pausing buys through the worst months preserved short-term capital and locked in a higher cost basis, which pushed break-even further out.
None of that is a recommendation. It is what the arithmetic did over one specific 24-month window, and the honest way to use it is as a stress test for your own plan rather than as a forecast. If you want the risk-first framing behind it, that is what the newsletter covers, and there is more on the approach on the about page.
Run this DCA Bitcoin scenario with your own numbers
The specific dollar amounts above use a $500/mo baseline for readability. Your plan is probably different — different starting month, different amount, different end date, different sizing rule.
DCA Simulator Pro lets you run this exact scenario with your own inputs, compare equal versus dynamic sizing head-to-head, and replay any of the three sub-crashes (LUNA, Celsius/3AC, FTX) in isolation. It also covers 2008 equities, the COVID crash, and the dot-com bust if you want to test your plan on non-crypto drawdowns.
FAQ
What was the lowest Bitcoin price during the 2022 crash?
Bitcoin’s cycle low during the 2022 crash was a daily close of $15,787 on November 21, 2022, reached in the aftermath of the FTX bankruptcy. The intraday low that same day printed lower, at $15,599; the $15,787 figure refers to the daily close.
Did anyone make money on a DCA Bitcoin plan through 2022?
Investors who started to DCA Bitcoin before 2020 and kept buying through the 2022 crash were generally still profitable by the end of 2022, because their cost basis was set against 2018–2020 prices. Investors who started in 2021 were at a paper loss through all of 2022 and into 2023.
Is DCA better than lump sum for Bitcoin?
DCA reduces the variance of outcomes versus lump sum — better worst-case, worse best-case. Historical studies on equities (Vanguard, 2012) show lump sum beats DCA approximately two-thirds of the time on expected value. For Bitcoin specifically, the wider volatility makes the risk-reduction value higher and the expected-value gap smaller, but lump sum still wins on average if deployed outside of cycle peaks.
How much Bitcoin would $100/month have bought from Jan 2021 to Dec 2022?
0.0730 BTC on $2,400 invested, at the same $32,881 average cost basis as the $500/mo example. Value on December 31, 2022 at the $16,547 close: $1,208.
What’s “dynamic DCA”?
Dynamic DCA scales the size of each buy based on a pre-committed market risk framework. Low risk triggers larger buys; high risk triggers smaller buys or pauses. The goal is to concentrate capital deployment in periods when risk-adjusted expected returns are historically higher — without requiring the investor to predict tops or bottoms.
Educational content only — not financial advice. Nothing in this article is a recommendation to buy, sell, or hold any asset. Past performance is not indicative of future results. Do your own research.