
Most DCA advice is written by people who have never sat through a 57% drawdown. This article does the opposite. It runs a real dollar-cost average into the S&P 500 through the worst equity bear market since 1929 — the 2008 financial crisis — and shows exactly what the outcome looked like. Real monthly close data. No smoothing. No hindsight.
If the 2022 Bitcoin crash felt bad, the 2008 financial crisis was worse by most measures. The recession that framed it is dated by the NBER from December 2007 to June 2009. Here is the test case.
Educational content only — not financial advice. Past performance is not indicative of future results.
What this 2008 financial crisis case study covers
- What a DCA plan through the 2008 financial crisis actually returned
- How deep the crash went
- DCA versus lump sum
- Whether DCA works during a recession
- Equal DCA versus dynamic DCA
- How long recovery took
- Whether to keep investing through a crash
- The honest summary
What would DCA into the S&P 500 during the 2008 financial crisis have returned?
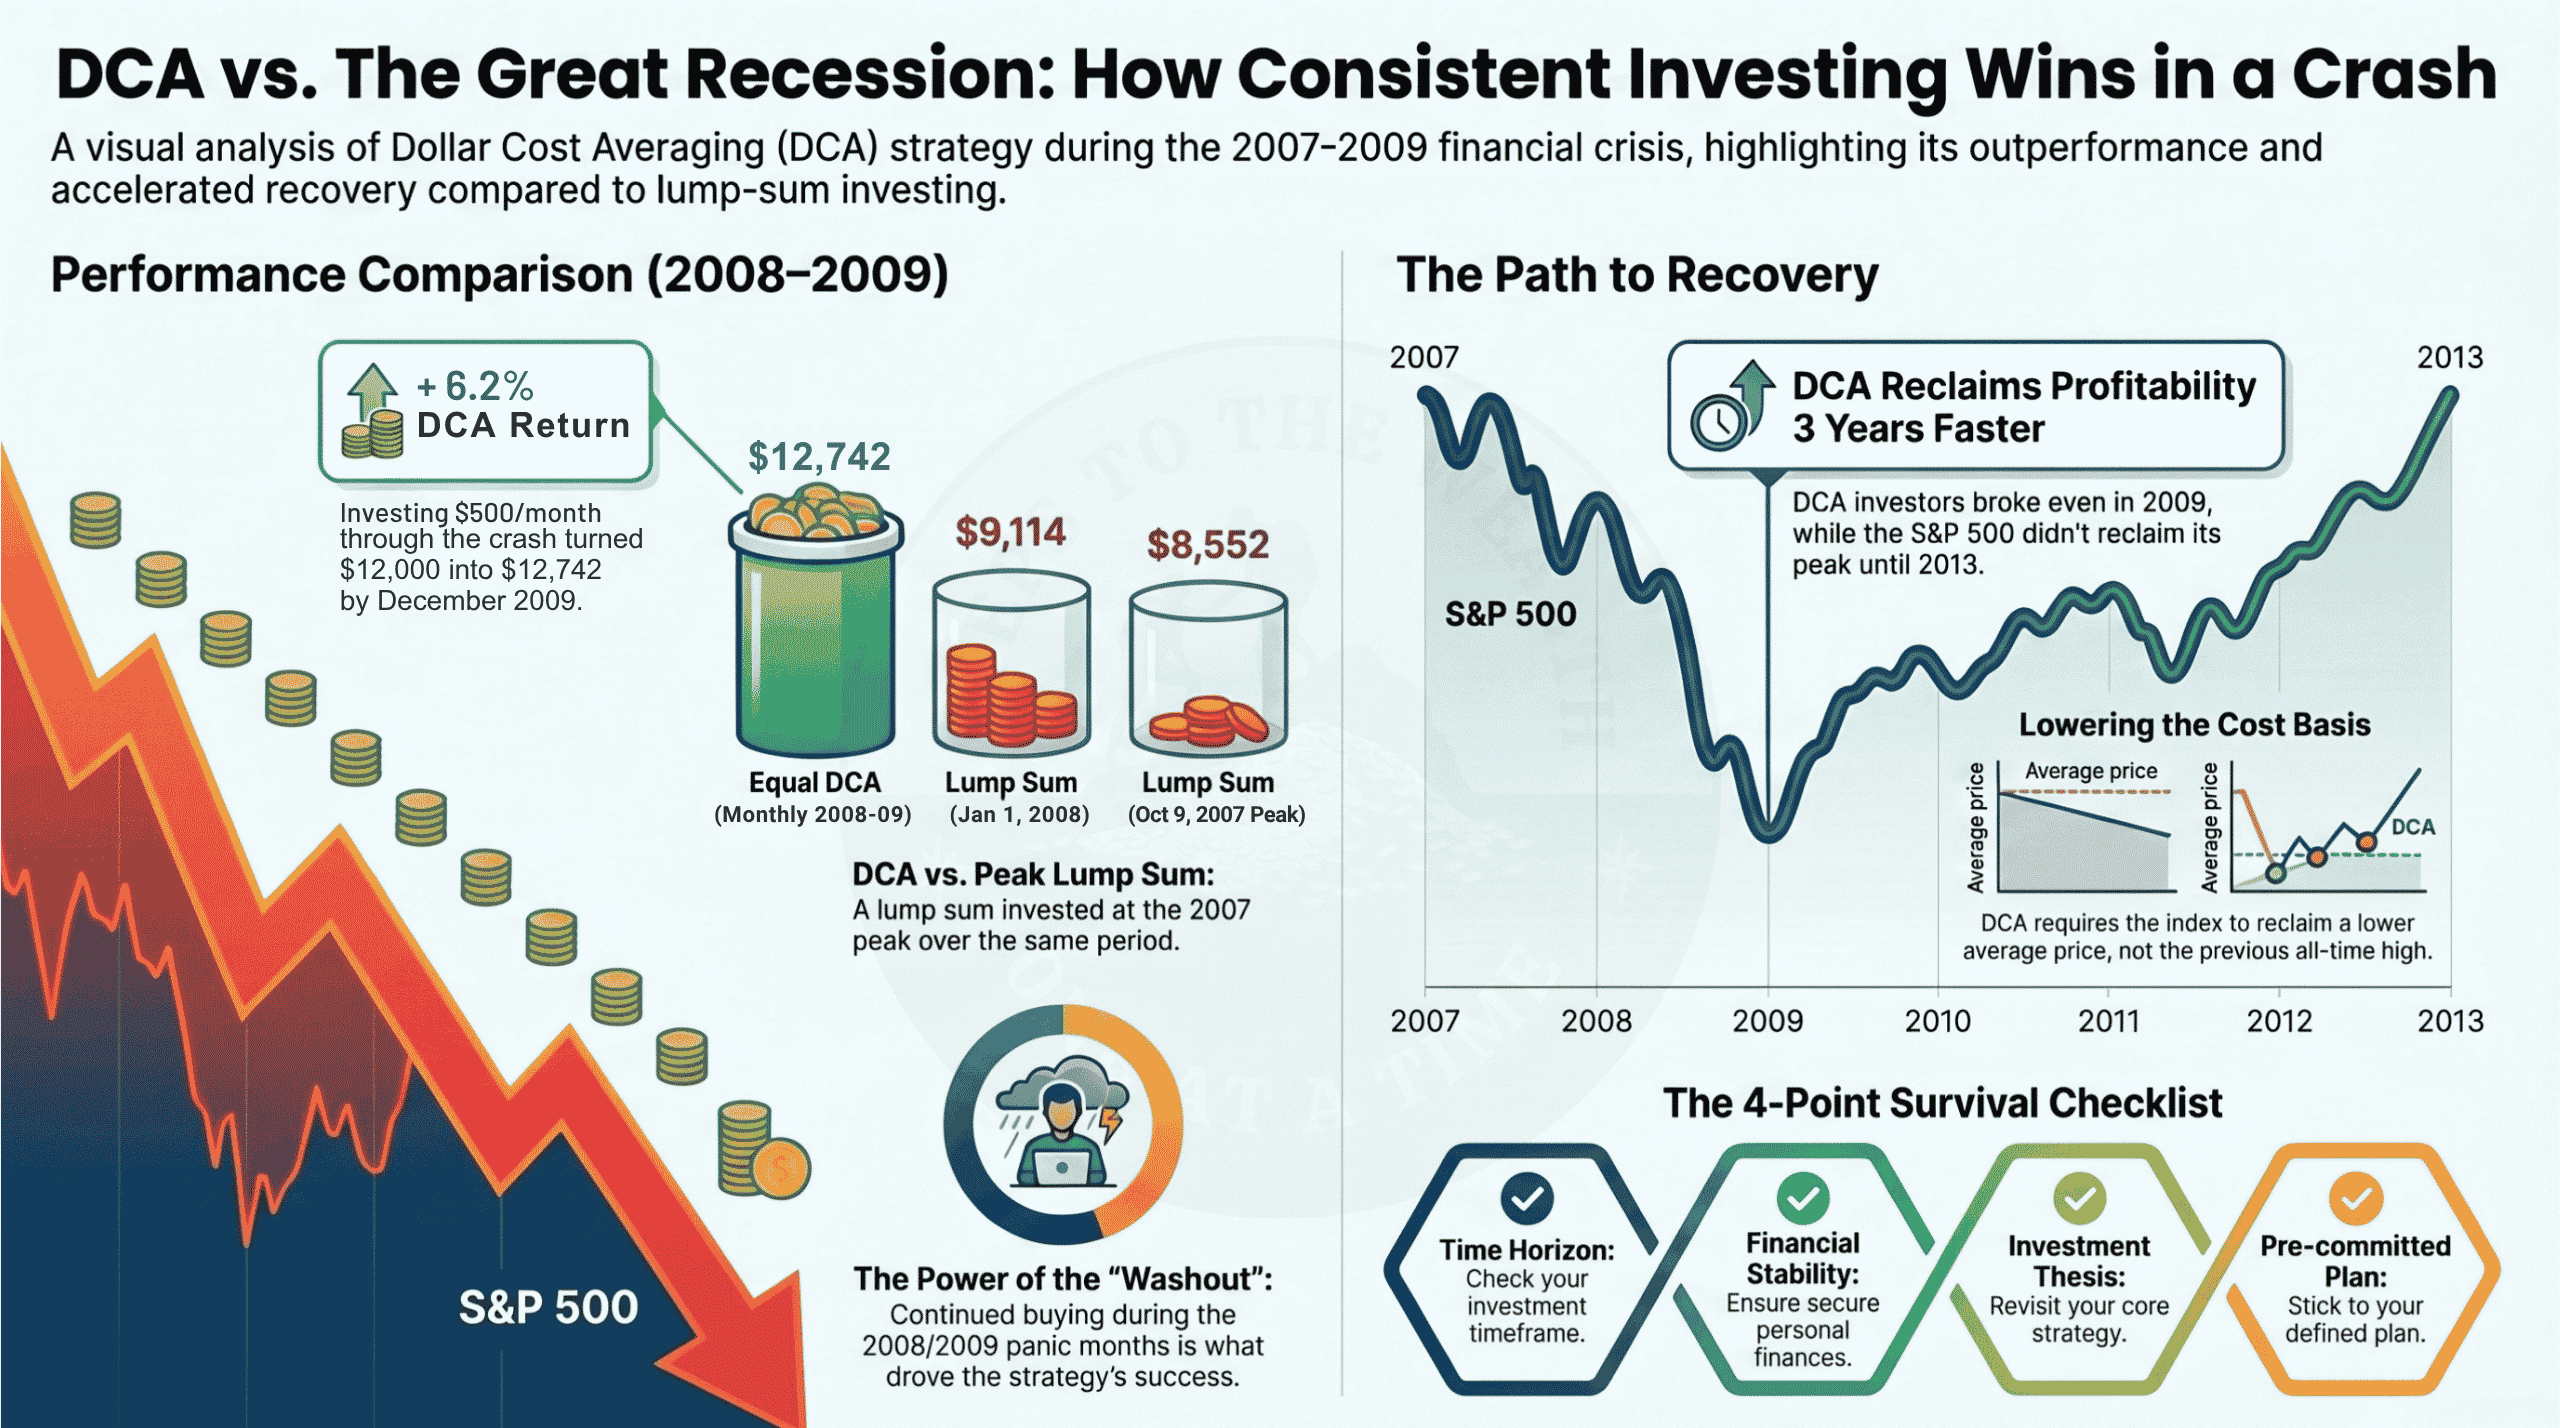
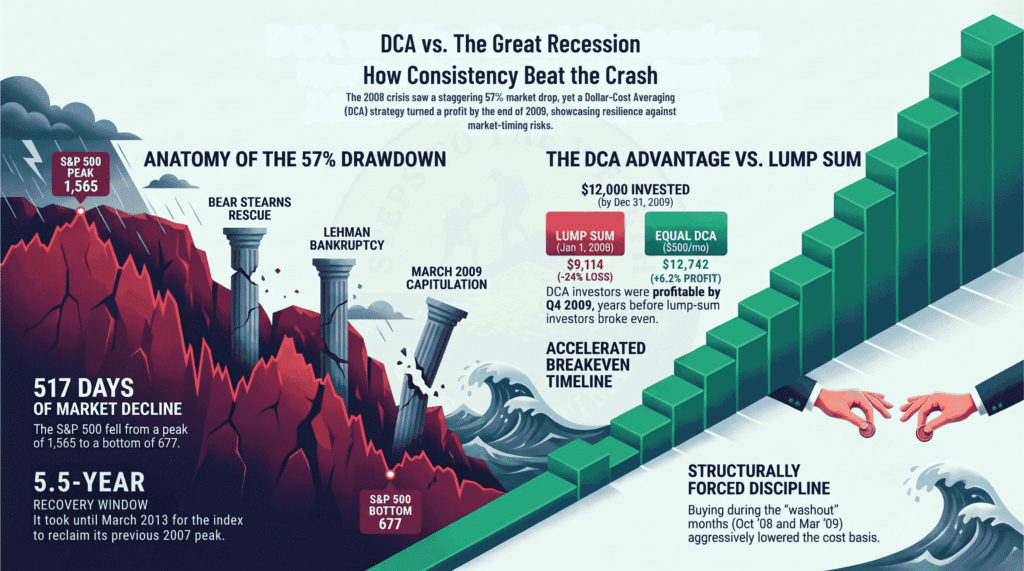
A $500-per-month equal DCA into the S&P 500 from January 1, 2008 through December 31, 2009 — $12,000 invested in total — would have ended 2009 worth approximately $12,742. A gain of roughly 6.2% despite the index finishing the period below where it started, because every buy below the January 2008 price lowered the average cost basis meaningfully.
This is the DCA result most people assume happens automatically. It doesn’t. It happened here because the investor kept buying through the panic — especially through the October 2008 and March 2009 washout months, when the headlines said to stop.
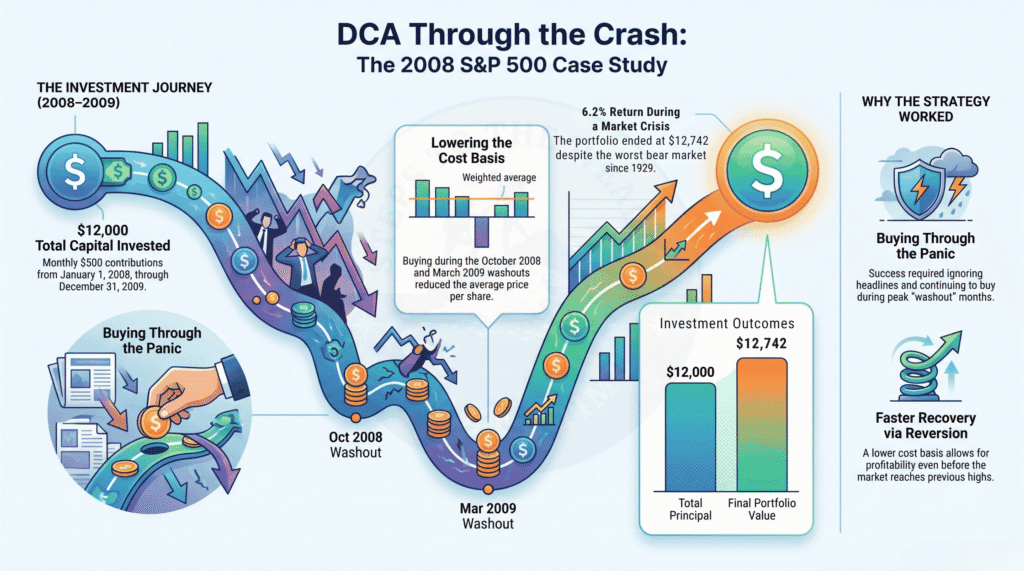
The specific numbers depend on your monthly contribution amount and exact buy dates, but the mechanic is identical through any drawdown, not just the 2008 financial crisis: buying into a falling market produces a lower cost basis, and a lower cost basis produces a faster recovery when price reverts.
How deep was the 2008 stock market crash?
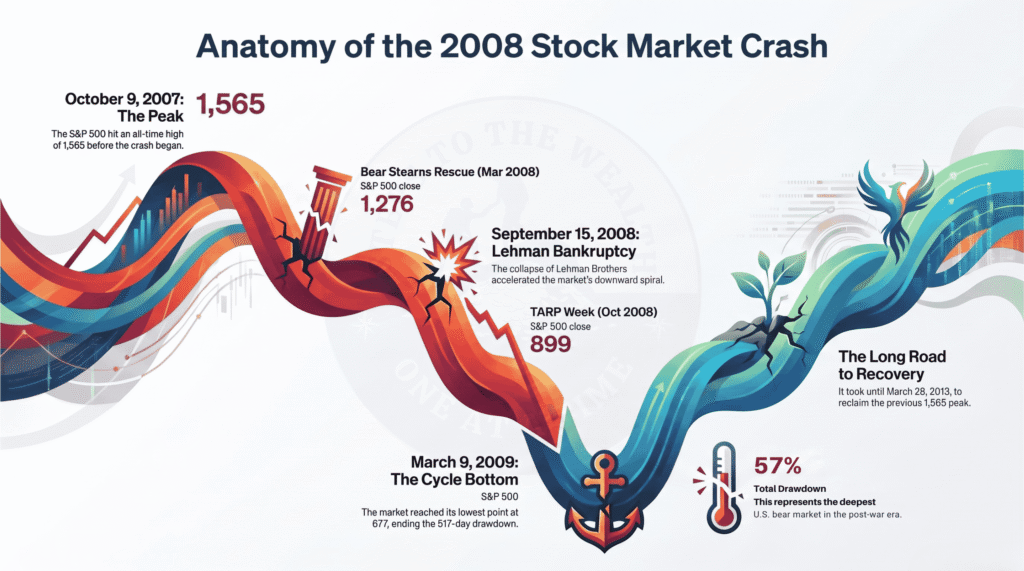
The S&P 500 peaked at approximately 1,565 on October 9, 2007 and bottomed at approximately 677 on March 9, 2009 — a drawdown of roughly 57% over 517 days. It was the deepest U.S. equity bear market of the post-war era. Only the 1929–1932 Great Depression crash went deeper, and that predates the post-war period entirely.
Key dates inside the window:
| Date | S&P 500 Close (approx.) | Event |
|---|---|---|
| Oct 9, 2007 | 1,565 | All-time high (at the time) |
| Jan 1, 2008 | 1,468 | Start of accumulation window |
| Mar 16, 2008 | 1,276 | Bear Stearns rescue |
| Sep 15, 2008 | 1,193 | Lehman Brothers bankruptcy |
| Oct 10, 2008 | 899 | TARP week — intraday lows near 840 |
| Nov 20, 2008 | 752 | Interim low |
| Mar 9, 2009 | 677 | Cycle bottom |
| Dec 31, 2009 | 1,115 | End of measurement window |
| Mar 28, 2013 | 1,569 | Previous peak reclaimed |
Three discrete events compounded into the single bear market of the 2008 financial crisis: the Bear Stearns rescue in March 2008, the Lehman Brothers bankruptcy on September 15, 2008, and the March 2009 capitulation. Each one forced another round of margin liquidation and another leg lower.
Did DCA beat lump sum during the 2008 financial crisis?
DCA beat lump sum if the lump sum was deployed near the 2007 peak, and lost to lump sum if the lump sum was deployed at the March 2009 trough. As with every timing comparison, the start date dominates the strategy choice.
Three lump-sum scenarios for a $12,000 deposit during the 2008 financial crisis window:
- Lump sum on January 1, 2008 at 1,468 → approximately 8.17 index units → $9,114 on December 31, 2009 (-24%)
- Lump sum on October 9, 2007 at 1,565 (the peak) → approximately 7.67 units → $8,552 on December 31, 2009 (-29%)
- Lump sum on March 9, 2009 at 677 (the bottom) → approximately 17.73 units → $19,768 on December 31, 2009 (+65%)
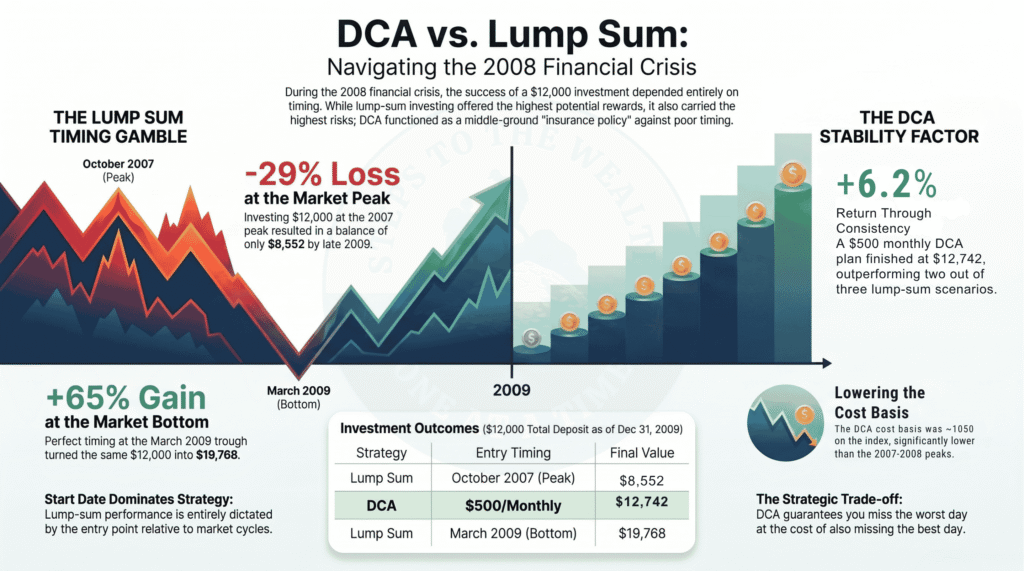
The $500/mo equal DCA finished at approximately $12,742 (+6.2%) — dramatically better than the peak lump sum, better than the January 2008 lump sum, dramatically worse than bottom-timing. The cost basis for the DCA investor was approximately 1,050 on the index, versus 1,468 for the January 2008 lump sum and 677 for the perfectly timed bottom buyer.
The honest read: DCA did what it’s supposed to do. It guaranteed you didn’t put all your capital to work on the worst possible day, at the cost of also guaranteeing you didn’t put it all to work on the best possible day. For a working investor with no ability to identify a cycle bottom in real time, that trade is worth making.
Does DCA work for stocks during a recession?
DCA works for U.S. equities during a recession in the specific sense that consistent buying through a drawdown produces a lower cost basis than any single entry above the eventual recovery price. It does not work in the sense of “avoids unrealized losses inside the crash window.” Drawdowns are the price of admission, not a failure of strategy.
The 2008 financial crisis is the textbook outcome. A DCA investor who started at a bad time — January 2008, near the peak — and continued buying through the crash was profitable by end of 2009, before the index itself had recovered. The investor who sold during the March 2009 panic realised those losses permanently. The investor who merely stopped buying after the Lehman collapse in September 2008 did not — that position still recovered with the index — but they forfeited the cheapest shares of the entire cycle, which is exactly what the cost-basis arithmetic depended on.
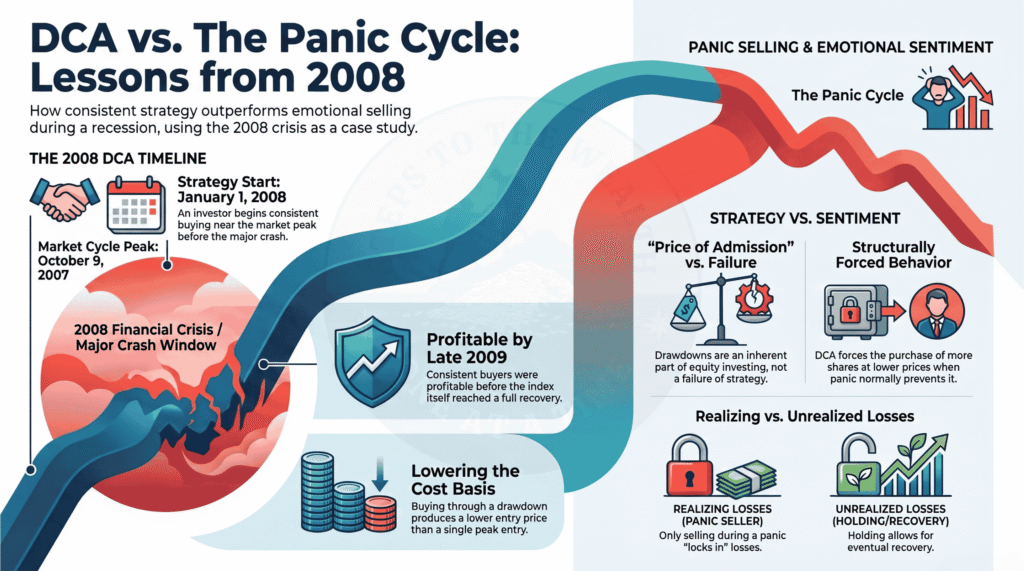
This is the pattern that repeats across every equity bear market in the last 100 years. DCA doesn’t work because the strategy is magic. It works because it structurally forces the behavior — buying more shares at lower prices — that panic normally prevents.
How does equal DCA compare to dynamic DCA through the 2008 financial crisis?
Dynamic DCA — sometimes called risk-weighted DCA — scales buy size based on a pre-committed market risk framework rather than buying a fixed amount every month. Through the 2008 financial crisis, a dynamic approach that reduced buys while valuations and sentiment registered High in 2007, then scaled up buys aggressively during the September 2008 to March 2009 capitulation, would have produced a lower cost basis than equal DCA on the same total capital.
The mechanics, simplified:
- Equal DCA: $500/mo every month, regardless of price. Simple. Emotion-free. Buys at every price equally.
- Dynamic DCA: Variable sizing based on risk reads. Small buys (or pauses) at High risk. Standard buys at Medium. Size-up buys at Low risk (2x or 3x normal).
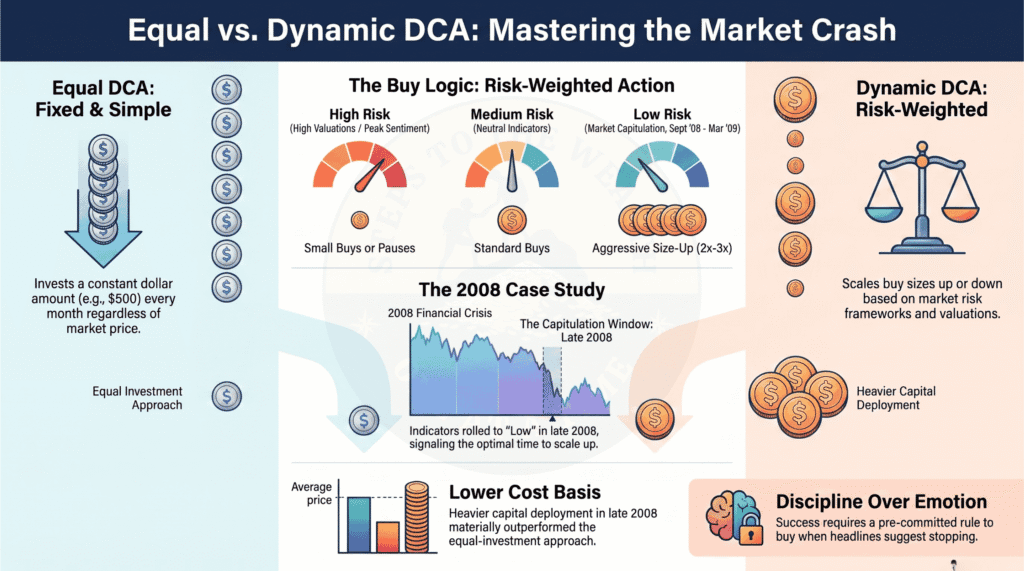
Across the 2008 financial crisis, standard risk indicators — Shiller CAPE, AAII sentiment, percentage of S&P stocks above their 200-day moving average — registered High in 2007 and rolled to Low across late 2008 and early 2009. A dynamic DCA deploying heavier capital in October 2008, November 2008, and March 2009, the months when every headline said to stop, would have materially outperformed equal DCA. That risk-weighted sizing rule is the core of the Dynamic DCA framework.
The trade-off is the same one that shows up in every crash: dynamic DCA requires a pre-committed framework and the discipline to size up buys during the scariest weeks. Most investors underestimate how hard that is. In October 2008, the world genuinely appeared to be ending. Opening your brokerage account to increase buy size took more than confidence — it took a rule you’d decided to follow before the panic started.
How long did it take the S&P 500 to recover from the 2008 financial crisis?
The S&P 500 reclaimed its October 2007 peak on March 28, 2013 — approximately 5.5 years (1,997 days) from peak to peak. An investor who had lump-summed at the peak waited the full 5.5 years to break even on price alone. A DCA investor who started January 2008 was already profitable by Q4 2009, and materially ahead by 2011, because the lower cost basis meant recovery happened at a lower price than the old peak.
This is the underappreciated compounding effect of DCA through a crash. The lump-sum investor needs the index to reclaim its prior high to break even. The DCA investor needs the index to reclaim the average cost basis — which, if the buys went through a deep drawdown, can be substantially lower.
Recovery speed is not a constant, either. The same index ran peak to reclaimed peak in 181 days during the COVID crash of 2020, against 5.5 years here — which is precisely why a plan should be stress-tested against more than one cycle shape.
With dividends reinvested, total-return break-even for the peak lump-sum investor was reached earlier, around March 2012. DCA investors crossed total-return break-even in 2009. The gap between the two — roughly three years of compounding — is the real value DCA delivered across the 2008 financial crisis cycle.
Should you keep investing during a market crash?
Whether you should keep investing during a market crash depends on four things: your time horizon, your financial stability outside the portfolio, whether your thesis on the underlying asset has changed, and whether you had a pre-committed plan for this scenario. If all four are intact, continuing to DCA is the entire mechanism that makes the strategy work. If any have shifted materially, revisit before the next buy.
A practical checklist, ordered by priority:
- Time horizon. If you don’t need this capital for 5+ years, drawdowns are usually survivable — though this cycle took 5.5 years to reclaim its peak on price alone, so five years was not a comfortable margin. If you might need it inside 12 months, equities weren’t the right vehicle in the first place — that’s a liquidity problem, not a market problem.
- Financial stability. Emergency fund intact? Job stable (or stable enough)? High-interest debt under control? If yes, keep buying. If no, pause and fix the upstream issue first.
- Thesis integrity. Has anything fundamental changed about why you were invested in U.S. equities — policy, demographics, productivity? “The price went down” is not a thesis change.
- Pre-committed plan. Did you decide the rules for this scenario before the crash, or are you deciding now? Real-time decision-making during a 30% drawdown is where self-directed investors bleed hardest.
The buys that feel worst — October 2008, March 2009 — are the ones that do the most work on your cost basis. The whole point of writing the plan before the crash is to execute those buys despite the headlines, not because of them.
DCA and the 2008 financial crisis: the honest summary
Five things this window actually establishes, stated without spin:
- A DCA plan begun near the peak still finished profitable. $12,000 in, roughly $12,742 out, up about 6.2% by December 2009 — while the index was still well below its starting level.
- Entry timing dominated method choice. The spread across lump-sum entries was $8,552 to $19,768 on identical capital. That gap is far wider than the gap between DCA and lump sum.
- The cost basis is the whole mechanism. Roughly 1,050 on the index, against a 1,565 peak and a 677 trough. Break-even required reclaiming 1,050, not 1,565.
- Price recovery took 5.5 years; the DCA investor did not wait that long. The index reclaimed its high in March 2013. The DCA investor was profitable in 2009.
- Stopping was the expensive decision. Pausing after Lehman, or selling in March 2009, removed exactly the buys that were doing the most work.
None of that is a recommendation, and the outcome of the 2008 financial crisis is not a promise about the next drawdown — a different recovery path produces a different answer on the same rules. Use it as a stress test for your own plan rather than as a forecast. If you want the risk-first framing behind it, that is what the newsletter covers, and there is more on the approach on the about page.
Run this 2008 financial crisis scenario with your own numbers
The $500/mo baseline above is for readability. Your plan is probably different — different starting month, different contribution amount, different end date, different sizing rule.
DCA Simulator Pro lets you run this exact scenario with your own inputs, compare equal versus dynamic DCA side-by-side, and replay any of the three sub-crashes inside the 2008 financial crisis (Bear Stearns, Lehman, the March 2009 capitulation) in isolation. It also covers the 2022 Bitcoin crash, the COVID drop, and the dot-com bust if you want to test the same plan on different cycles.
FAQ
What was the lowest S&P 500 price during the 2008 financial crisis?
The S&P 500’s cycle low was approximately 677 on March 9, 2009, reached during the capitulation phase of the 2008 financial crisis. Intraday lows on that day printed near 666. The 677 figure refers to daily close.
How much did the S&P 500 fall in 2008?
The S&P 500 fell 38.5% in calendar year 2008, measured from January 1 open to December 31 close. The peak-to-trough drawdown, measured from the October 2007 high to the March 2009 low, was approximately 57%, spanning parts of both 2008 and 2009.
Is DCA better than lump sum for the S&P 500?
Historical research (Vanguard, 2012) shows that lump sum beats DCA approximately two-thirds of the time when measured across all rolling historical windows. DCA reduces the variance of outcomes — better worst-case, worse best-case. For investors near market peaks or with low conviction in their timing, DCA’s risk-reduction value outweighs the expected-value cost. For investors with a long horizon and no ability to call peaks, lump sum wins on average.
How much would $100 per month have been worth after DCA through the 2008 financial crisis?
Approximately $2,548 on $2,400 invested, using the same cost-basis logic as the $500 per month example. A gain of roughly 6.2% by December 31, 2009.
What’s the difference between a recession and a bear market?
A bear market is a financial condition: a decline of 20% or more from a recent peak in an equity index. A recession is an economic condition, typically defined as two consecutive quarters of negative real GDP growth, or declared by the NBER based on broader indicators. They often overlap but do not have to. The 2008 bear market and the Great Recession coincided; the 2022 bear market largely did not.
Educational content only — not financial advice. Nothing in this article is a recommendation to buy, sell, or hold any asset. Past performance is not indicative of future results. Do your own research.