
Every few years, someone reopens the value averaging vs DCA argument, runs one backtest where value averaging beats dollar-cost averaging, and declares it the smarter strategy.
The backtest is usually real. The conclusion is usually oversold.
Value averaging is a genuinely interesting idea, and in the right conditions it does outperform fixed DCA. But it comes with mechanics most articles quietly skip over — mechanics that decide whether a busy professional can actually run it for ten years, or whether it quietly falls apart the first time the market does something violent.
This article explains what value averaging actually is, where it beats fixed DCA and where it does not, the catch nobody mentions, and how it stacks up against a risk-first dynamic approach.
Educational content only. Not financial advice.
What dollar-cost averaging does
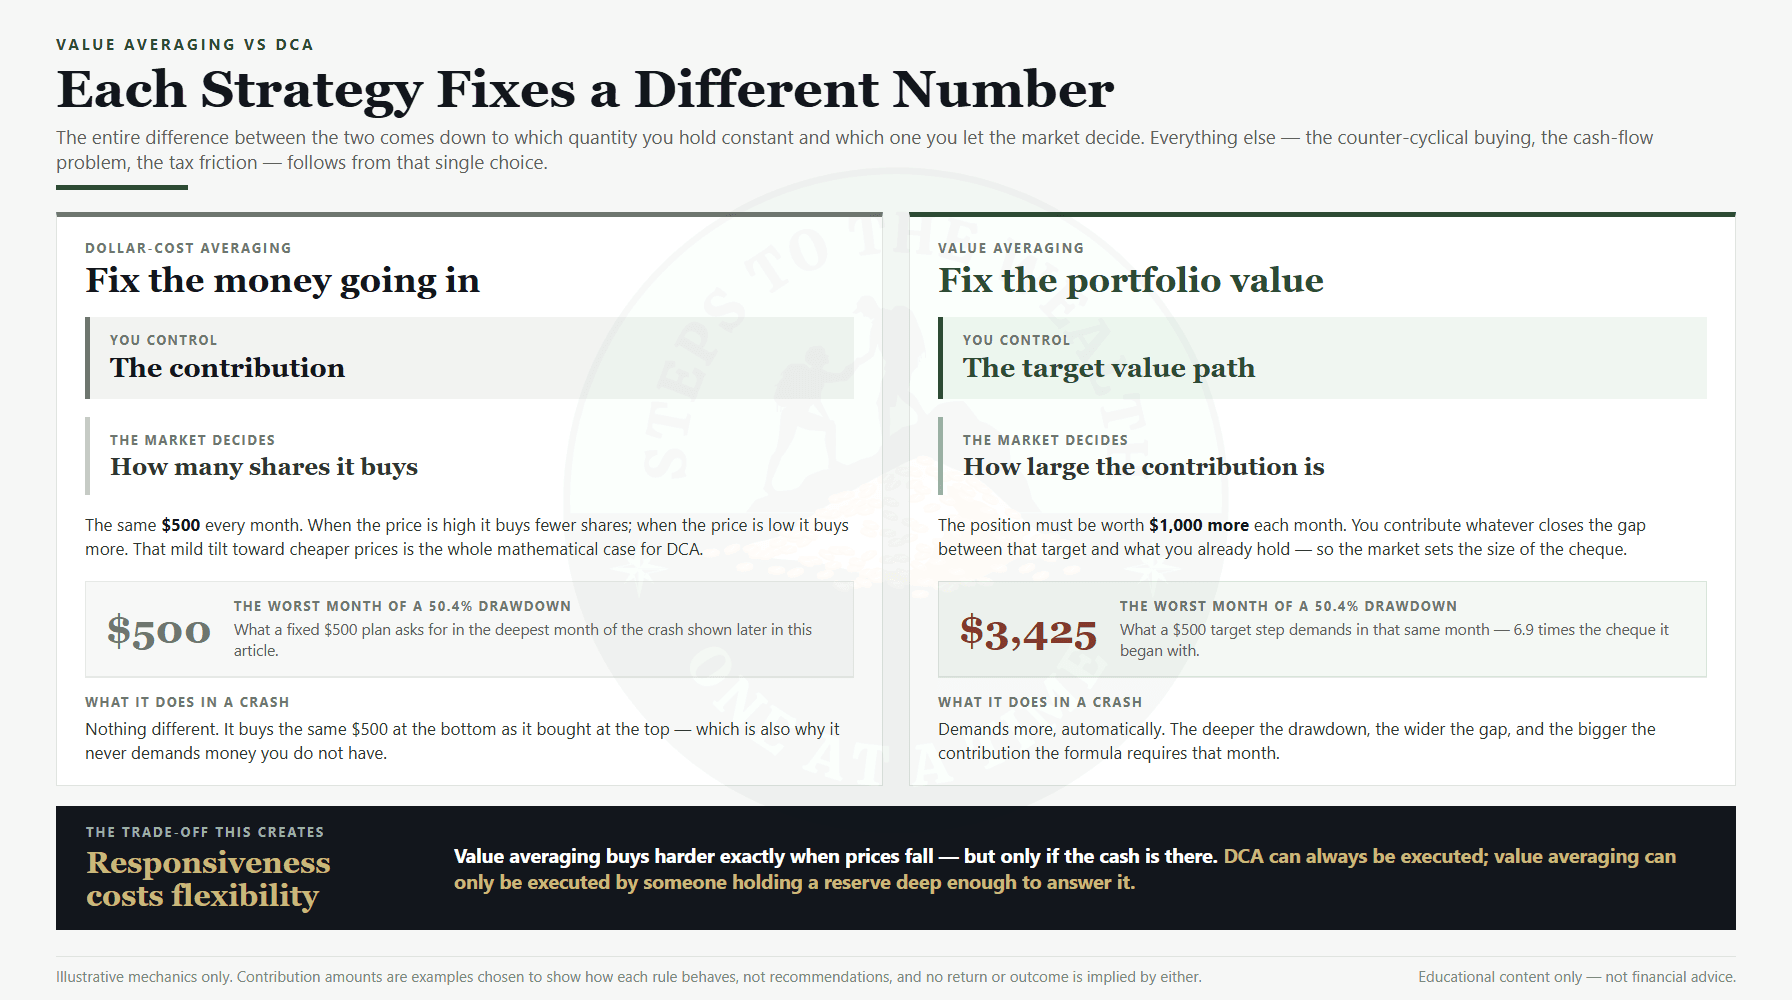
Fixed dollar-cost averaging is the strategy you have heard everywhere: pick an asset, pick a fixed amount, pick a fixed interval, and buy that amount on that schedule. $500 a month, no matter what.
The input you control is the money in. You put in the same dollars every period and let the share count fall out of whatever the price happens to be. When prices are high, your $500 buys fewer shares. When prices are low, it buys more. That mild “buy more when it is cheap” effect is the entire mathematical argument for DCA.
It is simple, it is automatic, and it requires zero thinking. It also buys at every price including the worst ones — a problem covered at length in How to Invest While Working Full Time. FINRA’s own write-up, The Benefits and Limitations of Dollar-Cost Averaging, is unusually direct about the same trade-off.
What value averaging does differently
Value averaging flips the thing you control. Instead of fixing the money in, you fix the portfolio value — and let the money in fall out of the math.
You set a target growth path for the portfolio itself. Something like: “I want my position to be worth $1,000 more at the end of each month.” Then each month you do arithmetic:
- Target value this month: say, $6,000.
- Actual value of what you already hold: say, $5,200 (the market dropped).
- The gap: $800. So you invest $800 this month to hit the target.
Next month the target is $7,000. If the market ripped and your holdings are already worth $6,900, you only invest $100. If the market crashed and you are sitting at $5,400, you invest $1,600 to catch back up to target.
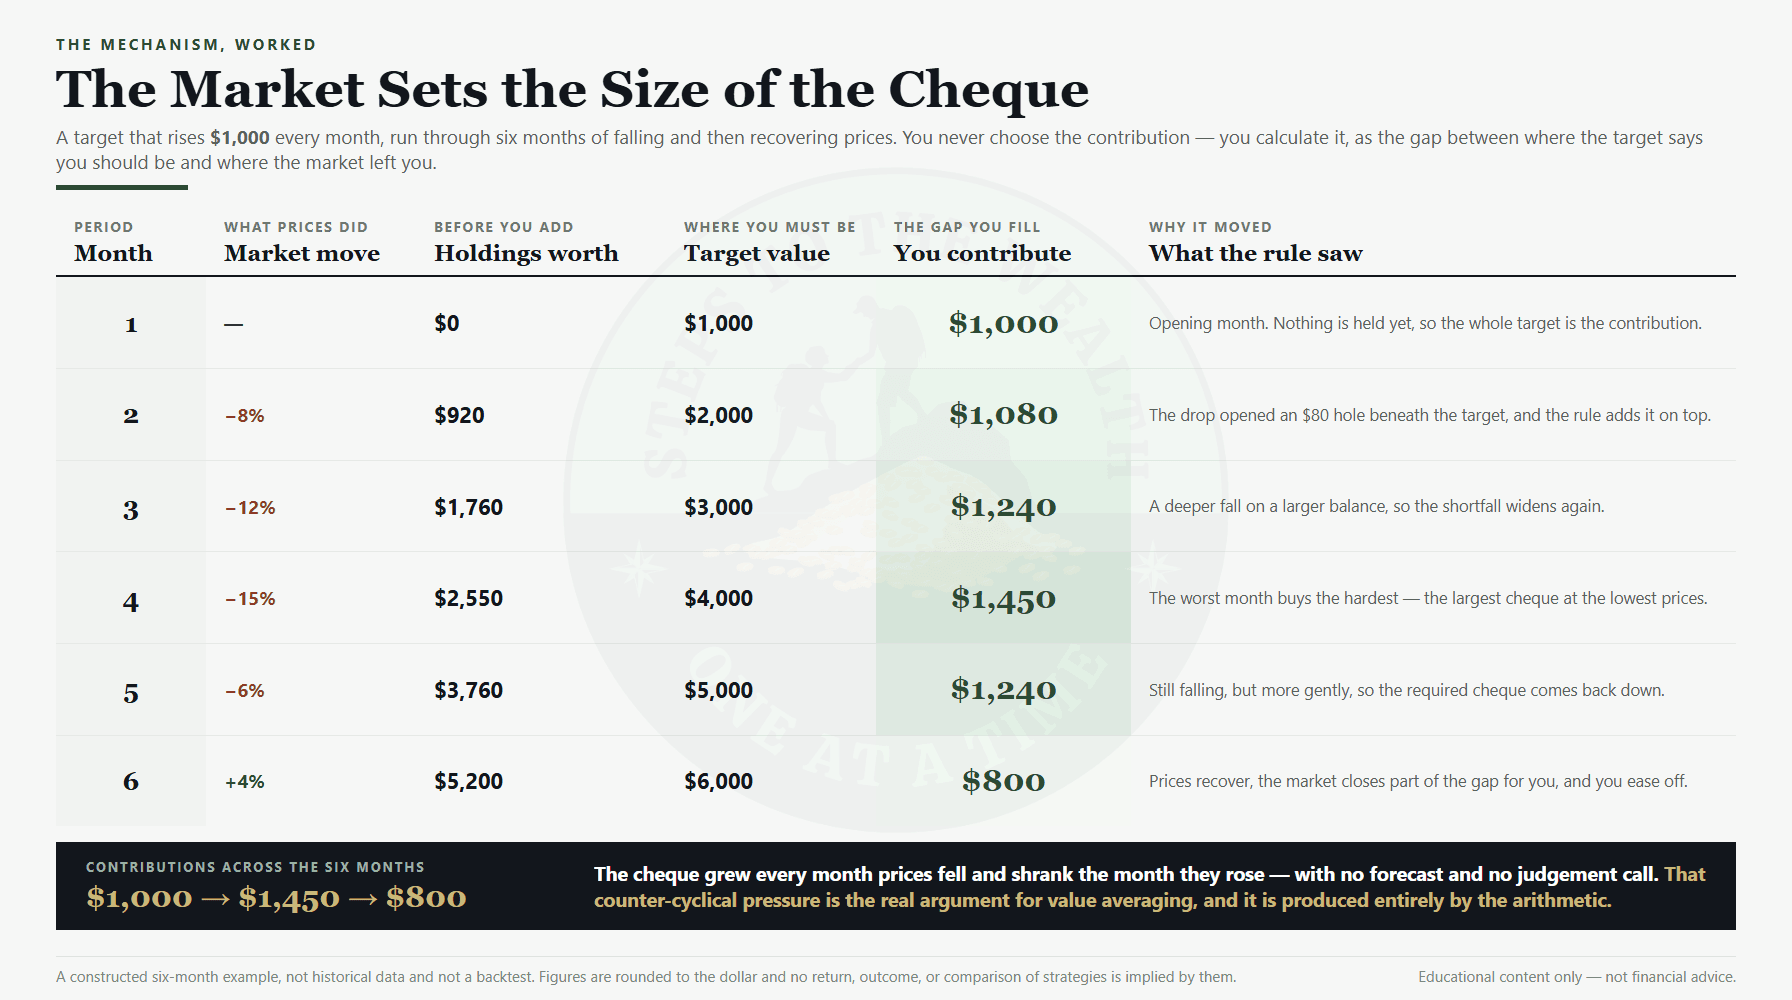
See what that does. It forces you to buy more after the market falls and less after it rises — automatically, mechanically, without any judgment call. When everyone else is scared and prices are down, the formula tells you to write the bigger check. When everyone is euphoric and prices are up, it tells you to ease off.
That counter-cyclical pressure is the real argument for value averaging, and it is a good one. It is the same instinct underneath a risk-first approach: deploy hardest where the price is lowest.
Where value averaging beats fixed DCA
In a market that falls and then recovers — the classic “V” or sawtooth — value averaging usually wins, sometimes by a wide margin. The reason is structural: the drawdown is exactly when value averaging is screaming at you to buy the most, so you accumulate the most shares at the lowest prices. Fixed DCA buys the same $500 there as it does at the top, so it under-weights the bargain.
Over choppy, volatile, range-bound assets, value averaging tends to produce a lower average cost basis than fixed DCA on the same capital. For a volatile asset like Bitcoin or a single stock, that edge can be meaningful.
That is the part the enthusiastic articles get right.
What the difference actually looks like on a price path
The claim that value averaging lowers your cost basis in choppy markets is worth seeing rather than accepting. Take six months, a fixed DCA contribution of $1,000 a month, and a value-averaging path that targets $1,000 of additional portfolio value each month. Same asset, same six months, one price path: $100, $80, $64, $80, $100, $100.
Fixed DCA writes the same check every month and lets the share count fall out of the price. Six $1,000 contributions buy 70.625 shares, for $6,000 deployed at an average cost of $84.96 a share. At the closing price of $100 the position is worth $7,062.50 — a gain of $1,062.50.
Value averaging writes whatever check the target demands:
- Month 1, price $100: nothing held, target $1,000, so it invests $1,000.
- Month 2, price $80: the 10 shares are worth $800 against a $2,000 target, so it invests $1,200.
- Month 3, price $64: holdings sit at $1,600 against a $3,000 target — the deepest point of the fall demands the biggest check, $1,400.
- Month 4, price $80: the recovery has done the work, holdings are at $3,750 against $4,000, so it invests just $250.
- Month 5, price $100: holdings are already at $5,000 against a $5,000 target. It invests nothing.
- Month 6, price $100: the target moves to $6,000 and the price has stopped falling, so it invests $1,000.
Value averaging ends with 60 shares for $4,850 deployed — an average cost of $80.83 against DCA’s $84.96. The position is worth $6,000, a gain of $1,150. So it finished ahead in dollars while committing $1,150 less capital, and it did it with no forecast, no judgment call, and no view on where the price was going.
Two things in that table deserve more attention than the headline. The first is month 3: the largest contribution of the whole run lands at the lowest price, which is the entire mechanism working exactly as designed. The second is month 5, where value averaging invests nothing at all. In a market that only goes up, that column stays at zero for a long time, and the money you did not deploy sits in cash earning nothing while fixed DCA quietly keeps buying. The sawtooth is where value averaging wins. A straight line up is where it does not.
The catch nobody mentions
Here is the part they skip.
Value averaging demands variable — and sometimes very large — contributions, exactly when you can least afford them. The whole mechanism depends on you being able to write a much bigger check during a crash. In a deep, extended bear market, the “amount needed to hit target” can balloon to several times your normal contribution, month after month. If your target says invest $4,000 this month and you have $500, the strategy breaks. You are not running value averaging anymore; you are running “DCA with extra anxiety.”
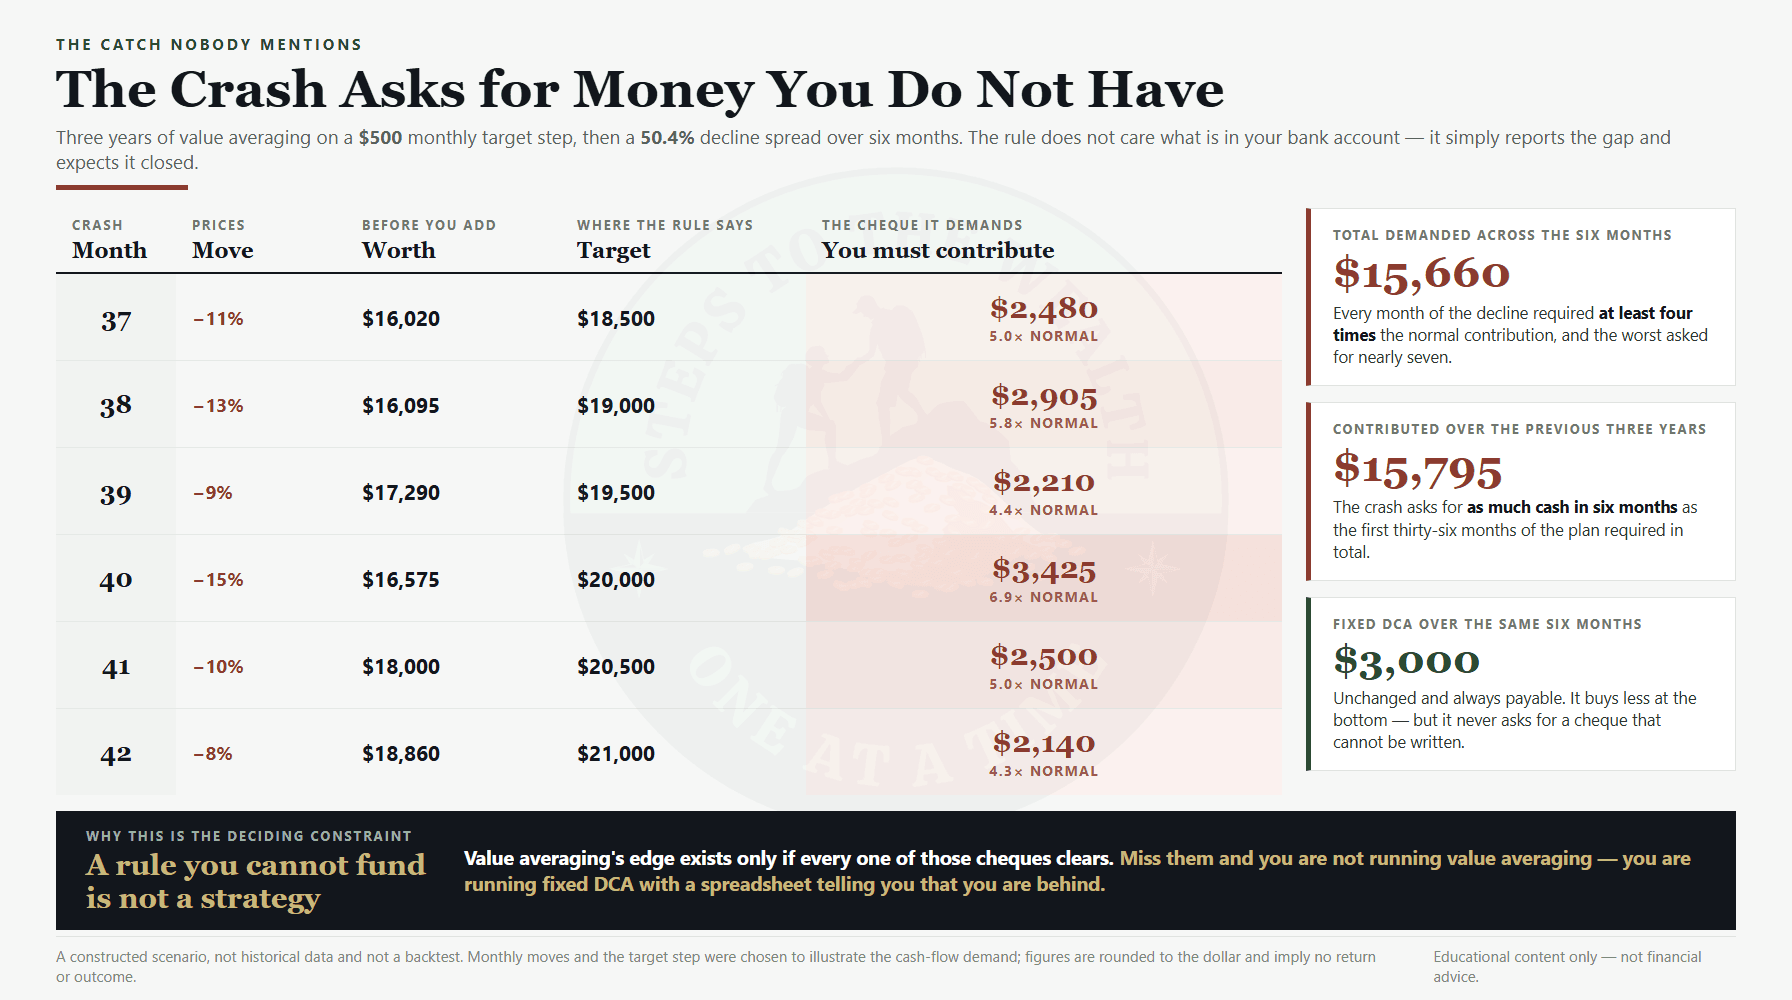
Busy professionals invest out of a paycheck, not a war chest. The strategy that works beautifully in a spreadsheet assumes a deep cash reserve sitting on the sidelines waiting to be deployed on command. Most people do not have that, and the ones who do rarely keep enough of it idle for years.
There is a second catch. Classic value averaging tells you to sell when the market runs ahead of your target — your holdings are worth more than the path requires, so you trim back to the line. That sounds disciplined, and sometimes it is. But it also means you are systematically capping your winners and, in a taxable account, triggering taxable events on every overshoot. A strategy that sells your best-performing asset every time it gets ahead is not obviously what a long-horizon investor wants.
This is why some implementations — including the value averaging mode in our own simulator — run it buy-only: you invest the shortfall on dips but never sell on overshoots, which keeps the cash flows one-directional and avoids forced selling. It is a more realistic version for someone building a position, but it gives up part of value averaging’s textbook edge.
What a real drawdown demands
“The contribution can balloon” is the standard warning, and it undersells the problem badly. Put numbers on it.
Say you are two years into a $1,000-a-month value averaging path. The target is $24,000 and the portfolio is on the line. Then the market falls 40% in a month. Your holdings are now worth $14,400. The target for next month is $25,000. The formula does not care what happened — it asks for the gap, and the gap is $10,600. That is not a stretch of the monthly budget. It is more than ten times it, from a single bad month.
Now let it fall another 20% the month after, which is entirely ordinary inside a real bear market. Your $25,000 becomes $20,000, the target moves to $26,000, and the formula asks for another $6,000. Across those two months, value averaging demanded $16,600 while the paycheck offered $2,000.
This is the point where the strategy stops being a strategy. Nobody skips those contributions and keeps running value averaging — they run a fixed contribution and carry a growing deficit against a target line that no longer means anything. The mechanism that produced the edge in the six-month example is precisely the mechanism that cannot be executed when the drawdown is deep and long rather than short and sharp. And the deep, long ones are the ones that decide how a portfolio finishes.
If you like the logic but invest from a paycheck
The counter-cyclical instinct behind value averaging is sound even when the mechanics are not. There are two honest ways to keep the instinct without pretending you have a war chest, and both cost something.
Cap the contribution and accept what the cap does. Set a ceiling — whatever you can genuinely fund every month, in a bad month as well as a good one — and let the formula ask for whatever it wants above that. You invest the cap and carry the shortfall as an unmet deficit.
Be clear about what you have built, though: a capped value averaging plan is a fixed DCA plan that leans in slightly on small dips and does nothing extra on the large ones. It behaves like value averaging exactly until the moment value averaging was supposed to earn its keep. Making the deficit up later is not a fix either, because “later” means buying the same shares at recovered prices, which is the edge handed back.
Or pre-fund a deployment reserve and pay for it honestly. Hold a defined pot of cash whose only job is to fund the outsized contributions, sized to something like six months of maximum demand rather than to a feeling. This version genuinely works, and the cost is visible: that reserve is out of the market for years, earning close to nothing in real terms, and the drag is real whether or not the crash you are reserving for ever arrives. Deliberately held cash is a position — it just needs to be a decision rather than an accident.
Both routes lead to the same fork the next section covers. Value averaging asks whether the price is below a line you drew. It never asks whether the price is any good.
Value averaging vs a risk-first dynamic approach
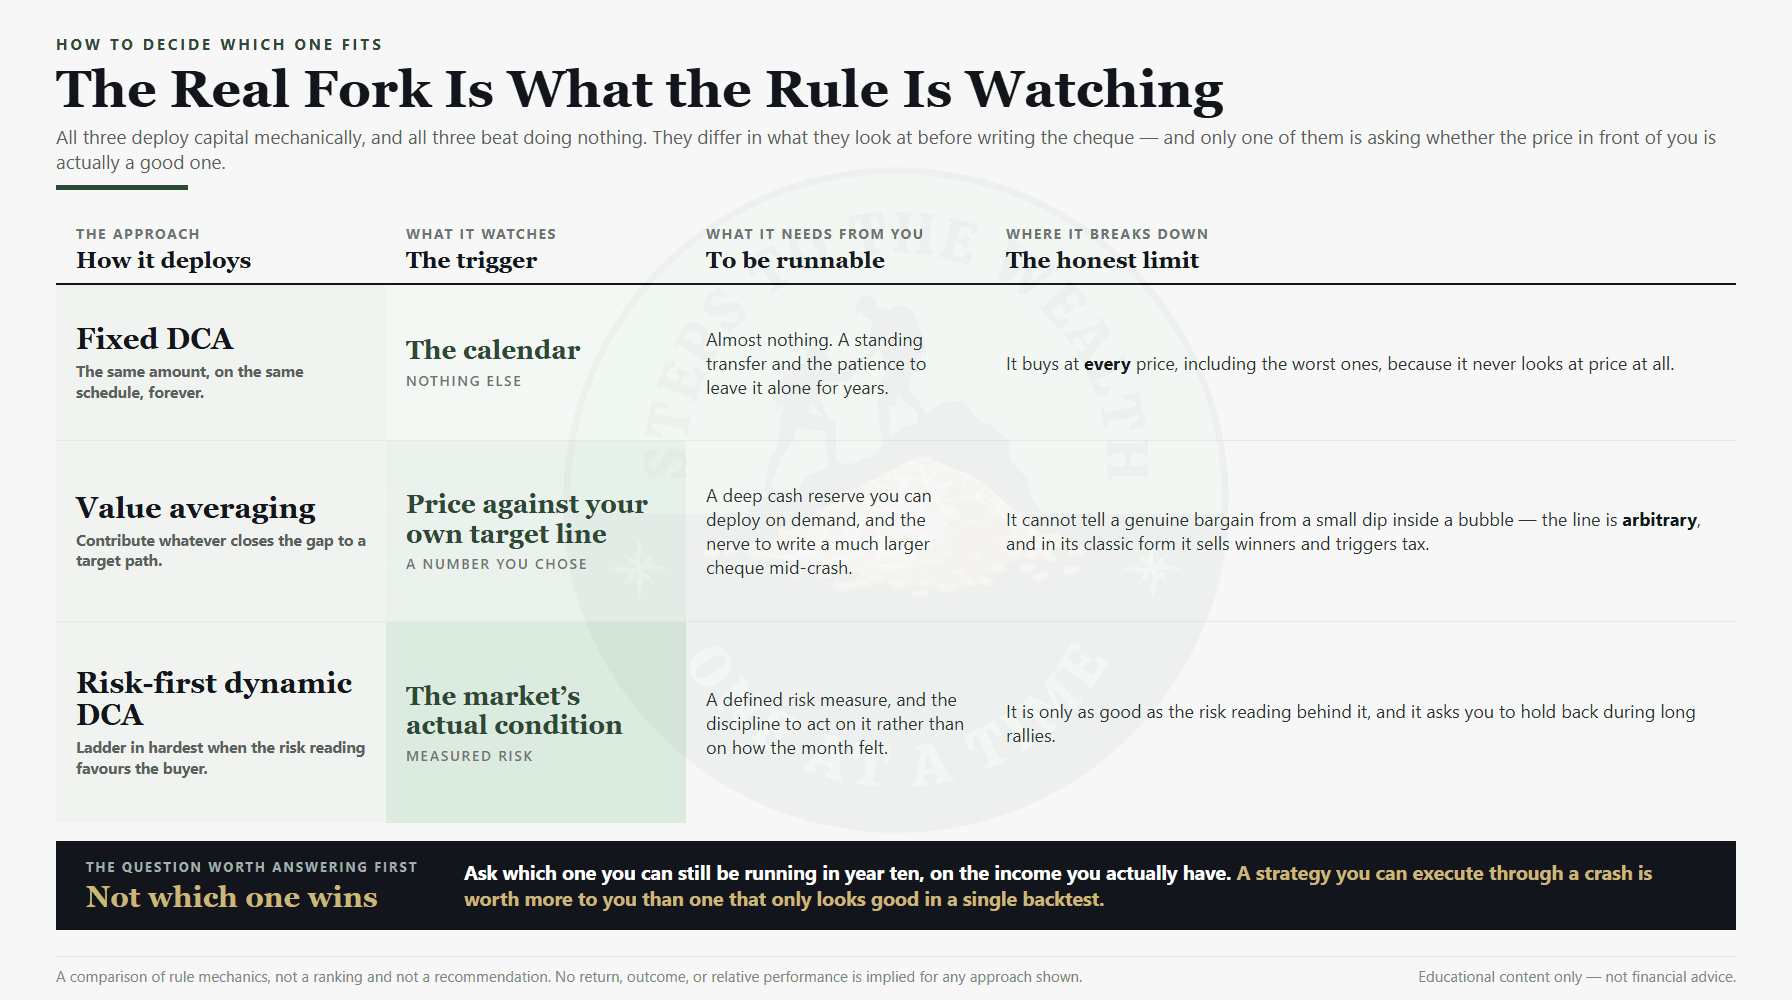
Both value averaging and dynamic DCA reject the core flaw of fixed DCA — buying the same amount at every price including the top. Both deploy more capital when the market is down. So what is the difference?
Value averaging is driven by a target number. Dynamic DCA is driven by risk.
Value averaging buys more whenever price is below your arbitrary growth path — even if the asset is still wildly overvalued and just fell from “insane” to “very expensive.” The formula does not know the difference between a genuine bargain and a small dip inside a bubble. It only knows the gap between your holdings and a line you drew.
A risk-first system asks a different question: not “is price below my target line?” but “is risk low right now?” It ladders capital in hardest when the risk reading says conditions actually favor the buyer, holds through neutral, and trims when risk gets high. The trigger is the market’s condition, not your contribution schedule or a target you set arbitrarily at the start.
In practice, value averaging is best understood as a halfway house: more responsive than fixed DCA, less informed than a risk-based system. It reacts to price relative to your own path. It does not react to whether the price is actually a good one.
How to decide which one fits you
A few honest questions:
Do you have a real cash reserve you can deploy on demand? If yes, value averaging is runnable and its counter-cyclical buying is a real edge. If you invest straight from a paycheck, value averaging will break the first time a crash demands a contribution you do not have.
Do you have the stomach to buy bigger during a crash? Value averaging’s edge only shows up if you actually write the larger check when your portfolio is deep red. If you would freeze — and most people do — the strategy’s advantage is theoretical.
Are you in a taxable account? Classic, sell-on-overshoot value averaging generates taxable events. A buy-only version avoids that but gives up some of the edge.
Do you want a rule tied to a number, or a rule tied to risk? This is the real fork. Value averaging is mechanical discipline against an arbitrary line. A risk-first system is discipline against market conditions. Both beat doing nothing. Only one of them is actually asking whether the price is good.
Test it before you commit a dollar
You do not have to take any of this on faith, and you should not. Run both on real history.
The DCA Simulator has a separate mode for each of them — fixed DCA, value averaging, and a dynamic risk-based approach — so you can run all three on the same asset, the same capital, and the same time window, then compare the cost basis, the final value, and the money-weighted return each one produced. (Fixed and dynamic DCA are open to everyone; the value averaging mode is a premium feature.) Run it across a crash like 2022, then across a steady bull market, and watch how the ranking changes depending on the regime. That is the whole point: no single strategy wins in every environment, and the simulator shows you which one fits the conditions you actually expect.
The worst way to choose a strategy is from one cherry-picked backtest in a blog post. The best way is to test all three on the scenarios you care about, with your numbers.
The takeaway
Value averaging is a real improvement over fixed DCA in the right conditions: it forces you to buy more when prices fall and less when they rise, which lowers your average cost in choppy markets. But it assumes a deep, flexible cash reserve most working professionals do not have, and in its classic form it sells your winners and triggers taxes.
It is a step in the right direction — from “buy the same amount at every price” toward “buy more when conditions favor you.” But it is still tied to an arbitrary target line, not to whether the price is actually good. A risk-first system asks the better question.
Run all three on real history before you pick one. The strategy you can actually execute for ten years beats the one that looks best in a single backtest.
Want to pressure-test your own plan?
Open the DCA Simulator and run fixed DCA, value averaging, and dynamic DCA on the asset and time window you actually care about. Same capital, same window, real history.
Prefer the system on one page first? The free Dynamic DCA Blueprint lays out the four phases and four triggers of the risk-based approach in a single PDF.
Related reads
- Dollar-Cost Averaging Myths, Ranked by What They Cost You
- Lump Sum vs DCA: What the Data Actually Shows (And When Each One Wins)
- How to Invest While Working Full Time (The Systematic Investor’s Playbook)
Educational content only — not financial advice. Strategy comparisons use historical scenarios for illustration; simulated outcomes are pedagogical examples, not predictions. Value averaging, dollar-cost averaging, and risk-based framing are ways to think about deployment — they are not personalized recommendations about any specific asset or allocation. Past performance does not predict future results.