
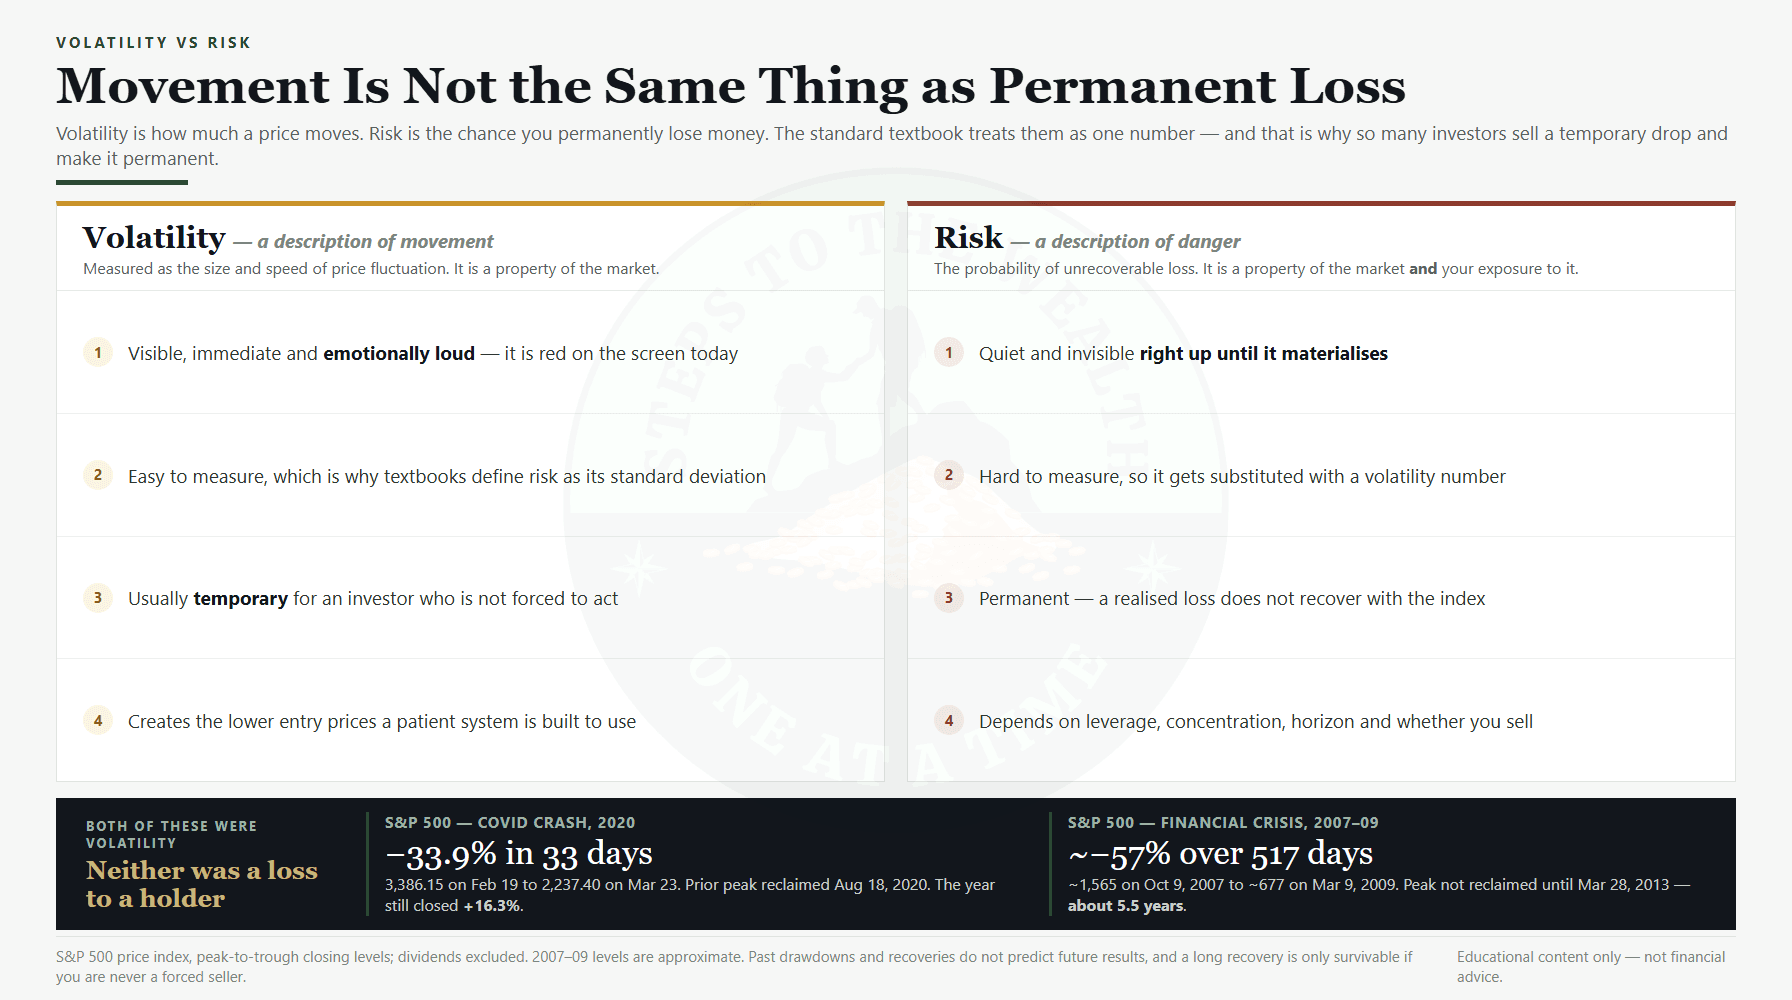
Volatility is how much a price moves around. Risk is the chance you permanently lose money. Volatility is not risk, and confusing the two is one of the most expensive mistakes an investor can make — because it turns normal, survivable price movement into a reason to sell at exactly the wrong time.
In early 2020 the S&P 500 fell from 3,386.15 on 19 February to 2,237.40 on 23 March: a drop of 33.9% in 33 calendar days. It reclaimed that peak on 18 August, and the year still closed up 16.3%. For an investor who held, that entire episode was volatility. For an investor who was forced to sell at the bottom, the identical price path was risk — about a third of the position, gone permanently. The difference was never the size of the move. It was whether the move could do permanent harm.
What is the difference between volatility and risk?
Volatility measures how much and how quickly an asset’s price fluctuates; risk measures the probability of a permanent, unrecoverable loss of capital. Volatility is a description of movement. Risk is a description of danger. An asset can be highly volatile without being especially risky to a patient holder, and an asset can be dangerously risky while barely moving day to day.
The standard finance textbook treats them as interchangeable — it defines risk as volatility, usually the standard deviation of returns. That is a convenient definition because volatility is easy to measure. But it quietly smuggles in a false idea: that price movement itself is the thing that hurts you. For a long-term investor, it usually is not. What hurts you is being forced to convert a temporary drop into a permanent loss — by selling, by leverage, or by needing the money at the wrong moment. Volatility is the weather. Risk is whether you are caught outside without shelter.
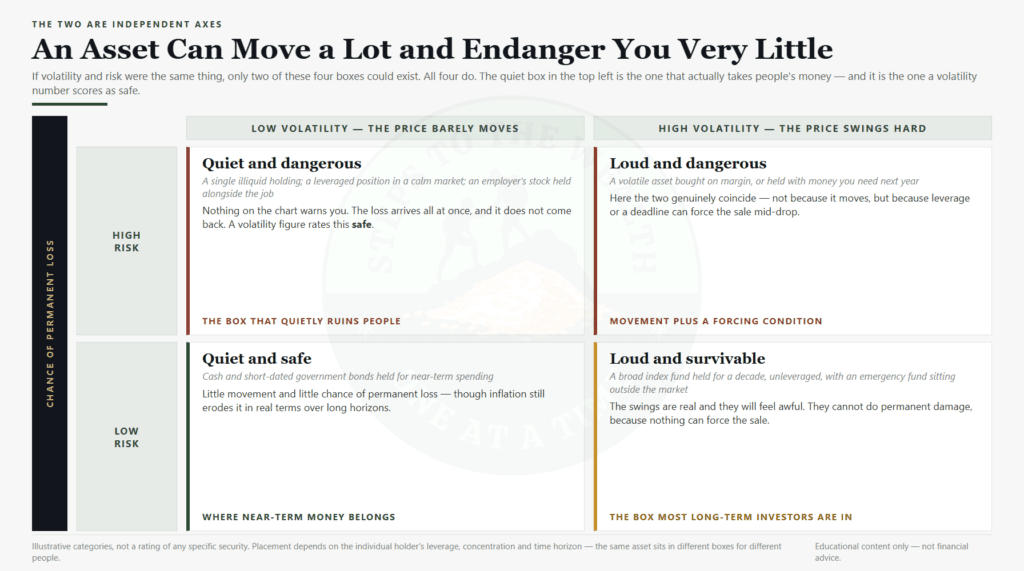
If the two were really one thing, only two of those four boxes could exist. All four do — and the quiet, dangerous box in the top left is the one a volatility number scores as perfectly safe.
Why do people confuse volatility with risk?
People confuse volatility with risk because volatility is visible, immediate and emotionally loud, while true risk is quiet until it is too late. A 4% drop shows up in red on your screen today and triggers a physical stress response. The actual risk — that you will sell in panic, or that you are overexposed to a single asset that could go to zero — is invisible right up until the moment it materialises.
This confusion is not a personal failing. It is what happens when human wiring meets a price chart. Your brain treats a falling number as a present threat, the same way it would treat a physical one, and loss aversion makes a 20% drop feel roughly twice as bad as a 20% gain feels good. So the volatile market feels like the risky market, and the feeling is urgent enough to override the plan.
That is exactly the mechanism behind the fear that keeps people out of the market entirely. The investor who cannot separate the two ends up managing their own discomfort instead of managing risk — and selling volatility at a loss is how that discomfort gets expensive.
When is volatility actually dangerous?
Volatility becomes genuine risk only when something forces a temporary drop to become permanent — most often selling in panic, using leverage, or needing the money on a fixed timeline. On its own, a swinging price is just movement. Five conditions convert movement into loss, and every one of them is within your control.
| Condition | Why it turns volatility into real risk | The defence |
|---|---|---|
| Panic selling | You lock the drop in by selling at the bottom | A pre-set rule you follow instead of the feeling |
| Leverage | A temporary drop triggers a margin call, forcing the loss | Avoid leverage, or size it so no swing can force your hand |
| Short time horizon | You need the cash during the drop and must sell | Keep near-term money out of volatile assets entirely |
| Over-concentration | One volatile asset can permanently impair the whole portfolio | Diversify so no single move is fatal |
| No cash buffer | An emergency forces you to sell investments at the worst time | Hold an emergency fund outside the market |
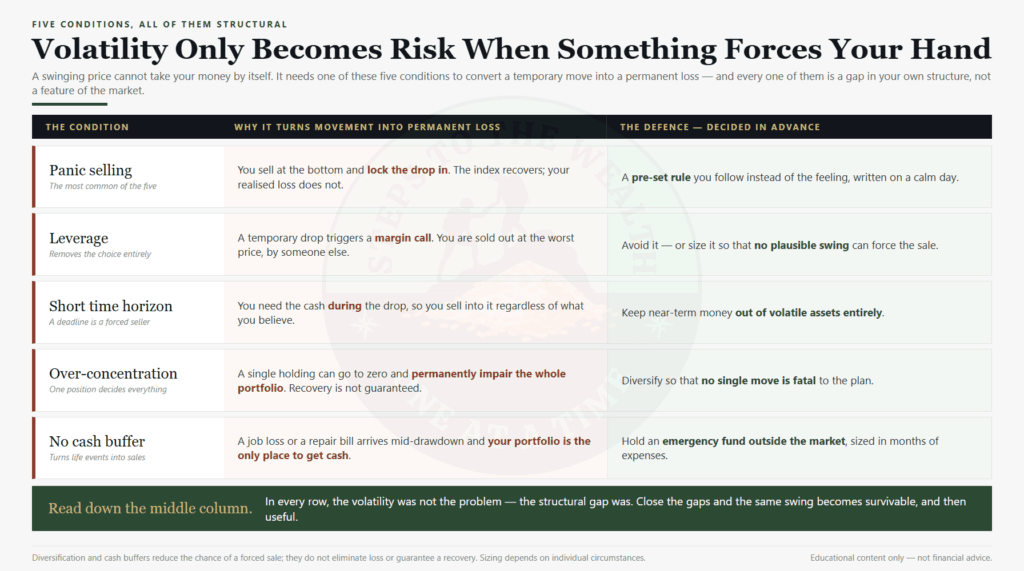
Read down the middle column. In every case the volatility was not the problem — a structural gap was, and the gap is what let a temporary move do permanent damage. Close the gaps and the same volatility becomes survivable, even useful, because it is what creates the lower entry prices a patient system is built to exploit.
One caveat on the fourth row. Spreading money across holdings genuinely reduces the chance that a single position ruins you, and FINRA’s primer on asset allocation and diversification is a fair statement of the mainstream case. But diversification is protection against concentration, not against market-wide drawdowns — in a genuine crash, correlations converge and nearly everything falls together. We put numbers on that in nine crashes diversification never stopped. Diversify because it removes the single-position failure mode, not because it makes drawdowns go away.
What did the 2020 and 2008 drawdowns actually cost?
The two deepest drawdowns of the modern era make the distinction concrete, because the same price path produced completely different outcomes depending on whether the investor could be forced to sell.
The COVID crash of 2020 took the S&P 500 down 33.9% in 33 calendar days, from 3,386.15 to 2,237.40. The prior peak was reclaimed on 18 August 2020 — 181 days from the peak, under six months. A holder who did nothing was whole before the year was out, and the index finished 2020 up 16.3%.
The 2008 financial crisis was a different animal: roughly 57% off the peak, from about 1,565 on 9 October 2007 to about 677 on 9 March 2009, over 517 days. The peak was not reclaimed on price alone until 28 March 2013 — about five and a half years later.
Both were volatility. Neither was a permanent loss to anyone who held. But the second case is where honesty matters more than reassurance: five and a half years is a long time to be underwater, and “just hold” is only available to an investor who is never forced to sell. That is a structural question about your cash buffer, your leverage and your horizon — not a question about your conviction. Past drawdowns also do not predict the next one; a different recovery path produces a different answer on identical rules.
How do you measure risk if not by volatility?
You measure risk by asking how much permanent damage a move could do to your position — your concentration, your leverage, your time horizon and your likelihood of selling — not by how much the price bounces around. Volatility is a market property. Risk is a property of the market and your exposure to it. The same 20% swing is trivial risk for a diversified investor with a decade-long horizon and serious risk for someone leveraged, concentrated and needing the money next year.
A risk-first system measures a few things that actually predict permanent loss:
- How stretched the market is. Not “did it move,” but “did it move to a level that historically precedes large, lasting drawdowns.”
- Your drawdown exposure. How far the whole portfolio could fall, and whether you could actually hold through that number rather than whether you believe you could.
- Your forced-selling risk. Whether an emergency, a margin call or a deadline could compel you to sell during a drop.
- Sequence-of-returns risk. When you are drawing capital down, the order of returns matters enormously — a bad stretch early can do permanent damage that the same returns in a different order would not.
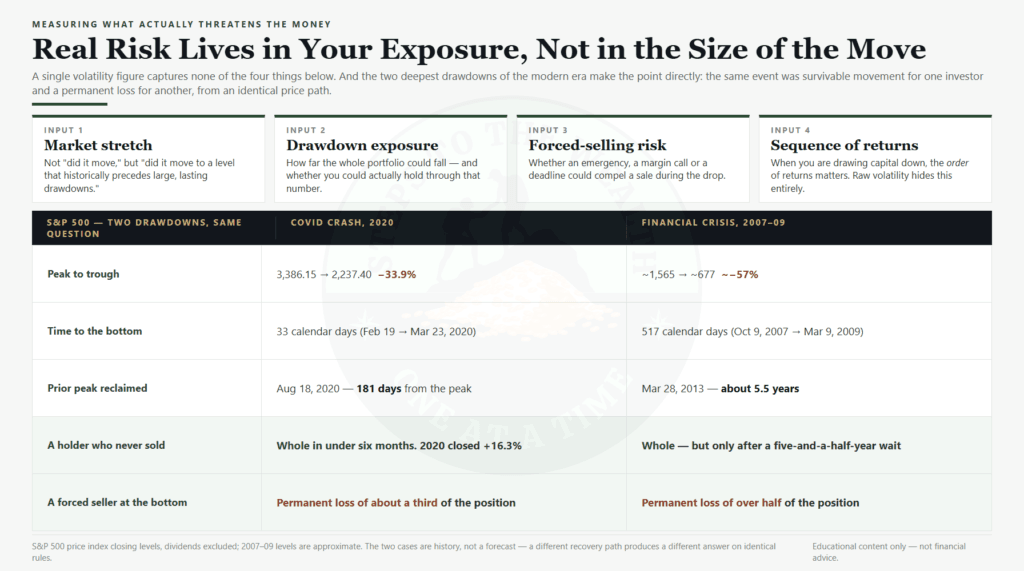
None of these is captured by a single volatility figure. All of them are what actually determine whether you keep your money.
What should you do about volatility?
You should treat volatility as information about price, not as a threat to flee — and you should engineer your position so that no amount of volatility can force a permanent loss. Once you separate the two, volatility stops being the enemy. It becomes the mechanism that hands patient, well-structured investors better entry prices.
The practical shift is to stop reacting to price movement and start managing the structural conditions that convert movement into loss. Keep near-term money out of volatile assets. Avoid leverage that can force your hand. Diversify so no single position is fatal. Hold a cash buffer so an emergency never makes you a forced seller. And govern your buying with a mechanical rule rather than a judgement call made mid-drop — which is the part most dollar-cost-averaging advice gets wrong.
Do that, and the next time the market lurches you will feel the volatility and know it is not the same thing as risk. The people who internalise that difference are the ones still holding — and still buying — when everyone else has sold.
A worked example: two investors, one identical drawdown
The cleanest way to see the distinction is to run the same price path through two different structures and watch it produce two different outcomes.
Both investors hold $100,000 in the same broad index fund. Both experience the 2020 drop of 33.9%, so both watch the position fall to $66,100. Nothing about the market treated them differently. Everything about their structure did.
Investor A holds six months of expenses in cash, outside the market. No leverage. No money in the position that is needed inside a decade. When the drop comes, nothing about it obliges A to act. The balance is ugly for a few months and then it is not: the peak was reclaimed 181 days later. A’s permanent loss from a 33.9% crash is zero. The drawdown was volatility from start to finish.
Investor B holds the same $100,000, but $30,000 of it is a house deposit due in four months, and there is no cash buffer behind it. At the trough that slice is worth $30,000 × 0.661 = $19,830. The deadline does not move, and 181 days is longer than four months — so B sells near the bottom and takes a permanent loss of $10,170. B did nothing foolish in the moment. The loss was set months earlier, when near-term money was put in a volatile asset.
Note what that means: even the fastest recovery from a major crash in modern history was too slow for a four-month deadline. And 2020 was the kind outcome. Run the same structure through 2007–2013 and B is waiting five and a half years for a deposit due in four months. The variable that decided both cases was never the depth of the fall. It was whether anything could force a sale.
What volatility does cost you, even if you hold
The argument so far can be pushed too far, so here is the honest other side. “Volatility is not risk” does not mean volatility is free.
Start with the arithmetic of recovery, which is not symmetrical. A 33.9% fall needs a 51.3% gain to get back to even, because you are climbing from a smaller base: 1 ÷ 0.661 = 1.513. A 50% fall needs 100%. The deeper the drawdown, the more disproportionate the climb — which is why avoiding the worst of a fall is worth more than capturing the best of a rally, and why sizing contributions to conditions is a rule worth having.
Then there is time. Investor A above lost no capital, but was underwater for six months in 2020 and would have been underwater for five and a half years after 2007. That is not a permanent loss, and it is not nothing either. Capital sitting in a hole is capital not compounding from a higher base, and the cost is real even though it never shows up as a realised loss.
And in decumulation the picture changes again. Once you are selling assets to live on, a bad stretch early does permanent damage that the identical returns in a different order would not, because each withdrawal during the fall removes shares that never participate in the recovery. For a retiree, sequence risk means volatility genuinely is a form of risk — which is exactly why the accumulator’s rule of “hold through it” does not transfer to someone drawing down.
Where “volatility is not risk” gets misused
The phrase is true, and it is also one of the most convenient things an investor can tell themselves. It becomes a problem the moment it is used to avoid a question rather than answer one.
- As cover for a broken thesis. A diversified index falling 30% with the economy is volatility. A single company falling 30% because its business deteriorated is information. Calling both “just volatility” is how people ride a position to zero while congratulating themselves on their discipline.
- As cover for a position that cannot recover. Some instruments do not simply bounce back. Leveraged and inverse products reset daily, so a choppy sideways market grinds them down even when the underlying ends flat. There, the movement itself is doing the damage.
- As cover for a size that was always wrong. If a normal drawdown in one holding would materially change your life, that is not a volatility tolerance problem to be solved with resolve. It is a position-sizing problem, and the honest fix is to be smaller.
The test is simple and worth applying before you use the phrase on yourself: if this asset fell 50% tomorrow, is there a mechanism that brings it back? For a diversified index held by someone who cannot be forced to sell, the answer is broad economic growth over time, and the phrase holds. For a single speculative position, a leveraged product, or money you need next year, there is no such mechanism — and “volatility is not risk” is being used to describe risk.
Manage risk, not price movement
Volatility will happen whether you are ready or not. The question is whether each swing is a threat to your capital or an entry point for it — and that comes down to reading real risk, not reacting to a red number.
Steps To The Wealth Weekly delivers a plain-English risk reading every Sunday across five major assets — the signal that tells you when a drop is danger and when it is opportunity.
No predictions. No hype. Just the difference between volatility and risk, read for you every week.
Frequently asked questions
What is the difference between volatility and risk?
Volatility is how much and how fast an asset’s price moves; risk is the probability of a permanent, unrecoverable loss. Volatility describes movement, which is often temporary. Risk describes danger — the chance you actually keep less money. A volatile asset can be low-risk to a patient holder, and a barely-moving asset can carry serious risk.
Is a volatile investment always risky?
No. Volatility only becomes real risk when something forces a temporary drop to become permanent — panic selling, leverage, a short time horizon, over-concentration, or needing the money during the drop. Remove those conditions and a volatile asset can be held through its swings by a long-term investor.
Why do investors confuse volatility with risk?
Because volatility is visible and emotionally loud, while true risk is quiet until it materialises. A falling price triggers an immediate stress response, and loss aversion makes drops feel worse than equivalent gains feel good. So the volatile market feels like the risky one, prompting people to sell temporary movement at a permanent loss.
How do you measure investment risk properly?
By assessing how much permanent damage a move could do to your specific position — your concentration, leverage, time horizon, likelihood of selling, and exposure to sequence-of-returns risk — plus how stretched the market is relative to levels that historically precede large drawdowns. A single volatility number captures none of this.
Should I sell when the market gets volatile?
Usually not. Selling into volatility is the main way investors convert a temporary drop into a permanent loss. The better response is to structure your position so no swing can force your hand, and to let a measured risk reading — not the size of the move — decide whether to hold, ease off or add.
How long did it take the market to recover from 2020 and 2008?
The S&P 500 reclaimed its February 2020 peak on 18 August 2020, 181 days after the peak. The 2007 peak was not reclaimed on price alone until 28 March 2013, about five and a half years later. Both drawdowns were survivable for a holder who was never forced to sell, but the recovery times were an order of magnitude apart.
Educational content only — not financial advice. Examples and historical figures are for illustration and do not predict future results.