

Every track record you have ever been shown survived long enough to be shown to you. That sentence sounds like a truism. It is actually an arithmetic problem, and survivorship bias is its name. The returns you can see are not a sample of what happened. They are a sample of what lasted, and the difference between those two things is a number you can calculate.
This is not an article about people lying to you. Almost nobody in this process is lying. The fund that closed did not issue a press release. The strategy that stopped working simply stopped being mentioned. The company that went to zero left the index quietly, years ago, and nothing on the page you are reading today records that it was ever there. The filter runs whether or not anyone intends it.
What follows is the mechanism, the arithmetic that tells you how big the distortion is, four places the filter operates, and a ninety-second test you can run on the next performance chart somebody puts in front of you.
Survivorship bias is a sampling problem, not a dishonesty problem
Start with the cleanest possible version. A hundred funds launch in the same year. Fifteen years later, sixty are still running and forty have closed, merged away or been quietly folded into something else. A website lists the sixty that remain and reports their average annual return.
That average is correct. Every number in it is accurate. It is also the answer to a question nobody asked: how did the winners do? The question you actually wanted answered was how did the category do? Those are different questions, and only one of them was available to be measured.
Nothing was concealed. The forty missing funds are not hidden in a footnote; they are gone from the database entirely, because a fund that no longer exists does not report returns. The sample was assembled by survival. That is the whole mechanism.
The reason this matters more than most biases is that it does not feel like a bias. Anchoring feels like a mistake once it is pointed out. Survivorship feels like data. You are looking at a real table of real numbers, and the flaw is not in any of them — it is in the list of rows.
The arithmetic: what the missing funds do to the average
The distortion is not a vibe. It has a formula, and the formula is short enough to do in your head.
Call the share that survived s. Call the survivors’ average return Rs and the disappeared group’s average return Rd. The true average across everything that launched is s × Rs + (1 − s) × Rd. What you are shown is just Rs. So the overstatement is:
(1 − s) × (Rs − Rd)
The gap between the visible number and the honest one is the disappearance rate multiplied by how much worse the disappeared were. Two inputs. That is all it takes.
Run the hundred-fund example through it. Sixty survive, so the disappearance rate is 40%. Say the survivors averaged 8% a year and the forty that closed averaged 2% before they went. The true average is 0.60 × 8 + 0.40 × 2 = 5.6%. The overstatement is 0.40 × 6 = 2.4 points.
An 8% category that was really a 5.6% category. Nobody misreported a single figure to get there.
Both inputs are assumptions here, and I want to be plain about that: these are illustrative numbers chosen to show the shape, not measured ones. But that is the useful part. You do not need to know the real disappearance rate to understand the structure — you need to know that the structure exists, and that it scales.
How fast the distortion grows
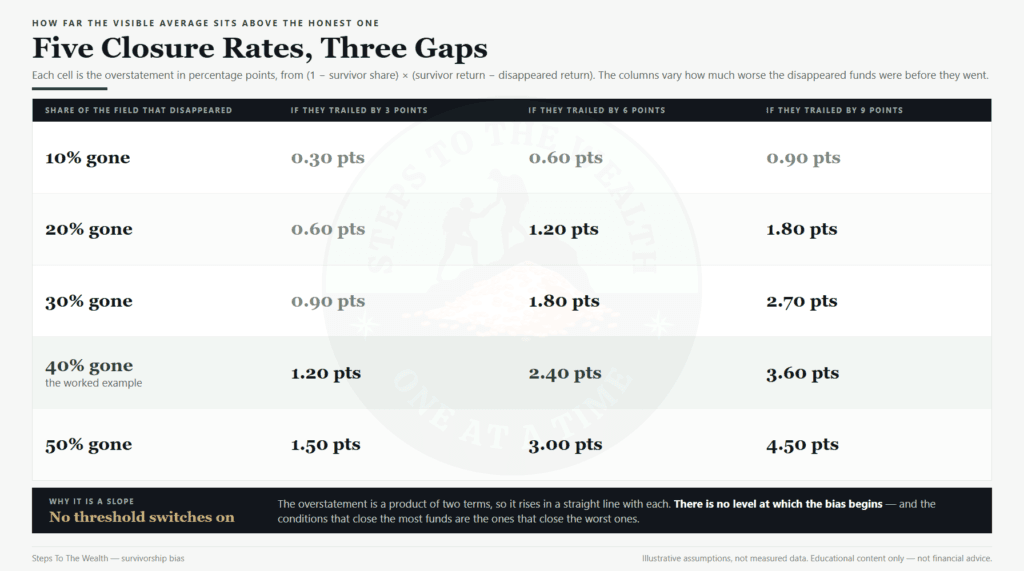
Because the formula is a product of two terms, the overstatement climbs in a straight line with each of them. Hold the performance gap at six points and vary how many disappeared, and the picture is uncomfortable at the levels that actually occur.
At a 10% disappearance rate the visible average is 0.6 points too high. At 30% it is 1.8 points. At half the field gone it is 3.0 points. Nothing dramatic happens at any threshold; there is no point where the bias switches on. It is a slope, in the same way that sequence of returns risk is a slope rather than a switch.
What makes the slope dangerous is that the disappearance rate and the performance gap tend to rise together. The environments that kill the most funds are the ones where the killed funds did worst. A quiet decade removes few managers and removes them gently. A violent one removes many, and removes them from the bottom. The two terms in the formula are not independent, and they move the wrong way at the same time.
The better question: how much disappearance would erase the edge?
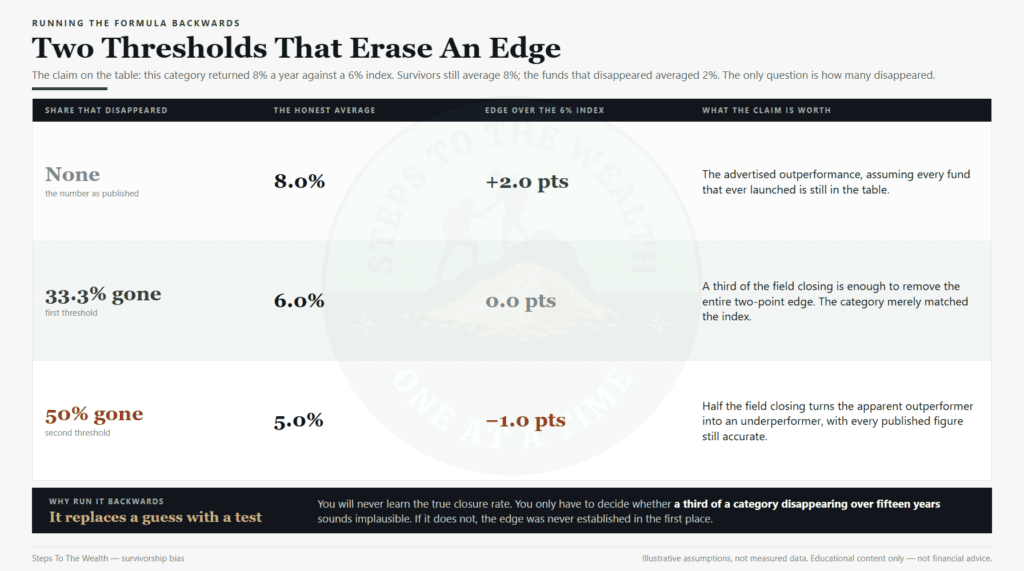
Arguing about the exact disappearance rate is usually a dead end, because nobody has the number. There is a more productive way to use the same formula: run it backwards and ask how much disappearance it would take to erase the advantage being claimed.
Keep the survivors at 8% and the disappeared at 2%. Suppose the claim being made is that this category beat a 6% index. Set the true average to 6 and solve: s × 8 + (1 − s) × 2 = 6 gives a survivor share of 66.7%. So a disappearance rate of just 33.3% is enough to wipe out the entire two-point edge.
Push it further. For the honest number to fall to 5% — below the index rather than above it — the survivor share has to reach 50%. Half the field disappearing turns an apparent outperformer into an underperformer, with every published figure remaining accurate.
This reframing is the practical one, because it converts an unanswerable question into a plausibility check. You do not have to know how many funds closed. You only have to ask whether a third of them closing over fifteen years sounds implausible. If it does not, the edge was never established.
One honest limitation of this arithmetic
The formula above weights every fund equally, and reality does not. If the funds that closed were mostly small and the survivors mostly large, an asset-weighted view of the same category produces a smaller distortion than the equal-weighted one, because the money was never distributed the way the fund count implies.
That cuts both ways, and it is worth stating rather than glossing. Equal weighting answers “how did a randomly chosen fund do”, which is the right question if you were picking blind. Asset weighting answers “how did the average dollar do”, which is the right question if you want to know what the category delivered in aggregate. Neither is wrong; they are answers to different questions, and a table that does not say which one it used has not told you enough to judge it.
Filter one: closure removes the failures from the record
The first filter is the literal one. A fund closes and stops reporting. Its history does not get appended to a public archive of failures; it stops. When a database advertises coverage of a category, it is covering the category as it exists now.
This is the version most people mean when they use the term, and it is the easiest to check. Ask one question of any fund comparison: how many funds were in this category when the period started, and how many are in it now? If the second number is smaller and the table only shows the second group, you are reading survivors.
The same filter runs on strategies, not just products. A tactical approach that worked for six years and then stopped working does not usually get a retraction. It gets a quiet absence. The people who ran it move on to the next thing, and the next thing is what you hear about.
Filter two: today’s index is not the list you would have bought
This one needs care, because there is a real distinction here that gets flattened constantly, and getting it wrong would mean distrusting something that is actually sound.
A broad index’s return series is generally not survivorship-biased. When a company fails and drops out, the index does not go back and erase it from history. The return recorded for the year it collapsed included that collapse, at the weight it was held. The series chained through the loser in real time, which is exactly what you want.
The bias appears when you take today’s constituent list and run it backwards. Screening the current members of a large index and measuring how they performed over the past twenty years is not a study of that index. It is a study of the companies that were good enough to still be in it, which you could not have known to buy twenty years ago. The list is survivor-selected even though the index is not.
That is a narrow distinction with a wide consequence. It is why “these ten stocks would have made you rich since 2005” is close to meaningless, while “the index returned X% since 2005” is not. One of those sentences chose its sample after seeing the outcome.
It is also why this is a different problem from the traps in how to backtest a DCA plan. Those traps are about the window you test — too short, too lucky, over-tuned. This one is about the sample you test, and a perfectly chosen window will not save you if the list itself was assembled with hindsight.
Filter three: nobody publishes a failure
The third filter is editorial, and it operates on everything you read.
Consider what has to happen for a track record to reach you. Somebody has to have one worth showing. They have to decide showing it is worth their time. Somebody else has to decide it is worth publishing. Each of those steps is a selection, and each of them selects in the same direction. There is no market for the retrospective of a strategy that returned 3% and was abandoned.
This is why the density of impressive results in your feed carries almost no information about the base rate. You are not seeing a sample of attempts. You are seeing a sample of the attempts that produced a publishable outcome, filtered again by which of those someone chose to amplify.
The honest response is not cynicism about every number you read. It is a habit: before reacting to a result, ask what the denominator was. How many people ran this and are not in the article? If that number is unknowable, the result is an anecdote wearing a percentage sign, and it should be weighted accordingly.
Filter four: your own memory runs the same filter
The last filter is the one you carry around, and it is the hardest to audit because there is no database to check.
Your recall of your own decisions is survivor-selected too. The position that worked came with a story: what you noticed, why you acted, how it felt to be right. The four that quietly did not work came with nothing — no narrative, no moment, nothing to attach the memory to. So they fade at a different rate, and what is left is a personal track record that has been filtered by exactly the same mechanism as the fund database.
This is the version already touched on in investing versus trading, and it compounds with the documented tendency of active traders to underperform their own holdings. The Barber and Odean study of 66,465 households found the market returning 17.9% annually while the average household made 16.4% and the busiest fifth made 11.4%. The gap is real, and memory is what stops most people noticing it in their own results.
The only defence is a written record made at the time of the decision, not reconstructed afterwards. A decision log is boring and it is the single cheapest correction available, because it is the one sample nobody else can filter for you.
What 2.4 points costs a plan you are actually running
A 2.4 point overstatement sounds survivable. Put it into a contribution plan and it stops sounding survivable.
Take $500 a month for 25 years — $150,000 of deposits. Compounded at the visible 8%, that plan ends at $475,513. Compounded at the honest 5.6%, it ends at $325,930.
The difference is $149,583. At these assumptions that lands within a few hundred dollars of the entire $150,000 you paid in over the quarter century. That near-match is a coincidence of the particular numbers chosen and should not be treated as a rule — but the order of magnitude is not a coincidence at all. A gap of a couple of points, held for decades, is worth about as much as everything you contributed.
There is a second way to read the same result, and it is the one that tends to land. If you keep the honest 5.6% and still want to reach $475,513, you do not need a slightly longer plan. You need 64 more months of contributions — five years and four months, on top of the twenty-five. That is what believing the filtered number costs when you build a plan on it.
This is the same asymmetry that runs through the goal and plan mismatch: a small error in the assumed rate does not produce a small error in the outcome, because the rate is the term that gets exponentiated.

How to read any track record in ninety seconds
You do not need to reconstruct the missing data. You need to establish whether it is missing, which is a much cheaper question.
Ask what the starting population was. Not how many are in the table — how many were in the category when the measurement period began. A table that cannot tell you is a table of survivors.
Ask when the list was chosen. If the constituents were selected today and the performance was measured backwards, the result tells you about selection, not about strategy.
Ask what happened to the ones that are gone. Merged, closed, delisted, or simply dropped from coverage? You will often not get an answer, and not getting one is itself the answer.
Ask who had an incentive to show you this. Not as an accusation — as a reminder that publication is a filter even when everyone involved is honest.
Four questions, none of which require data you do not have. If a record survives all four, it is worth reading. Most do not survive the first.
What survivorship bias does not explain
A framework that explains everything explains nothing, so here is where this one stops.
It does not mean all historical returns are inflated. As covered above, a broad index’s own series is not filtered this way, and treating it as though it were would push you toward doing nothing, which is its own expensive decision.
It does not mean skill is imaginary. It means skill cannot be identified from a filtered sample. Those are different claims, and only the second one is defensible.
It does not explain volatility, and it is not a reason to avoid risk. Confusing the two leads somewhere unhelpful — the distinction between the two is the subject of volatility is not risk.
And it is not an argument for paralysis. The correct response to a filtered sample is to widen the sample or lower your confidence, not to stop allocating. The basic case for diversifying across an allocation does not depend on identifying a winner in advance, which is precisely why it survives this problem.
Common questions about survivorship bias
Does survivorship bias apply to index funds? To the index’s historical return series, generally not — it chained through the companies that failed at the time they failed. To any list of current constituents measured backwards, absolutely yes.
How large is the effect in practice? It depends entirely on the disappearance rate and the performance gap, which is why the formula matters more than any single quoted figure. Somebody citing one universal number for it has not understood that it is a product of two variables.
Is this the same as cherry-picking? No, and the difference is worth keeping. Cherry-picking is a choice someone makes. Survivorship bias happens by default, with nobody choosing anything, which is what makes it more common and harder to spot.
Can I correct for it? Not precisely, without the missing data. You can do something better: stop treating filtered records as evidence about future returns, and build the plan on structure rather than on somebody’s track record. That is also the answer to most of the myths about dollar cost averaging.
Run this on the last track record you were shown
Find the most recent performance claim you took seriously — a fund comparison, a screenshot, a list of holdings that “would have” returned something. Apply the four questions. Starting population, when the list was chosen, what happened to the missing, who benefits from you seeing it.
Then do the arithmetic that costs you nothing: assume a 30% disappearance rate and a six-point gap, and knock 1.8 points off whatever you were shown. If the case still works at the lower number, it was probably a real case. If it only works at the advertised number, you were reading a sample of winners and calling it a category.
The point is not to distrust everything. It is to stop paying full price for numbers that were assembled by survival.
Educational content only — not financial advice.