
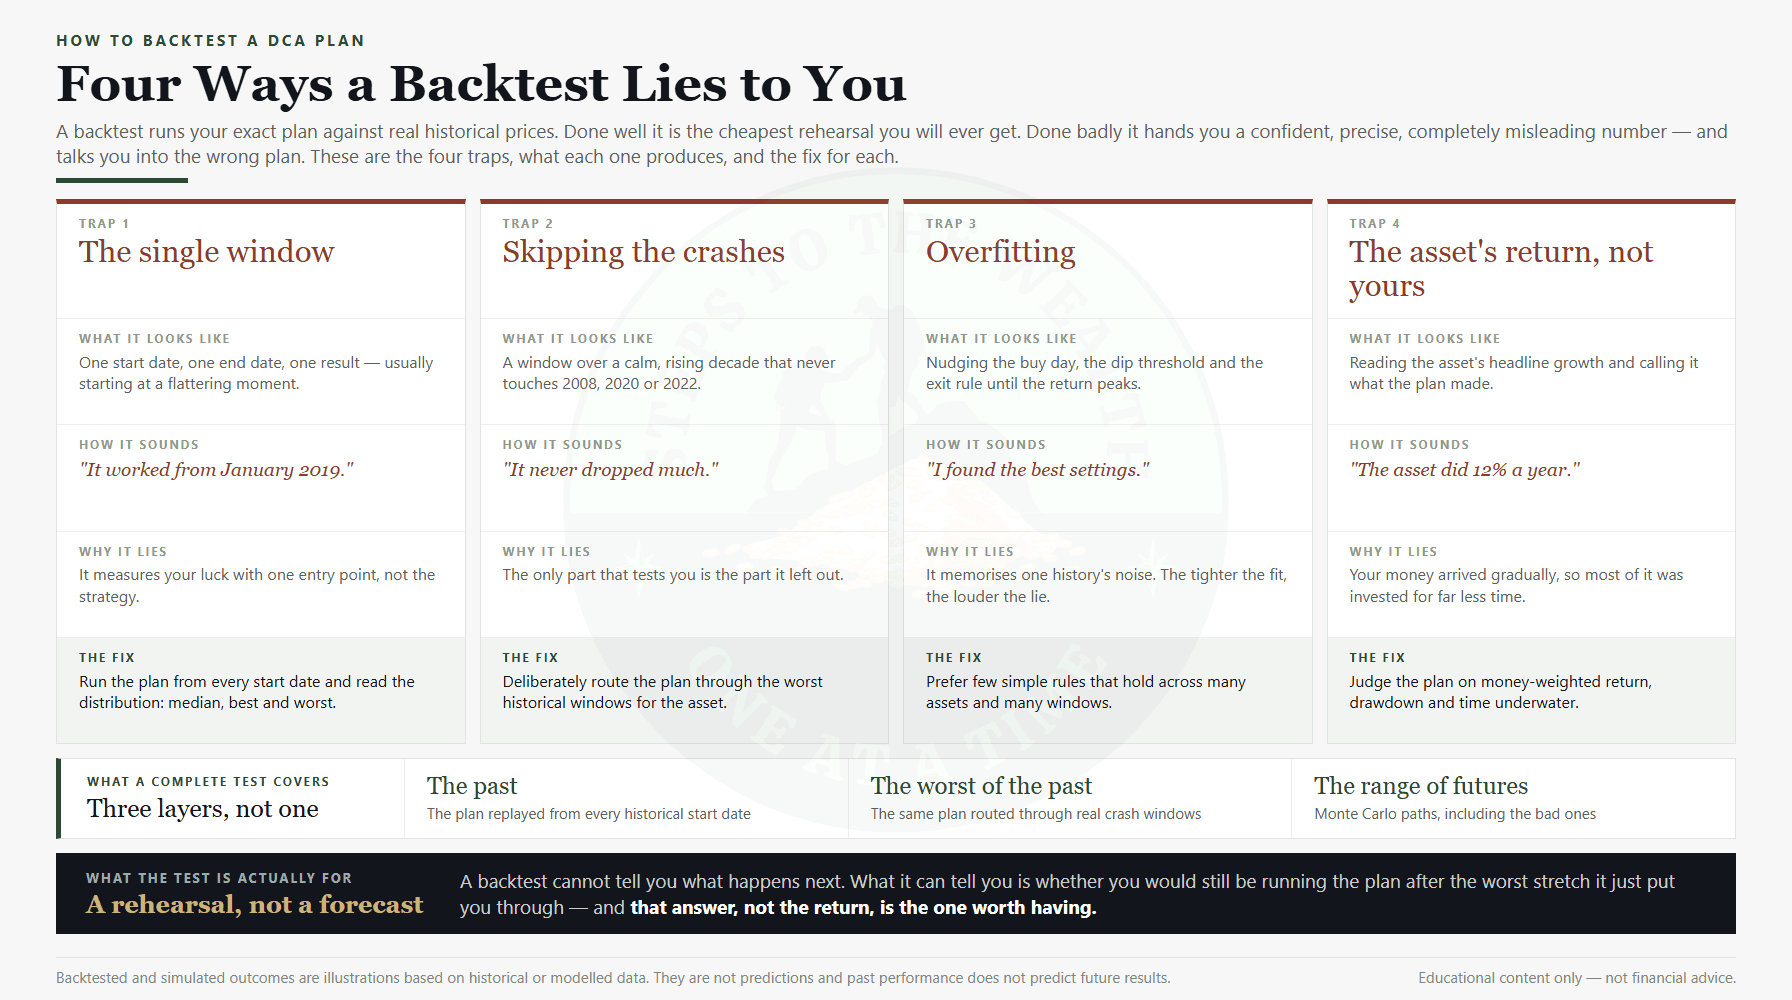
Before you commit real money to a strategy, it is worth knowing how that strategy would have behaved through history you have already lived through. Not because the past repeats — it does not — but because a plan that came apart in 2008, 2020 and 2022 will probably come apart in the next one too, and you would rather discover that with a spreadsheet than with your savings. That is what this article covers: how to backtest a DCA plan so that it teaches you something true, and the four traps that quietly make a backtest lie.
A backtest runs your exact plan against real historical prices. Done well, it is the cheapest rehearsal a working professional will ever get. Done badly — and most retail backtests are done badly — it produces a confident, precise, completely misleading number that talks you into the wrong plan and gives you the false certainty to stick with it right up until it hurts.
Educational content only. Not financial advice.
What a backtest can and cannot tell you
A backtest answers questions of a very particular shape. How would $500 a month into this asset have behaved from 2018 to 2024? How deep would the drawdown have gone? How many months would you have spent underwater? Did buying more on the dips actually help, or did it just feel better at the time? What was your money-weighted return, as opposed to the asset’s headline growth?
Those are real, useful answers, and most people never get them. A backtest is a flight simulator for your capital. You get to sit through a market crash, watch the plan bleed for eighteen months, and find out whether you would have kept contributing — without losing a cent finding out.
What a backtest cannot tell you is what happens next. It is not a prediction and it should never be read as one. The point is not to find the plan that would have made the most money in the past; that plan is always an illusion, shaped to one specific history that will not repeat. The point is to find a plan you could actually run through a range of futures without abandoning it halfway. Keep that distinction in front of you, because every trap below comes from forgetting it.
Trap 1: the single-window backtest
The most common mistake is testing a plan over exactly one time window — usually one that begins at a flattering moment — and treating the result as the truth about the strategy.
Start a Bitcoin DCA backtest in January 2019 and it looks like a miracle. Start the identical plan in November 2021 and it looks like a catastrophe; the 2021-22 crypto drawdown is exactly the window that separates the two. Same strategy, same asset, opposite conclusions, and the only thing that changed was the start date. If you run one window, you have not tested the strategy. You have measured your luck with one entry point.
The fix is to run the same plan from many different start dates and read the distribution of outcomes rather than a single number. What was the median result? What was the worst start date, and how bad was it? In how many of those windows did the plan still finish in profit? A strategy that works from the large majority of historical start points is telling you something structural. One that only works if you happened to begin near the bottom is a story you are telling yourself, and the backtest is helping you tell it.
Trap 2: the window that skips the crashes
A backtest run across a calm, rising decade tells you very little, because the part you actually need to test is whether you survive the bad part. A plan is not real until you have watched it go through a crash.
Any DCA plan looks capable in a bull market. The questions that matter are what it did in the 2008 financial crisis and the 2020 COVID crash — the moments that made real investors capitulate. How far down did it go? How many months was it underwater? Would the version of you watching that screen have kept contributing, or stopped “until things settle down” and missed the recovery that followed?
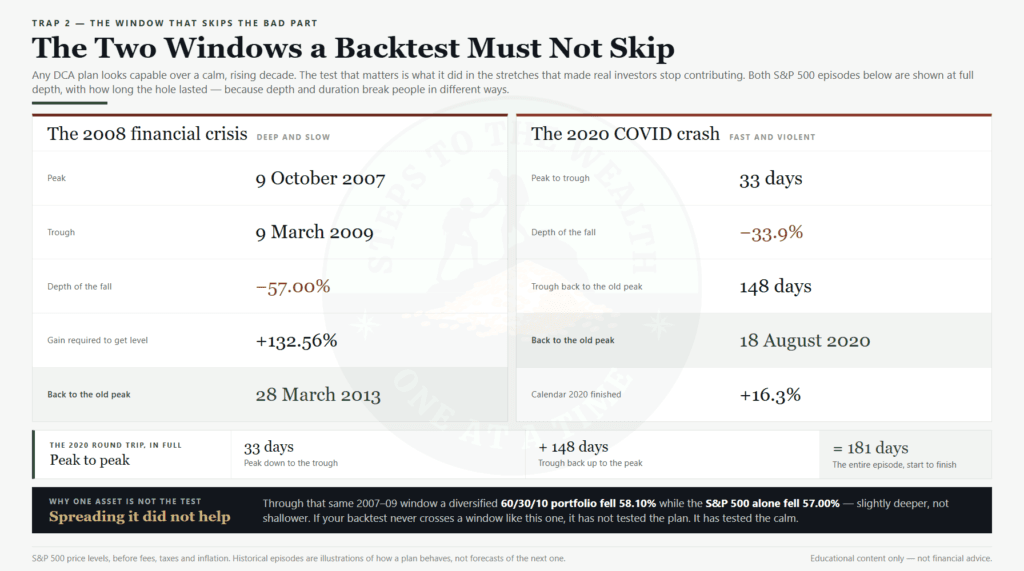
Those two episodes are worth studying together precisely because they break people in different ways. The 2008 crisis was deep and slow: a fall of 57.00% from the 9 October 2007 peak to the 9 March 2009 trough, requiring a gain of 132.56% just to get level again, which did not arrive until 28 March 2013. More than five years of being behind. The 2020 crash was the opposite shape — a 33.9% fall in 33 days, then 148 days back up, a round trip of 181 days, with the calendar year finishing up 16.3%. Depth breaks some people. Duration breaks more.
It is also worth noticing that spreading the money around did not rescue you in the first episode. Through that same 2007-09 window a diversified 60/30/10 portfolio fell 58.10%, slightly deeper than the S&P 500 alone at 57.00% — which is the uncomfortable finding behind the portfolio stress test. Correlations converge when it matters most, so “I am diversified” is not a substitute for having tested the plan through the window.
The fix is to route your plan deliberately through the worst historical periods for your asset, not merely the average ones. If a plan only survives calm markets, it is not a plan. It is a fair-weather habit that will break at exactly the moment discipline is worth something.
Trap 3: overfitting, or torturing the parameters
Give someone a backtester and a free afternoon and they will optimise. They will nudge the contribution day, the dip threshold, the rebalancing rule and the exit trigger, turning each knob until the historical return reaches its maximum, and they will feel they have done serious work.
What they have actually built is a plan shaped precisely to one specific past. It has memorised that history’s noise rather than learning its signal. The more parameters you tune to fit the data, the more confidently the backtest lies, and the worse the plan tends to perform going forward. This failure mode has a name — overfitting — and it is the single most dangerous thing a backtesting tool puts within reach.
The fix is to prefer simple, robust rules over finely-tuned ones. A plan built on two or three clear rules that performs decently across many assets and many windows will almost always beat a heavily optimised plan that performs spectacularly on exactly one. Here is the practical test: change one parameter slightly and re-run. If the result swings wildly, you have not found a strategy. You have found a coincidence, and you were about to bet real money on it.
Trap 4: mistaking the asset’s return for your return
This one is subtle, and it ruins conclusions quietly. People run a DCA backtest, read the asset’s headline growth rate, and assume that is what the plan earned. It is not — because the money went in gradually, so most of it was invested for far less time than the full window.
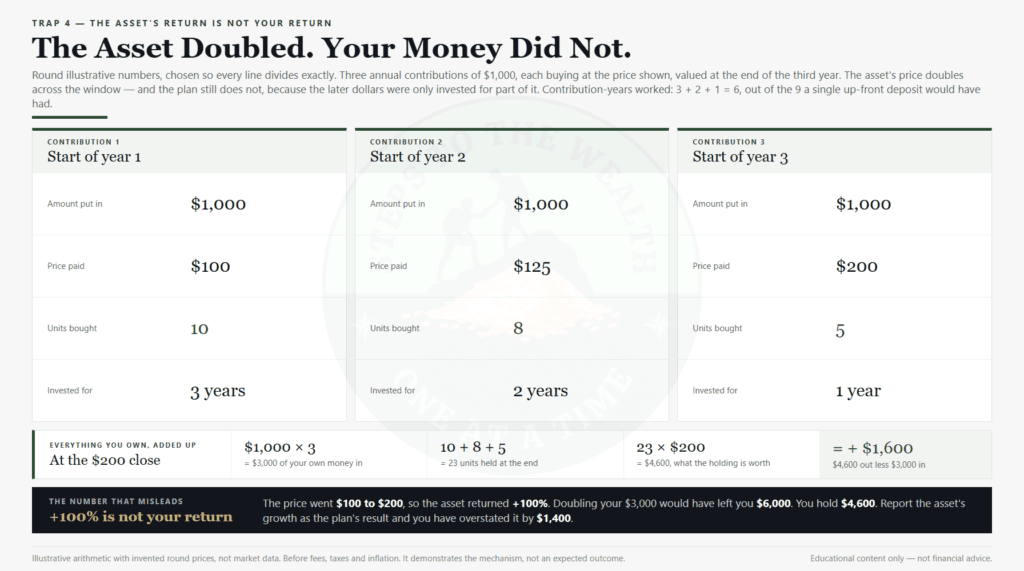
The arithmetic above uses invented round numbers so that every line divides exactly. Three annual contributions of $1,000 buy at $100, $125 and $200, which is 10, 8 and 5 units, or 23 units in total. Valued at $200 the holding is worth $4,600 against the $3,000 you put in, a gain of $1,600. Meanwhile the asset itself went from $100 to $200 — it doubled, a return of 100%. But doubling your $3,000 would have left you with $6,000, and you have $4,600. Quote the asset’s growth as the plan’s result and you have overstated it by $1,400 on a $3,000 plan.
The reason is visible in the contribution-years: the first $1,000 was invested for 3 years, the second for 2 and the third for 1, so the plan worked 3 + 2 + 1 = 6 contribution-years out of the 9 a single up-front deposit would have had. That gap is not a flaw in DCA — it is the mechanical consequence of contributing over time, and it is the same effect that sits underneath the lump-sum versus DCA comparison. It only becomes a problem when a backtest reports the asset’s number and lets you believe it was yours.
The honest measure of a DCA backtest is the money-weighted return, which accounts for when each contribution actually arrived. If your backtest reports only the asset’s growth, you do not yet know what the plan did. Judge it on money-weighted return, drawdown depth, and time underwater — and treat any tool that hides those as incomplete. Several of the more durable myths about dollar-cost averaging survive purely because this distinction gets skipped.
Trap 5: the index you are testing did not exist yet
Every backtest of a broad index runs on the constituents as they are known today. That list is the survivors. The companies that were delisted, acquired at a loss, or went to zero along the way are not on it — and an investor buying in at the start of your window had no way of knowing which names would still be there at the end of it.
For a well-constructed index fund this matters less than people assume, because the fund rebalances into and out of constituents in real time and its published returns already carry the failures. The trap bites hardest when you backtest a basket you assembled yourself — “the ten biggest tech companies,” “the top five coins” — because the list you would have written down at the start is not the list you can see now. Backtest today’s top five and you have tested a portfolio only a time traveller could have held.
The test is one question: could I have written down this exact set of holdings on the first day of the window, using only information available on that day? If the answer is no, the output is not a backtest. It is a description of what worked, which is a different and far less useful thing.
How much history is actually enough?
Ten years of monthly contributions gives you 120 data points, which sounds like a respectable sample and is not one. Those 120 contributions are not independent of each other. They sit inside the same rate environment, the same policy backdrop, the same decade. What you have is a sample size of one, measured 120 times.
The number that matters is not how many contributions the backtest made. It is how many full cycles the window covered — how many times the market went from expansion to drawdown to recovery while your plan was running. A twenty-year window spanning 2005 to 2024 contains two severe drawdowns and both recoveries. A ten-year window starting in 2013 contains neither: 120 contributions, zero cycles, and a result that tells you what your plan does in good conditions and nothing at all about what it does in the conditions you built it for.
So count cycles, not months. Two is the minimum for a plan you intend to run for decades, and three is better. Then be honest that even three is a small number — which is precisely why the next section exists. When the history you can test is thin, the answer is to stop trying to squeeze more confidence out of it and start testing the plan against futures it has never seen.
How to backtest a DCA plan against a range of futures
There is one more layer beyond replaying the past. History handed you exactly one path out of the many the world could have taken. Your plan will run into whichever path comes next, and some of those are worse than anything in the record.
This is what Monte Carlo analysis is for. Instead of one historical sequence, it generates hundreds of plausible forward paths from the asset’s behaviour and shows you the spread — the median outcome, the good cases, and crucially the bad ones, including the odds that the plan finishes below what you put in. It does not predict the future either. What it does is stop you over-trusting the single, lucky path that history happened to hand you.
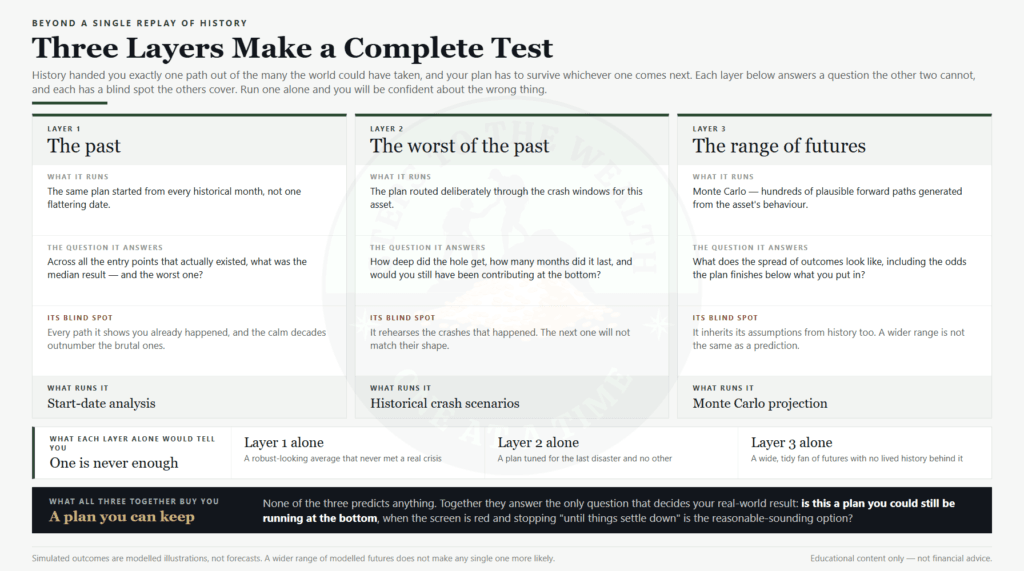
A complete picture is those three layers together: the past, the worst of the past, and the range of futures. Run only the first and you get a robust-looking average that never met a real crisis. Run only the second and you build a plan tuned for the last disaster and no other. Run only the third and you get a wide, tidy fan of futures with no lived history behind it. Each one covers a blind spot the other two have.
How to backtest a DCA plan without writing code
You can do all of this in a spreadsheet if you enjoy that sort of work. Pull the historical prices, build the contribution schedule, track the running cost basis, compute the money-weighted return, then repeat the whole thing for every start date you want to test. It works. It is also tedious, and a single formula error quietly poisons every conclusion downstream without ever announcing itself.
The alternative is a tool built for it. The DCA Simulator runs each piece without code: fixed DCA, value averaging and dynamic risk-based plans against real price history; a start-date analysis that replays the plan from every historical month and shows the distribution rather than one result (Trap 1); built-in historical crash scenarios (Trap 2); the money-weighted return reported next to the asset’s CAGR on every run (Trap 4); and Monte Carlo projections for the range of futures. The argument for it is not that it is easier, though it is. The argument is that it makes the right backtest the default one, so there are fewer opportunities to fool yourself.
A six-question checklist before you commit capital
Before real money goes in, your backtest should be able to answer all six of the questions below. The first three are about whether the result is real. The last three are about whether you are — and the second half is the one people skip, which is why so many well-tested plans get abandoned in month four of a drawdown.
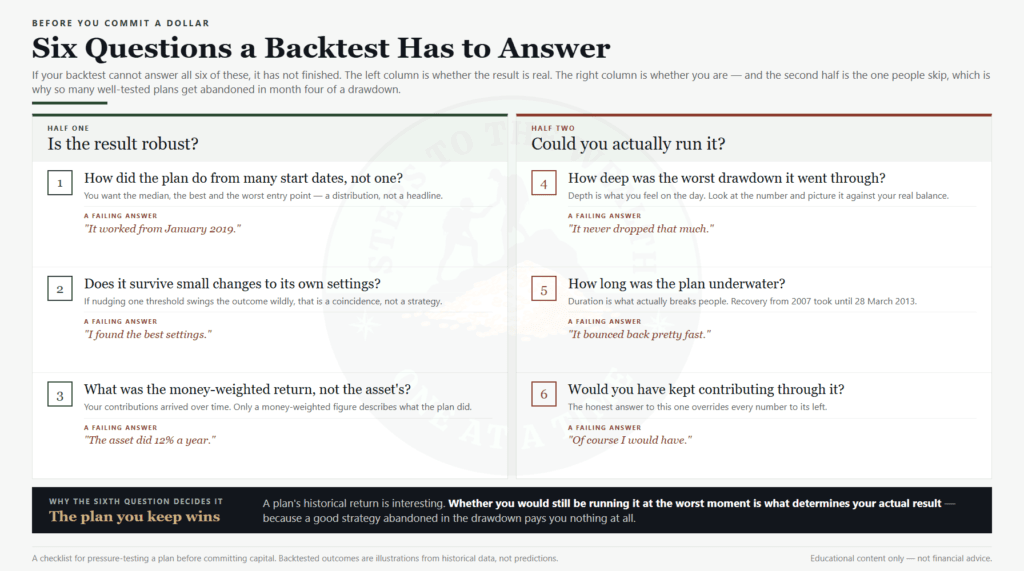
That final question is the entire reason to backtest. A plan’s historical return is interesting. Whether you would still have been running it at the worst moment is what actually determines your real-world result, because a good strategy abandoned in the drawdown pays you nothing at all. If the honest answer to question six is no, the right response is not to hunt for a better-looking backtest. It is to build a plan whose worst case you can live with — which is the whole point of starting from risk rather than from returns.
The takeaway
Backtesting is a flight simulator for an investing plan. It lets you feel a crash and find out whether the strategy — and your nerve — would have survived it, before any real money is exposed. But a careless backtest is worse than no backtest at all, because it hands you false confidence in a plan fitted to one lucky history, and false confidence is expensive.
Test across many start dates. Route it through the real crashes. Keep the rules simple enough that small changes do not overturn the result. Measure your money-weighted return rather than the asset’s. Add a forward-looking view so you are not over-trusting the one path history took. Do that and the backtest stops being a story you tell yourself and becomes what it should be: an honest rehearsal for a plan you can actually keep.
Run the right backtest
Open the DCA Simulator to test your plan across every historical start date, through real crash scenarios and against a range of possible futures — with the money-weighted return reported on every run.
If you want the deployment framework behind it on a single page, the Dynamic DCA Blueprint is free.
Related reads
- The Dollar-Cost Averaging Myths That Cost You Money
- DCA Into the S&P 500 Through the 2008 Financial Crisis
- How to Invest While Working Full Time
Educational content only — not financial advice. Backtested and simulated outcomes are pedagogical illustrations based on historical or modelled data; they are not predictions and not personalised recommendations. Past performance does not predict future results.