
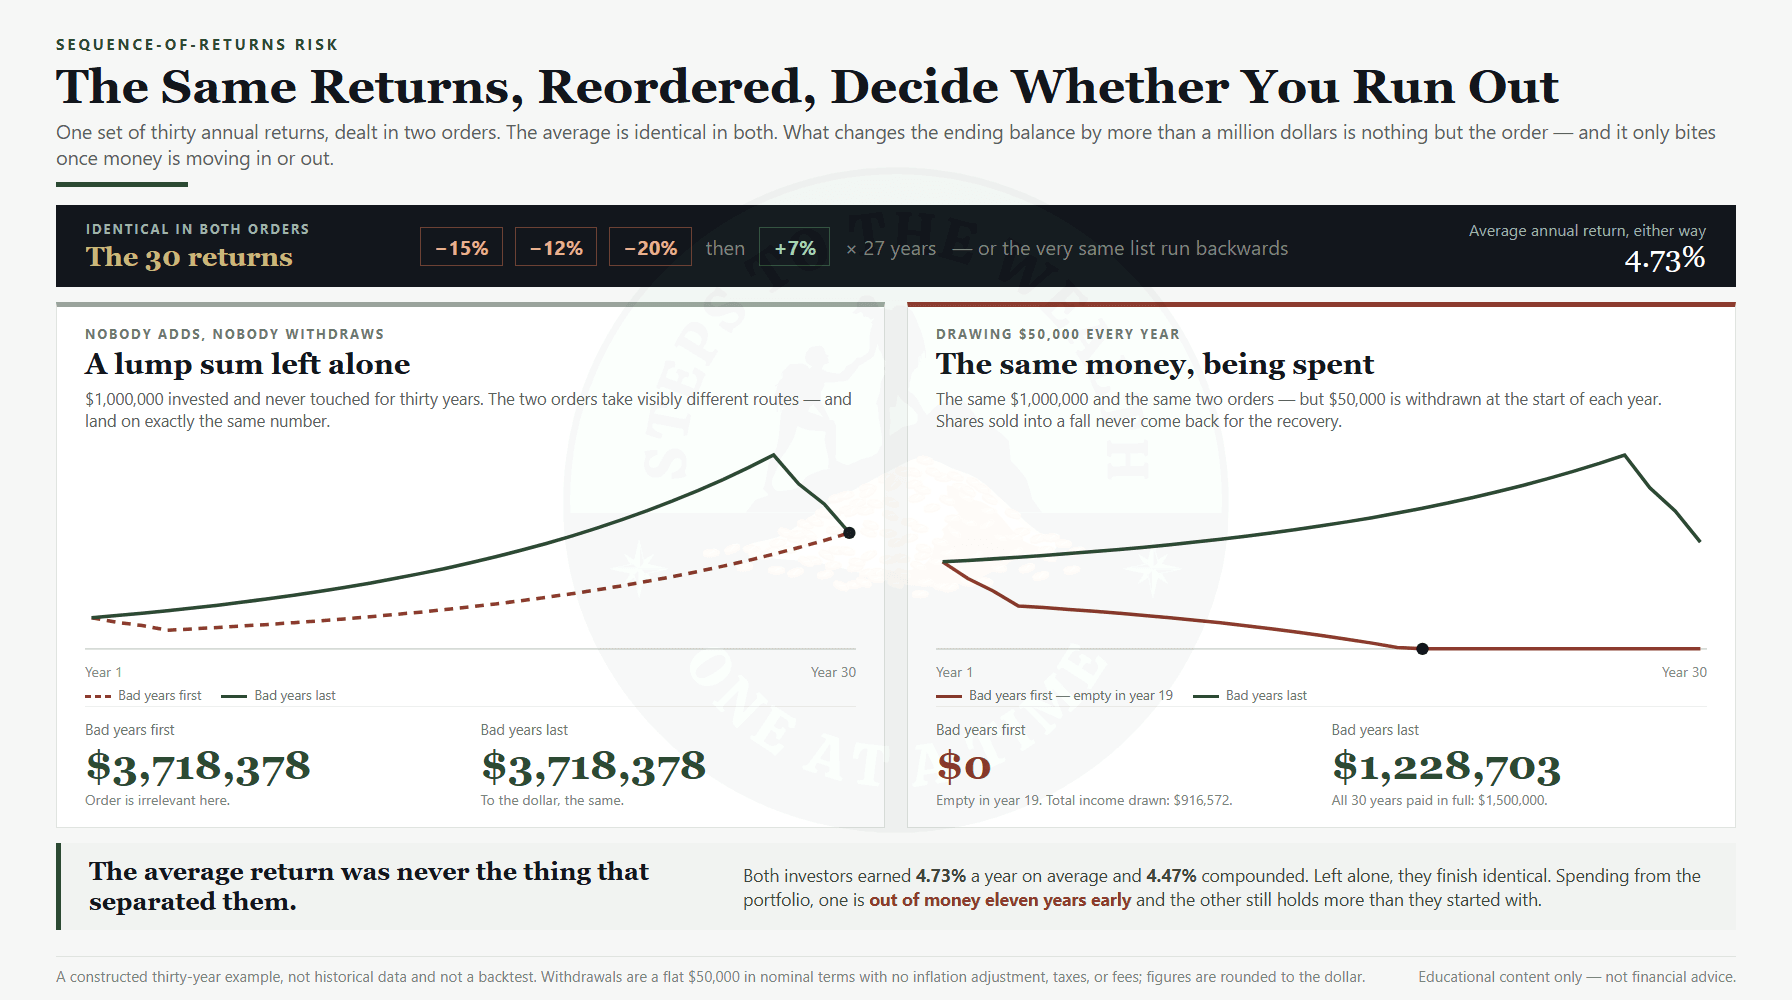
Two investors retire with the same portfolio, draw the same income, and live through the same thirty years of market returns. One dies wealthy. One runs out of money in year nineteen.
The difference between them is not how much the market returned on average. The average was identical — 4.73% a year, both of them. The difference is the order the returns arrived in.
This is sequence-of-returns risk, and it is the most important investing concept that almost no working professional has heard of. It does not show up in the “time in the market beats timing the market” slogans. It is invisible during the accumulation years when you are adding money. And then it becomes the single biggest threat to your plan in the years right around when you stop working.
Educational content only. Not financial advice.
The thing averages hide
Most people think about investing in terms of a single number: the average annual return. You hear “the market returns about 10% a year,” you plug it into a compounding calculator, and you get a clean exponential curve that lands you at a comfortable number decades from now.
That math is fine for one specific situation: a lump sum you never touch. Leave money alone for thirty years and only the average matters. Multiplication does not care what order it happens in — reorder the returns however you like and the answer does not move by a cent.
But almost nobody’s financial life looks like that. You are either adding money every month during your working years, or withdrawing money every month after you stop. The moment cash flows in or out of the portfolio, the order of returns stops washing out and starts mattering enormously.
The reason is simple once you see it. When you are withdrawing, a bad year early forces you to sell more shares to fund the same income, because each share is worth less. Those sold shares are gone — they cannot participate in the recovery when it comes. A bad year early permanently shrinks the base that the rest of your retirement compounds on. The same bad year late in retirement, after decades of good returns have grown the base, barely registers.
Same returns. Same average. Opposite outcomes. The order is the whole story.
A concrete picture
Here is the whole argument in one constructed example. Not a backtest, not a forecast — just arithmetic you can check.
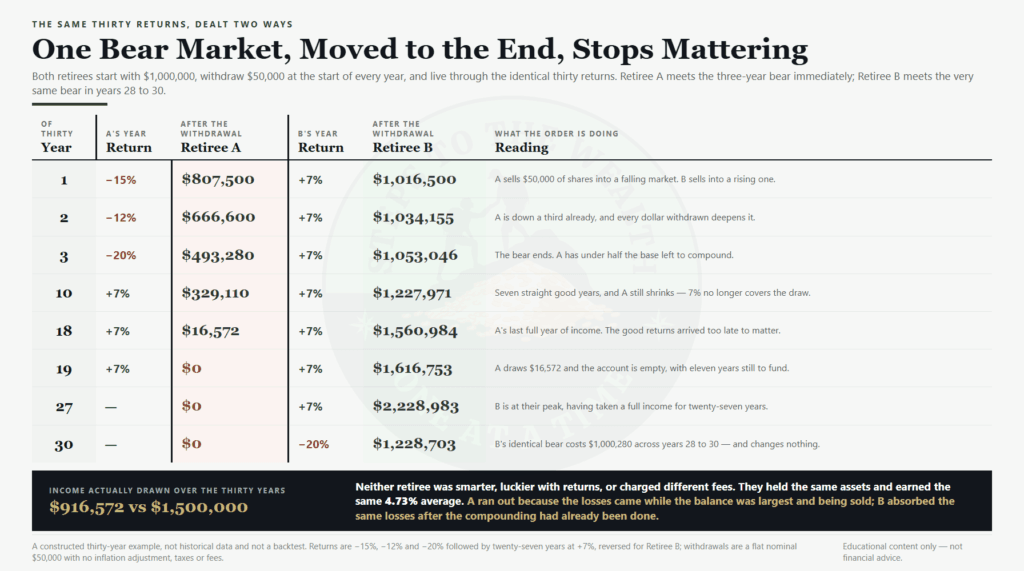
Take thirty annual returns: a three-year bear of −15%, −12% and −20%, followed by twenty-seven years at +7%. The arithmetic average is 4.73% a year. Compounded, it is 4.47%. Now deal that same list to two retirees in opposite orders. Retiree A meets the bear immediately. Retiree B meets the identical bear in years 28 to 30.
Both start with $1,000,000. Neither touches it.
Both finish with $3,718,378. To the dollar. That is the control, and it is worth sitting with — because it proves the order genuinely does not matter when nothing is moving in or out.
Now run it again, with $50,000 withdrawn at the start of every year.
Retiree A sells $50,000 of shares into a falling market three years running. After year one the balance is $807,500. After year three it is $493,280 — under half the starting base, with twenty-seven good years still ahead. Those good years arrive on schedule, and they are not enough. By year ten, after seven straight +7% years, A is still shrinking: $329,110. Year 18 is A’s last full withdrawal. In year 19 there is $16,572 left, A draws it, and the account is empty with eleven years still to fund.
Retiree B takes the same $50,000 out of a rising market instead. By year 27 the balance has grown to $2,228,983 — while paying a full income the entire time. Then the identical three-year bear lands. It costs B $1,000,280. And it changes nothing: B finishes year 30 with $1,228,703, more than they started with.
Total income actually drawn: $916,572 for A, $1,500,000 for B.
Neither retiree was smarter. Neither picked better assets or paid lower fees. They held the same thing and earned the same 4.73% average. A ran out because the losses came while the balance was largest and being sold into. B absorbed the same losses after the compounding had already been done.
That gap — produced entirely by sequence, not by skill, not by average — is sequence-of-returns risk.
The danger zone is a slope, not a switch
First-versus-last is the clearest way to see the mechanism, but it makes the risk look binary. It is not. Slide the identical three-year bear through the same thirty years — same $1,000,000, same $50,000 a year, the same returns in the same relative order — and the ending balance climbs steadily the later it lands.
Bear in years 1 to 3: the account is empty in year 19, and $916,572 of the intended $1,500,000 ever gets drawn. Years 8 to 10: full income paid all thirty years, finishing on $46,229 — funded, and by almost nothing. Years 14 to 16: $578,257 left. Years 21 to 23: $979,087. Years 28 to 30: $1,228,703.
Read the gap between the first two entries. Moving the same bear market seven years later is the difference between running out in year 19 and paying every year in full. Nothing else changed — not the average, not the assets, not the withdrawal.
That is what the danger zone actually is, and it is worth being precise about the phrase. It is not a birthday. It is roughly the first decade of withdrawals plus the few years before them, and inside that window the cost of a bad stretch falls off steeply with every year you get past. A bear in year 3 can end the plan. The same bear in year 15 is an expensive inconvenience.
Why this is a working professional’s problem, not just a retiree’s
It is easy to file this under “retirement planning” and move on. That is a mistake, and the arithmetic shows why.
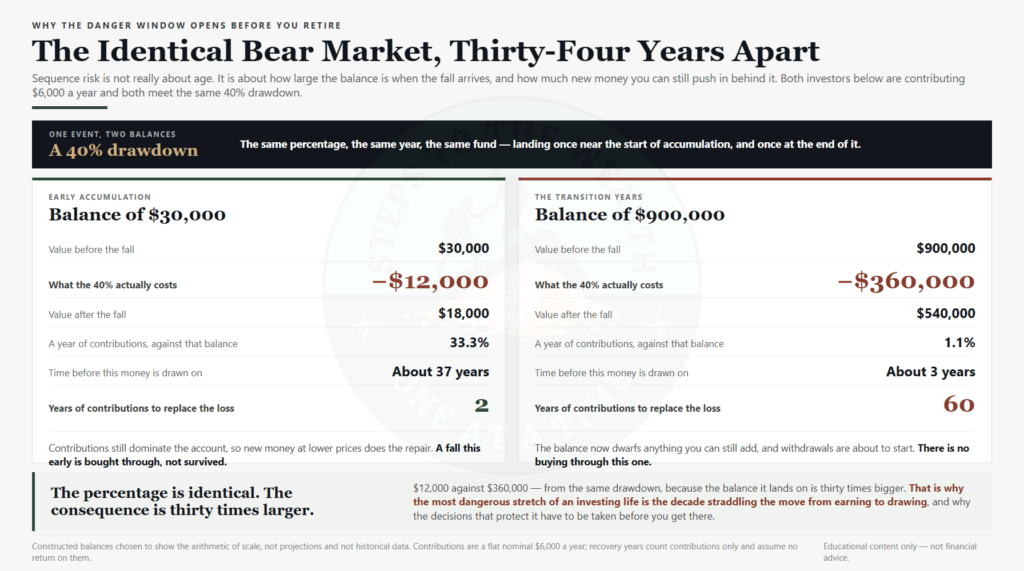
Sequence risk is not really about age. It is about how large the balance is when the fall arrives, and how much new money you can still push in behind it.
Take one 40% drawdown and drop it on two portfolios. On a $30,000 balance early in accumulation, it costs $12,000. On a $900,000 balance in the transition years, the same percentage costs $360,000. Thirty times the damage from an identical event.
Now look at what you can do about it in each case. Contributing $6,000 a year, the younger investor is adding 33.3% of their post-crash balance every year, and two years of contributions alone replace the entire loss — before any recovery in prices. The pre-retiree is adding 1.1%, and it would take sixty years of contributions to replace what the drawdown took. One of them has roughly thirty-seven years before this money is drawn on. The other has about three.
That is the difference between a fall you buy through and a fall you have to survive. A 40% bear market when you are 28 and investing steadily around a job is close to a gift — you are buying cheap for decades. The same 40% the year before you planned to stop working can end the plan.
There is a gentler version during accumulation too. If you are dollar-cost averaging through your working years, weak returns late in accumulation — right when your balance is largest and your remaining contributions are smallest relative to the pot — hurt more than weak returns early, when contributions still dominate. The order matters less during accumulation than during withdrawal, but it is not zero. The big-balance years are the sensitive ones in both phases.
So this is not a problem you can defer until your retirement party. The most dangerous decade of your investing life straddles the transition, and the decisions that protect you have to be made before you reach it. If you want to see what a real one did to a real portfolio, the 2008 DCA breakdown is a bad early sequence with the dates attached.
What the same sequence does while you are still accumulating
The retiree case is the dramatic one, but most readers here are decades away from it. So run the identical thirty returns with no starting balance, $12,000 contributed at the start of every year, and no withdrawals at all — $360,000 of contributions in total.
Bear first: $1,113,141. Bear last: $597,522. Same average, same contributions, $515,619 apart — and notice the direction has reversed. The accumulator wants the bear early. Those three bad years bought shares at −15%, −12% and −20% prices and then compounded them for twenty-seven years. The late bear lands when the balance is at its largest and only $12,000 of new money is arriving to fight it.
Two honest qualifications. Both of those are survivable outcomes — $597,522 on $360,000 contributed is a poor sequence, not a failed plan, where the withdrawal version was the difference between funded and empty. And the gap is this wide partly because the example starts from zero; the more you have already accumulated, the more the late-bear case starts to behave like the retiree’s.
The lever you actually hold is the obvious one. Stop contributing through the early bear — three years, the intuitive move — and the same investor finishes on $956,372 instead of $1,113,141. Skipping $36,000 of contributions cost $156,769. That is the accumulator’s version of a bad sequence, and unlike the market’s order, it is chosen.
What does not fix it
Before the framework, it is worth killing the false fixes, because the intuitive responses mostly make things worse.
“I will just earn a higher average return.” Reaching for higher returns usually means more volatility, which means deeper drawdowns, which is exactly what sequence risk punishes in the danger zone. A higher average with a worse sequence can lose to a lower average with a smoother one. Chasing return is not the same as managing sequence.
“I will time it — go to cash before the crash.” You have to be right twice, and the evidence says retail investors are not. Sitting in cash waiting for a crash that does not come has its own bill, and the cost of waiting is larger than most people estimate.
“I will hold more bonds and never think about it again.” A static conservative allocation does reduce sequence risk, and asset allocation and diversification are genuinely the right vocabulary for the problem. But a fixed 60/40 does not know whether risk is currently high or low. It hedges the same amount on the day before a crash and the day after one, which is precisely backwards.
The thing that actually addresses sequence risk is adjusting how much risk you carry based on how much risk is actually present — and doing it mechanically, so it happens whether or not you feel brave.
What lowering exposure actually buys
Here is where most articles would tell you the framework solves it. It does not, and the numbers are worth being honest about.
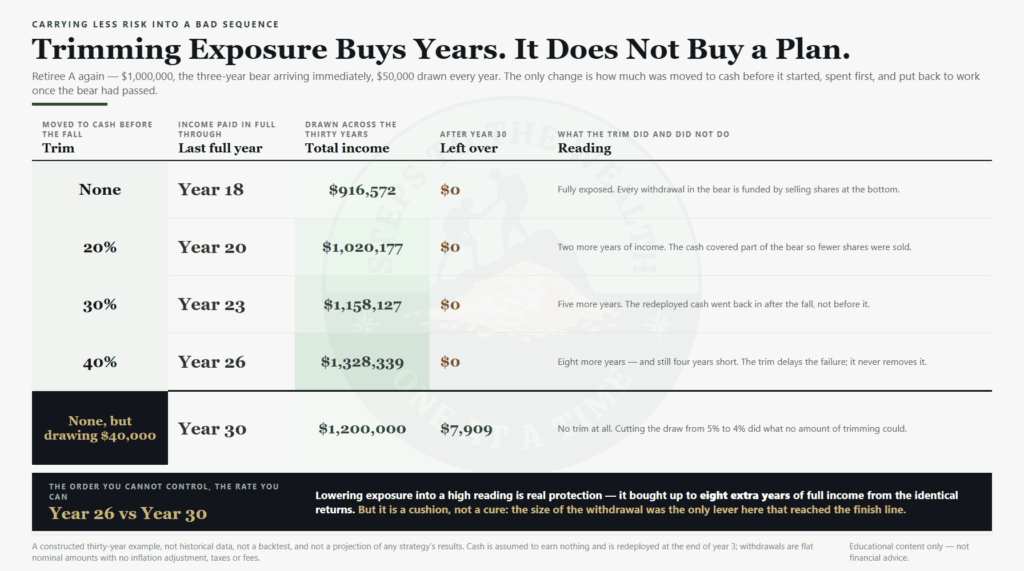
Run Retiree A again — the same $1,000,000, the same bear landing immediately, the same $50,000 a year. The only change is how much was moved to cash before it started, spent first, and put back to work once the bear had passed. That is the mechanic a risk-first framework is built on: trim into a high reading, fund the early withdrawals from the trimmed cash instead of selling equities into the fall, redeploy when the reading comes back down.
Fully exposed, A’s income is paid in full through year 18. Trim 20% and it reaches year 20. Trim 30% and it reaches year 23. Trim 40% and it reaches year 26 — eight extra years of full income out of the identical returns, and $411,767 more drawn across the thirty years.
All four of them still end at zero.
Eight years is real protection and I am not going to talk it down. Carrying less exposure into a high reading is the single most useful thing the framework does for a portfolio approaching the transition, and it does it without predicting anything. But it is a cushion, not a cure. Trimming delayed the failure every single time. It never removed it.
What removed it was the withdrawal. Take the same portfolio, apply no trim at all, and draw $40,000 a year instead of $50,000 — 4% instead of 5% — and all thirty years get paid, with money left at the end.
That is the uncomfortable ranking, and you should hear it from someone who is not selling you a system: the size of your withdrawal is a bigger lever on sequence risk than your exposure management is. Exposure management is the lever you pull when the withdrawal is already set and you cannot move it. Both are worth having. Only one of them reached the finish line here.
The practical playbook around the transition
Translate that into what you actually do as you approach the danger zone.
Size the withdrawal first. It is the lever with the most reach and the one people examine last. Before optimising anything else, find out what rate your plan actually requires and whether it survives a bad opening decade. Retirement targets by age is the place to start if you have never put a number on it; the DCA simulator will let you run the drawdown itself.
Build the reserve, but know what it is for. One to three years of planned withdrawals in cash and short-term holdings, funded before you reach the transition. Its job is narrow and specific: make sure an early bad stretch never forces you to sell equities at the bottom to eat. You spend it in the bad years and refill it in the good ones. It is not a cure either — the arithmetic above shows a reserve carved out of the same pot buys you a year, not a plan — but it is what converts a forced sale into a choice.
Let the readings, not the calendar, govern how hard you de-risk. If you reach your target date and risk is reading low, there is less reason to slash exposure. If you reach it and risk is reading high, that is when the trim earns its keep. A portfolio stress test run before you get there will tell you what a bad opening would actually cost you in dollars, which is more useful than knowing it in percent.
Keep contributing and deploying through drawdowns while you are still accumulating. The instinct to stop investing when markets fall is the accumulator’s version of locking in a bad sequence. A bad early sequence is only a gift if you keep buying through it.
And reframe what you are optimising for. The goal in the danger zone is not to maximise the average — it is to survive the sequence.
What this is not
This is not a claim that any framework predicts bad sequences. It cannot, and any system that says it can is selling something. The framework manages exposure to current risk. It does not forecast the order of future returns, and as the numbers above show, it does not make a 5% withdrawal into a brutal opening decade survivable.
It is also not an argument for hiding in cash as you approach retirement. The reserve is one to three years of withdrawals, not the whole portfolio. A 60-year-old today might have a thirty-year horizon — far too long to abandon growth. Over-correcting for sequence risk trades one failure mode, running out from a bad order, for another: running out from inflation and inadequate growth.
Every number in this article comes from one constructed thirty-year sequence, chosen because it makes the mechanism visible. A different sequence produces different years. The mechanism is what transfers; the specific figures do not.
And it is not personalised advice. Your danger-zone timing, your reserve size, and your appropriate de-risking path depend on your horizon, your income needs, your other assets, and your risk capacity — not on a generic rule.
Closing
The average return is the number everyone quotes. The sequence is the number that decides whether the plan survives. For a lump sum left alone, only the average matters — the two orders finished at the identical $3,718,378. For anyone adding or withdrawing money, which is everyone, the order matters too, and it matters most in the decade straddling the move from earning to drawing.
You cannot choose your sequence. The market deals the order. What you can choose is how much you are withdrawing, how much risk you carry into the danger zone, and whether you have a buffer that keeps an early bad stretch from forcing a sale at the bottom.
That is the whole defence. A withdrawal the plan can actually support, exposure sized to current risk, a reserve sized to your income, and the discipline to keep buying when the sequence is ugly and you still have time. Boring, mechanical, and considerably more reliable than hoping the market deals you a kind order.
The market decides the sequence. You decide how exposed you are when it does.
Educational content only. Not financial advice. Sequence-of-returns risk, appropriate reserves, and de-risking decisions depend heavily on individual circumstances, time horizon, and income needs. Work with a qualified financial professional to apply these frameworks to your specific situation.
If you want the risk-first framework itself, Steps To The Wealth Weekly is where it gets built out one piece at a time.