

The stages of wealth building are not motivational tiers. They are three arithmetically different situations, and the reason advice contradicts itself so often is that most of it is written for one of them without saying which.
Here is the whole distinction in one sentence: at $10,000, you are the engine; at $1,000,000, the portfolio is, and you are a contributor. Nothing about the person changes in between. What changes is where the growth comes from, and it changes by enough that the correct answer to “what should I focus on” inverts.
This article puts numbers on that, because the numbers are what make it a framework rather than a slogan. Throughout, the assumption is the one used across this site: 7% after inflation, with contributions of $1,000 a month that rise with prices, so the real rate is the right one to compound at.
Educational content only. Not financial advice.
The three stages of wealth building, in one number each
Take one person contributing $12,000 a year into a portfolio returning 7% after inflation, and ask a single question at each balance: what share of this year’s growth came from the market rather than from them?
At $10,000, the portfolio returns $700 while they add $12,000. Returns are 5.51% of the year’s growth. The market is, quite literally, a rounding error next to their next raise.
At $100,000, the portfolio returns $7,000 against the same $12,000. Returns are now 36.84% — more than a third of the progress, produced by something they cannot influence at all.
At $1,000,000, the portfolio returns $70,000 against that same $12,000. Returns are 85.37%. The contribution that was the whole story at stage one is now the rounding error.
Nothing in that sequence required a better investor. It required a bigger balance. And it means that the same piece of advice — “focus on your savings rate”, “optimise your allocation” — is correct at one stage and a waste of attention at another.
The crossover is a division, not a milestone
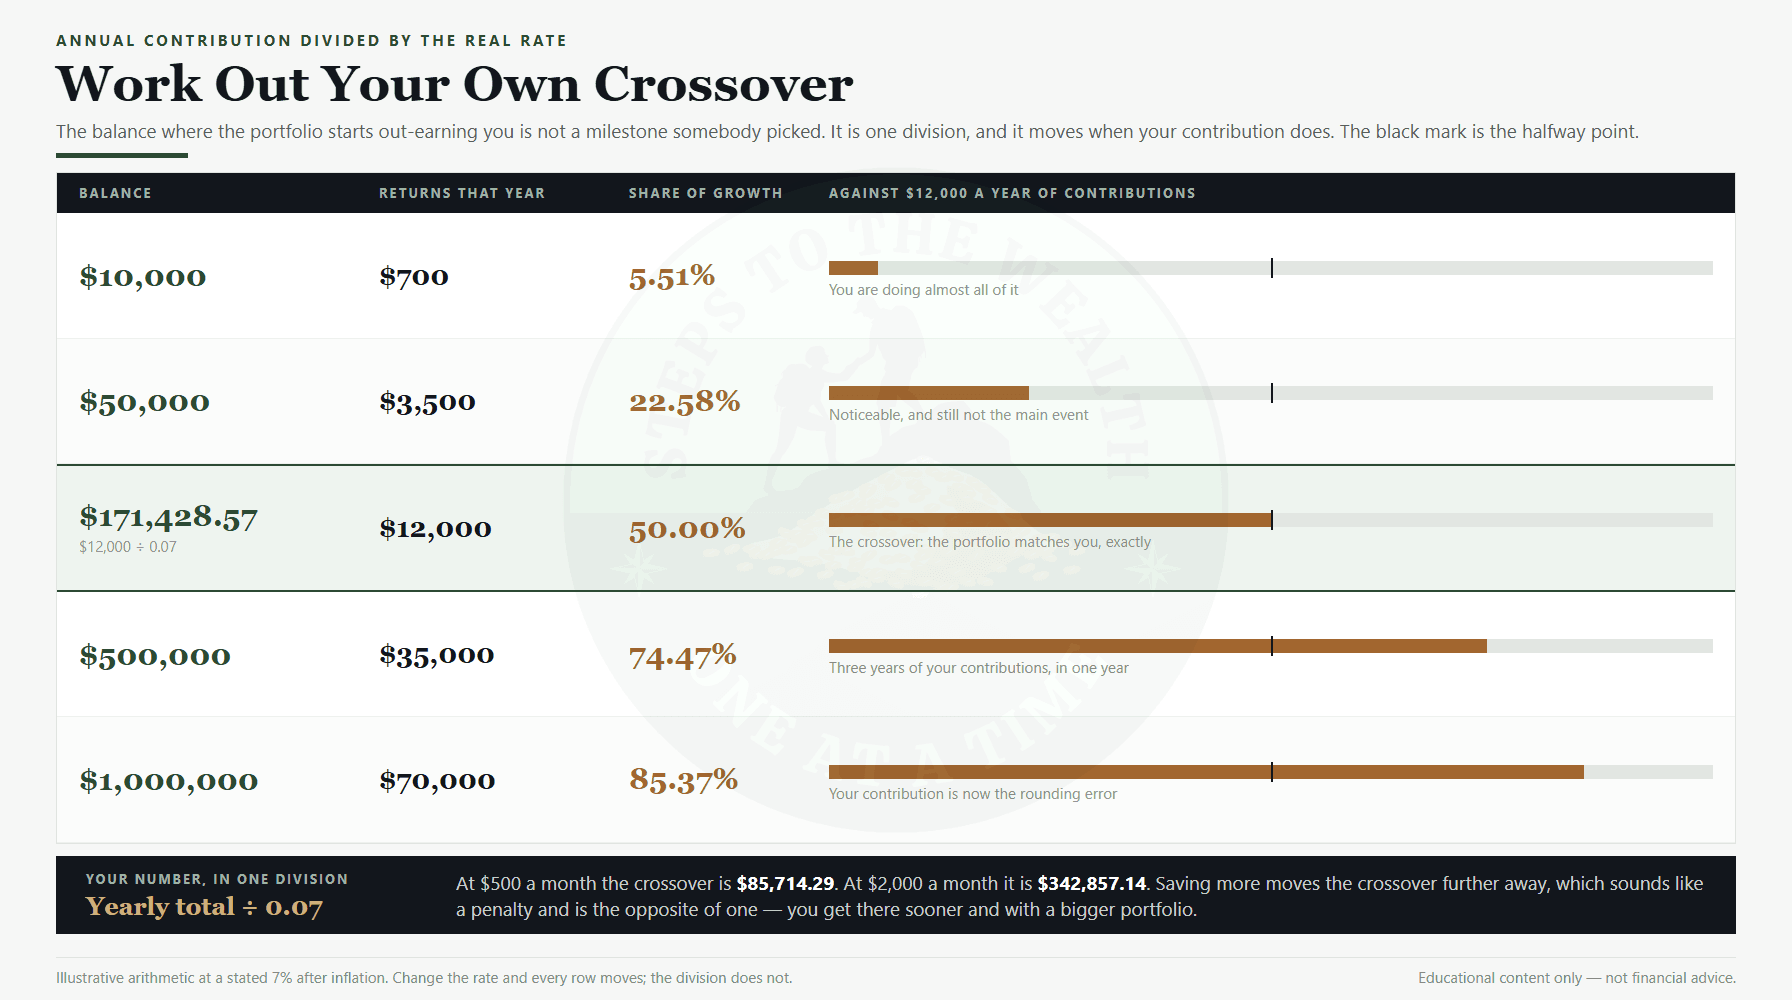
Somewhere between those balances is the point where the portfolio’s return equals your annual contribution. On these assumptions it is $171,428.57, which is simply $12,000 divided by 0.07.
That is worth knowing because it is yours to compute rather than a number somebody chose for a headline. Divide your annual contribution by your assumed real rate. At $500 a month the crossover is $85,714.29. At $2,000 a month it is $342,857.14.
Notice what that implies. Saving more pushes the crossover further away, which sounds like a penalty and is the opposite of one: you reach a larger crossover sooner, and everything after it is bigger. The crossover is a description of proportions, not a finish line, and treating it as a target would be a mistake.
Below it, your behaviour is the dominant variable in your own outcome. Above it, market conditions are, and no amount of additional effort changes that. The transition is gradual and nothing announces it, which is exactly why it is worth calculating.
Why the second leg is nine times the money and only three times the wait
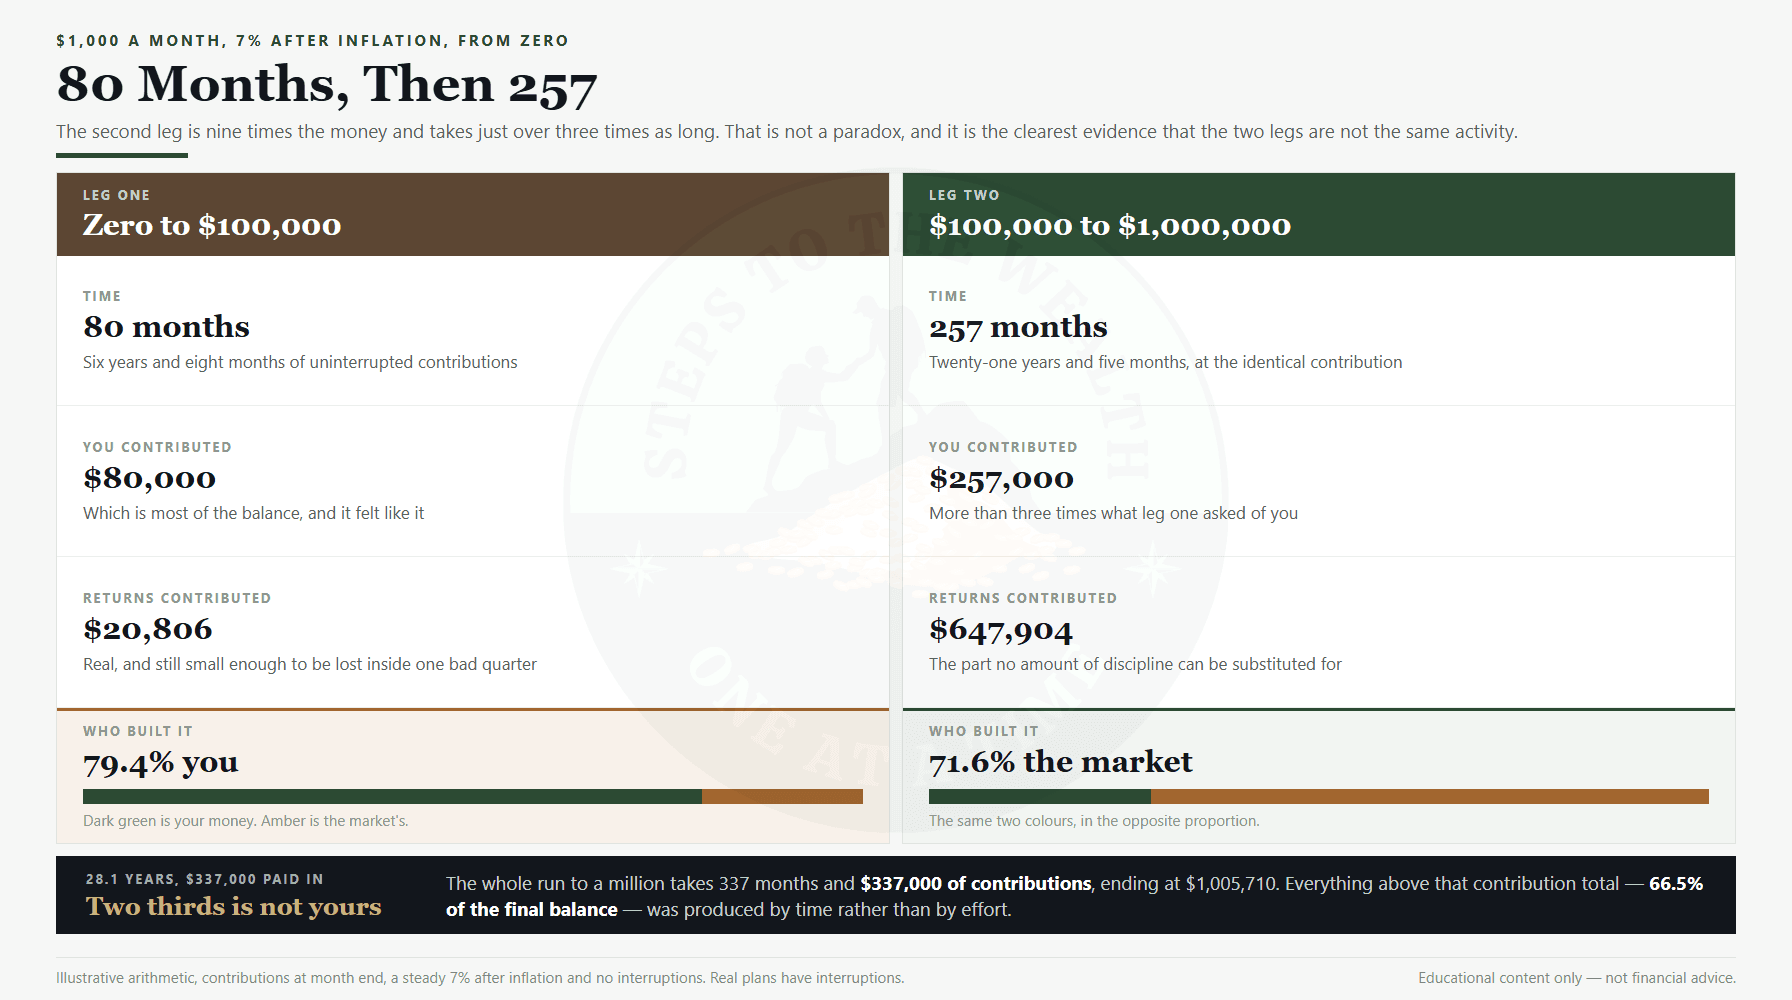
Run the same plan from zero and the shape of the two legs is not what most people expect.
Zero to $100,000 takes 80 months — six years and eight months. You contributed $80,000 of it. Returns added $20,806. Just under 80% of that first balance is your own money, which is precisely why the first stretch feels like pure effort: it is.
$100,000 to $1,000,000 takes 257 months — twenty-one years and five months at the identical contribution. You contributed $257,000. Returns added $647,904. 71.6% of that second leg was not your money.
So the second leg is nine times the money for a little over three times the wait. That is not a paradox and it is not a reward for skill. It is what happens when the balance itself becomes the largest contributor, and it is the strongest argument available for not interrupting the plan in the middle.
Across the whole run: 337 months, $337,000 contributed, ending at $1,005,710. Two thirds of the final balance — 66.5% — was produced by time rather than by effort. You cannot work harder to get that portion. You can only fail to be there for it.
What each stage is actually asking you to do
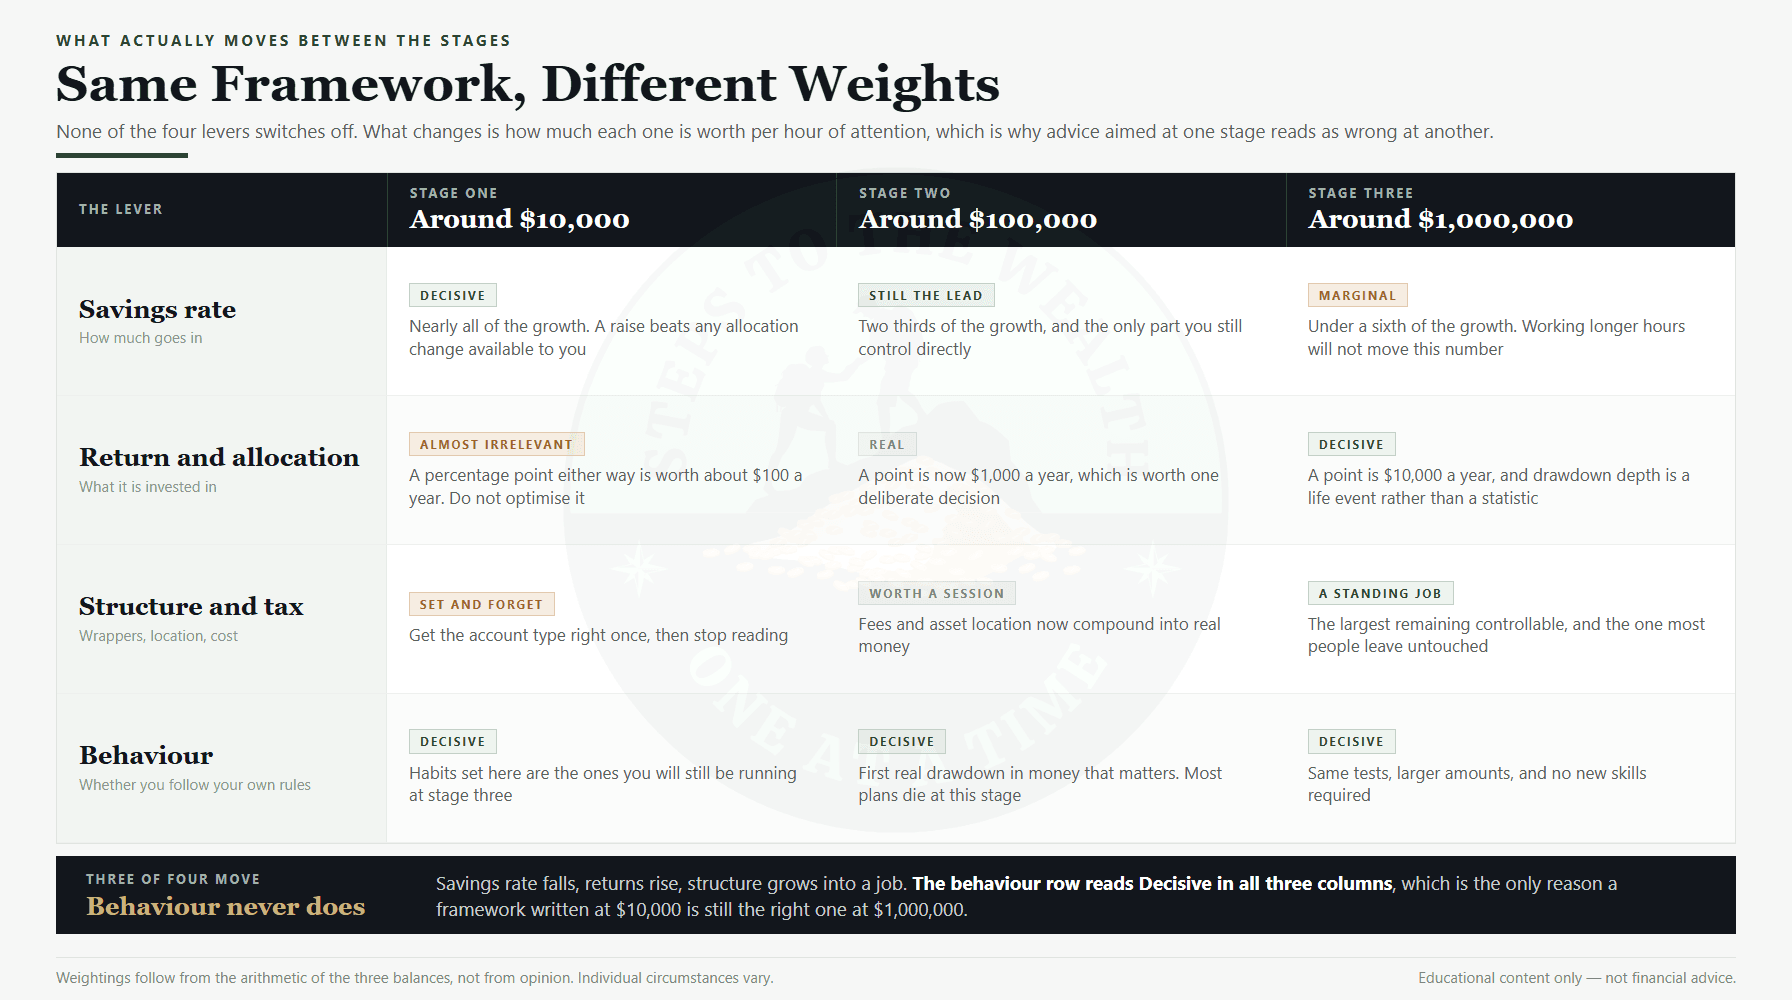
Stage one, around $10,000: the income stage. Nearly all growth is your contribution, so the highest-value hours go into earning and saving more, not into the portfolio. A percentage point of return either way is worth about $100 a year here. An extra $200 a month is worth $2,400. The arithmetic is not close, which is why what happens to your savings rate as income rises matters more at this stage than any allocation question.
The trap is spending stage one optimising things that belong to stage three. Reading about tax-loss harvesting on a $10,000 balance is a hobby, not a strategy.
Stage two, around $100,000: the not-falling-off stage. Two thirds of the growth is still yours, but the market is now a real participant, which means this is where the first genuinely painful drawdown happens in money that matters. A 30% fall at $10,000 is $3,000 and an annoyance. At $100,000 it is $30,000 and a test.
There is a second, quieter risk at this stage: the balance is now large enough to feel like it should be doing something impressive, and it is not. At $100,000 a good year adds $7,000 of return — real money, and nowhere near the numbers that circulate online. The gap between what the balance produces and what people expect it to produce is at its widest here, and that gap is what makes stage two feel like failure while the arithmetic says it is working exactly as designed.
Most plans die here, and they die from abandonment rather than from arithmetic. This is the stage where having rules written down in advance stops being theoretical, and where surviving a full market cycle changes an investor permanently.
Stage three, around $1,000,000: the structure stage. Your contribution is under a sixth of the growth. Working longer hours will not move the number. What will move it is the things that scale with the balance: fees, asset location, drawdown depth, and how much risk the structure is actually carrying — which is what a stress test and an annual structural audit exist to check.
And one row never changes. Behaviour reads decisive at every stage, which is the only reason a framework written at $10,000 is still the right framework at $1,000,000.
The one lever that never changes weight
Three of the four levers move as the balance grows. Behaviour does not, and it is the only one whose cost has been measured directly rather than modelled.
Barber and Odean tracked 66,465 US households at a large discount broker between 1991 and 1996. Over that period the market returned 17.9% a year. The average household earned 16.4%. The fifth of households that traded most earned 11.4% — 6.5 percentage points a year behind the market, and none of that gap was attributed to picking worse companies. It came from acting more often. The original paper is free to read.
Now price that gap at each stage, because this is where the framework stops being abstract:
- At $10,000, 6.5 points is $650 a year — roughly one month of contributions, and easy to shrug off.
- At $100,000, it is $6,500 a year — more than half of everything you contribute in a year, given away through activity.
- At $1,000,000, it is $65,000 a year, which is more than five times the annual contribution. No savings rate available to you closes a gap that size.
That is why the behaviour row reads decisive in every column while the others move. The habit costs the same 6.5 points at every balance; the bill grows with the portfolio. And the habits that produce it are formed at stage one, when they are cheap enough to be invisible — which is the argument for taking them seriously long before they are expensive.
It also explains an uncomfortable asymmetry. Effort at stage one earns you a bigger balance. Bad behaviour at stage three destroys more than effort at stage one could ever have built. Knowing which failure mode you personally lean toward is worth more than another percentage point of return, and Morningstar’s four behavioural investor types is a reasonable map of the usual ones. How much risk belongs in the portfolio at all is a separate question, and the regulator’s plain guide to asset allocation is a better starting point than anything written for engagement.
The advice that contradicts itself, explained
This is why financial content feels so inconsistent. “Your savings rate is everything” and “you cannot save your way to wealth” are both true statements about different balances. So are “don’t obsess over fees” and “fees are the biggest controllable cost you have”.
Almost none of it says which stage it is for. The reader picks up whichever version reached them first, applies it at the wrong balance, and concludes the whole field is noise.
A useful filter: ask what balance the advice assumes. If someone recommends spending a weekend optimising an allocation, that advice is worth roughly $100 a year at $10,000 and roughly $10,000 a year at $1,000,000. Same advice, two orders of magnitude apart in value, and the difference is not their expertise — it is your balance.
The same filter applies to how much time the whole thing should take. A plan that fits around a full-time job is the only kind that survives to stage three, and the routine that gets it there is deliberately small — the sort of year in which almost nothing happens.
What the stages look like if you start late
The three stages are a sequence, not a calendar, and the most common real-world question is what happens when the sequence starts later than you would have liked.
On the same $1,000 a month, the crossover arrives at month 121 — just over ten years in — and the million at month 337. Start at 25 and that lands at 53. Start at 35 and it lands at 63. Start at 45 and it lands at 73, which for most people is not a plan at all.
The lever that fixes it is the contribution, and the cost of delay is visible in what it has to become:
- 30 years to work with: $855 a month reaches $1,000,000.
- 25 years: $1,277 a month — about 49% more than the 30-year figure.
- 20 years: $1,970 a month.
- 15 years: $3,214 a month, which is nearly four times the 30-year contribution for half the time.
That curve is steep for a reason that follows directly from everything above. A late start does not simply compress the timeline; it removes the second leg, the one where returns supplied 71.6% of the growth. Take away the years in which the portfolio does most of the work and the only remaining source of the money is you, which is why the required contribution rises so much faster than the time falls.
The practical consequence is not despair, it is sequencing. A late starter is buying stage one and stage two in the same decade, so the stage-one levers — income, savings rate, and the gap between them — carry far more of the outcome than they would for someone with thirty years. Optimising a portfolio is a poor substitute for closing that gap, and the arithmetic above is the reason.
It is also worth saying plainly: none of those monthly figures is achievable for everyone, and a target that cannot be funded is not made more achievable by a better allocation. Where the number genuinely does not work, the honest move is to change the target, the horizon or the plan, rather than to take more risk in the hope that the market closes the gap for you.
The stage that is missing from this article
There is an honest gap in the three-stage framing, and it is worth naming rather than hiding.
Everything above assumes you are accumulating. It says nothing about drawing down, which is a fourth situation with its own arithmetic, and where the order of returns starts to matter in a way it never did while you were buying — the subject of sequence of returns risk. Do not carry accumulation instincts into a withdrawal phase.
It also assumes the contribution keeps pace with prices. If it does not — if it is a fixed dollar amount set once and never revisited — then the real rate is the wrong rate to compound at, and the projection will flatter you. That distinction is worth understanding properly, because it is the most common modelling error in this whole area: see inflation against nominal returns.
What this framework will not tell you
It will not tell you the timeline is real. 337 months assumes an uninterrupted contribution and a steady 7% after inflation. Neither exists. Careers stall, contributions pause, and returns arrive in an order nobody chose. The arithmetic is a shape, not a schedule.
It will not tell you $1,000,000 is the right target. That number is here because it is the one people name, not because it means anything in particular. What it buys depends entirely on where and how you live.
It will not tell you your stage from your balance alone. A $100,000 balance with a $50,000 annual contribution is behaviourally still stage one — the crossover formula puts it at $714,285.71. Someone at $100,000 who has stopped contributing entirely is already living in stage three. The balance is a proxy; the ratio is the actual measure.
And it will not do the boring part for you. The framework describes what changes. It cannot supply twenty-eight years of not interrupting the plan, which is the only input none of this arithmetic can replace.
Two questions sit just outside this arithmetic: how long each doubling actually takes, and whether the target is retirement at all or optionality.
Frequently asked questions
Is the first $100,000 really the hardest?
By the arithmetic here, yes, in a specific sense: about 80% of it is money you personally put in, against under 30% for the next $900,000. It is the stretch where effort and result are most tightly coupled, and where you get the least help. It is not the longest stretch — that is the second leg — but it is the one you build almost single-handedly.
How do I know which stage I am in?
Divide your annual contribution by your assumed real rate. Below that balance you are in the contribution-dominated stage; above it the portfolio is doing most of the work. At $12,000 a year and 7% real that line sits at $171,428.57, and it moves whenever your contribution does.
Should I change my strategy at each stage?
No. Change your attention, not your strategy. The same rules-based approach runs at every balance; what changes is which lever is worth an hour of your time. Rewriting the strategy at each stage is how people end up with three half-finished systems and no track record in any of them.
Does a bigger contribution get me to $1,000,000 faster?
Yes, and mostly by shortening the first leg, which is the part contributions actually dominate. It has much less effect on the second leg, where returns supply 71.6% of the growth. That is the honest shape of it: effort compresses the early years far more than the later ones.
What if my returns are lower than 7% after inflation?
Every number moves and the structure does not. A lower real rate pushes the crossover higher, lengthens both legs, and increases the share of the final balance that came from your contributions rather than the market. The stages still exist; they just arrive later.
One thing worth doing this week
Work out your own crossover: annual contribution divided by your assumed real rate. It takes ten seconds and it tells you which of the three stages of wealth building you are actually in, which is more than most financial content will tell you about itself.
Then act on the answer. If you are below it, the highest-value hours are on income and savings rate, and the portfolio can be dull on purpose. If you are above it, the highest-value hours are on structure, risk and not interrupting anything — and the gap between where your plan lands and where you need it to is worth checking directly with the plan gap calculator rather than estimating.
If you want the weekly reading and the reasoning behind it, that is what the newsletter is for.
Educational content only. Not financial advice. All figures are illustrative arithmetic at a stated 7% after inflation with contributions assumed to rise with prices; they are not forecasts, and individual circumstances, tax treatment and timelines vary considerably.