
How long to double your money is the one question about compounding that everybody asks and almost nobody answers precisely. The usual reply is the Rule of 72: divide 72 by your annual return and you have your answer. It is fast, it is close, and it is close in a way that hides two much larger errors sitting underneath it.
The shortcut itself is fine. At 7% it is wrong by fifteen days across a decade, which is not a mistake worth arguing about. The problems are the two questions nobody asks before reaching for it: which rate went into the division, and whether the money is sitting still while it doubles.
Get the first one wrong and your doubling time moves by almost three years. Get the second one wrong and you will congratulate compounding for work your own bank transfer did. This piece prices both, on arithmetic you can reproduce in a spreadsheet.
How long to double your money, in one exact line
The exact answer is not an approximation and it is not hard. Doubling time is the natural logarithm of 2 divided by the natural logarithm of one plus the rate:
t = ln(2) / ln(1 + r)
At 7% a year, that is 0.693147 divided by 0.067659, which is 10.24 years. The Rule of 72 gives 72 / 7 = 10.29 years. The shortcut runs fifteen days long. If a decision of yours turns on fifteen days out of ten years, the arithmetic is not your problem.
The formula holds for anything that compounds at a constant rate: a portfolio, a fee-adjusted return, a card balance, a salary rising at a fixed percentage. It assumes one thing only, and it is the thing people forget. It assumes the sum is left alone. Nothing is added, nothing is withdrawn, and the rate does not change.
That single assumption is doing more work than the formula is. Every real complication in this article comes from breaking it.
Where the Rule of 72 is right, and where it quietly is not
The Rule of 72 is not a rounded version of the truth. It is an approximation with a known shape, and the shape is worth carrying in your head because it tells you when to stop trusting it.
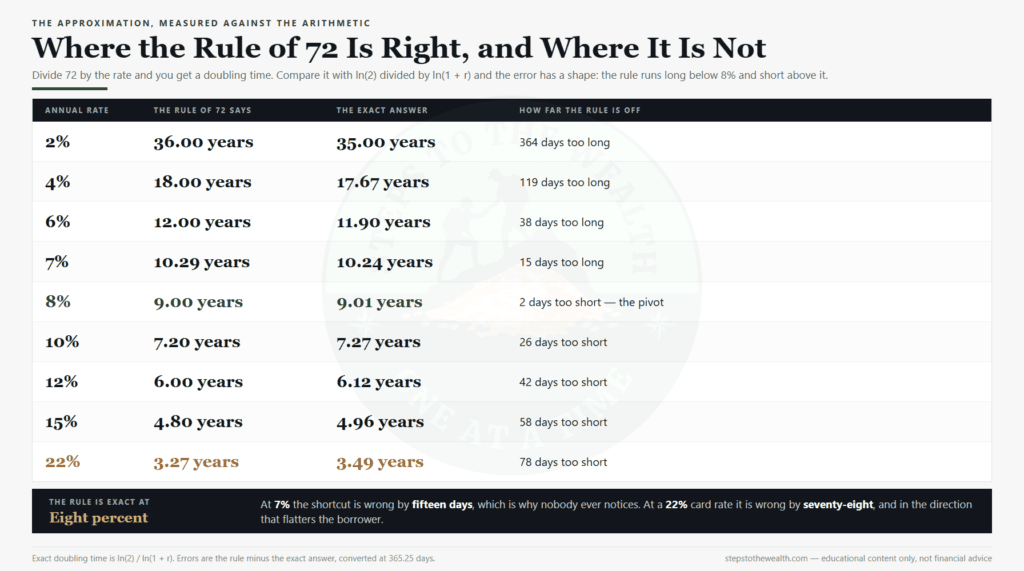
Below 8% the rule overstates the wait. At 2% it says 36.00 years against an exact 35.00 — a full year too long. At 4% it is 119 days too long. At 6% it is 38 days too long. By 7% the error has shrunk to fifteen days, which is why nobody has ever noticed it in the context it gets used in most.
At 8% the rule is effectively exact. It says 9.00 years; the arithmetic says 9.01. Two days apart across nine years. That is the pivot, and it is not a coincidence — 72 was chosen because it divides cleanly and because it lands its best accuracy in the range people actually quote returns in.
Above 8% the error flips sign and grows. At 10% the rule says 7.20 years against an exact 7.27. At 15% it says 4.80 against 4.96. At a 22% credit card rate it says 3.27 years against an exact 3.49 — seventy-eight days short, and short in the direction that flatters whoever is carrying the balance.
So the rule is a reasonable instrument in the 6% to 10% band and a poor one outside it. If you are using it on debt, on cash, or on a projection you have talked yourself into at 15%, use the logarithm instead. It is one keystroke more.
The gap that costs three years: which rate went into the division
Here is the error that dwarfs the approximation. Two people can both do the arithmetic correctly and land almost three years apart, because they put different rates in.
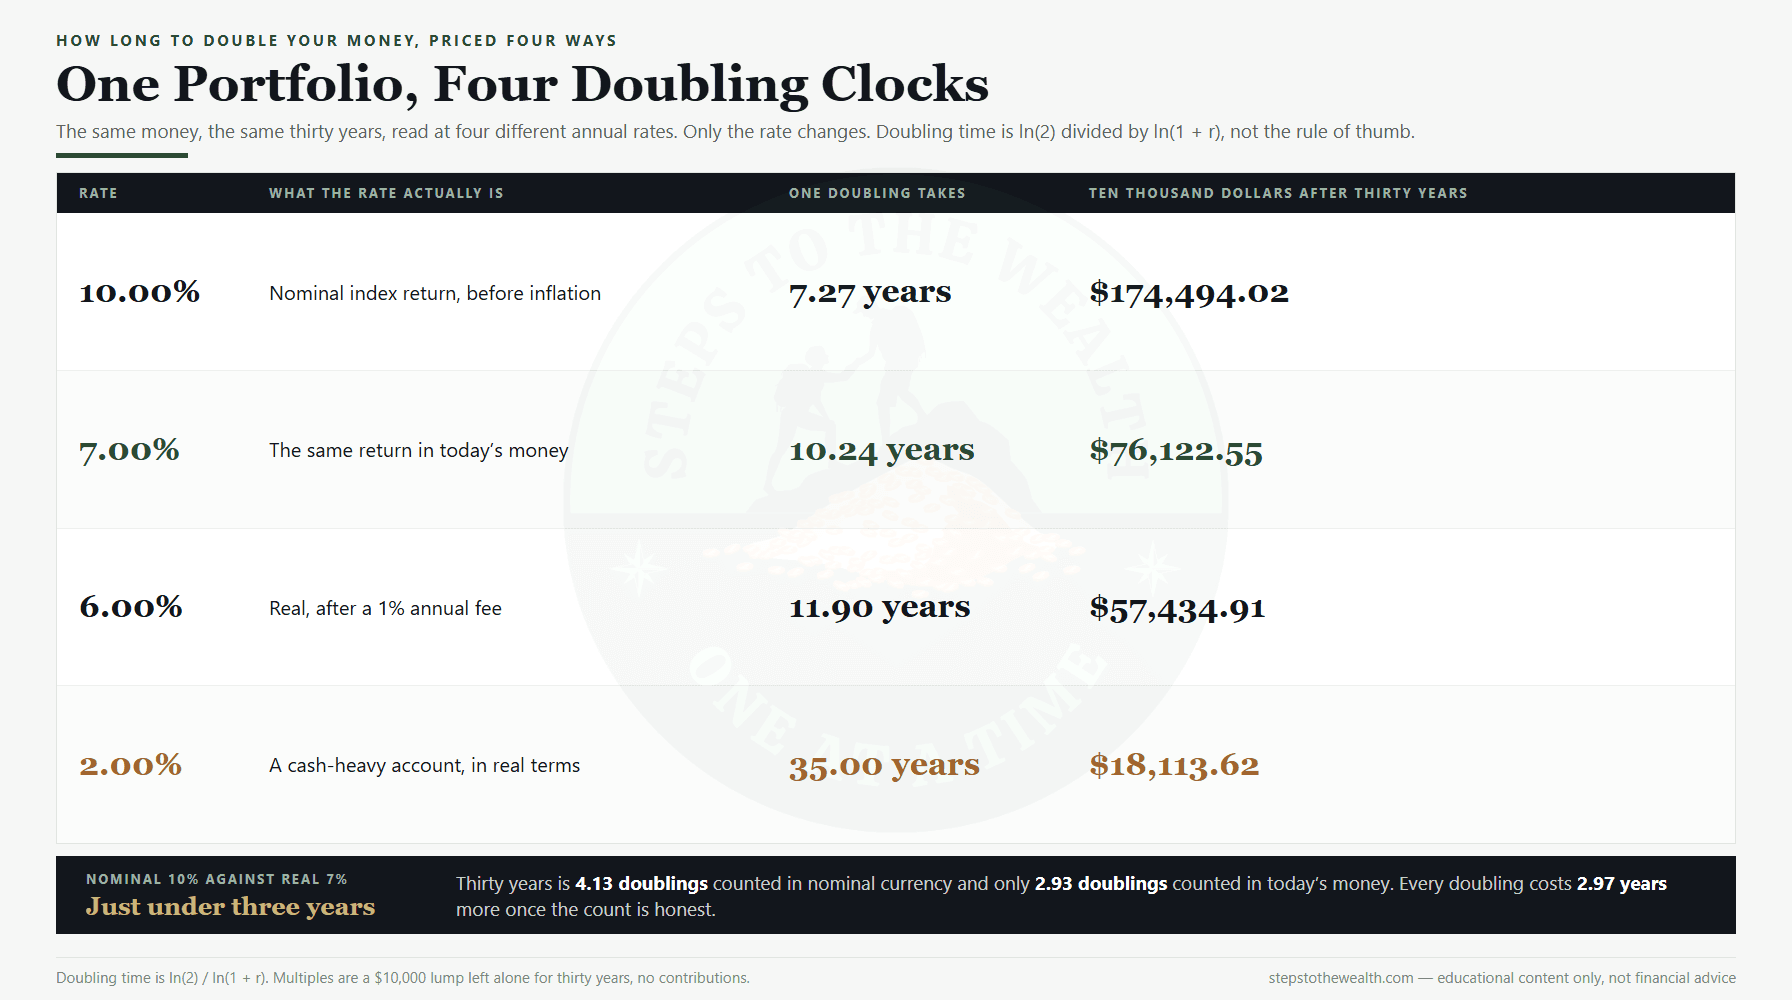
One of them uses the long-run nominal figure for a broad equity index, roughly 10% a year before inflation. That divides to a doubling time of 7.27 years. The other uses a real rate — the same return measured in money that buys the same things — and gets 10.24 years. The gap is 2.97 years, on every single doubling.
Neither of them is doing bad arithmetic. They are answering different questions. Nominal doubling tells you when the account statement will show twice the number. Real doubling tells you when the balance will buy twice as much. Only the second one is a goal.
Stretched over thirty years the difference stops looking like rounding. Counted in nominal currency, thirty years at 10% is 4.13 doublings and turns $10,000 into $174,494.02. Counted in today’s money at 7%, it is 2.93 doublings and turns the same $10,000 into $76,122.55. The two answers differ by more than a full doubling, and the second one is the one you will actually spend.
The conversion between them is a division, never a subtraction. This site uses a standing 7% real, which is a disclosed rounding of 6.74%: 10.02% nominal divided by 3.07% inflation, not 10 minus 3. The mechanics of that conversion, and the 13.5% error you introduce by subtracting instead, are worked through in inflation vs nominal returns.
What a 1% fee does to the doubling clock
A fee is not a separate cost sitting beside the return. It is a reduction in the rate, which means it does not subtract from your balance — it moves the whole clock.
Take the same 7% real return and hand 1% a year to a fund. You are compounding at 6%. Doubling time goes from 10.24 years to 11.90 years. That is 1.65 extra years on every doubling, forever, in exchange for nothing you can point at.
Over thirty years the compounding of that gap is what does the damage. A $10,000 lump at 7% becomes $76,122.55. The same lump at 6% becomes $57,434.91. You keep 75.45% of the outcome, which is to say the 1% charge took 24.55% of what you were going to have.
That ratio is the part people refuse to believe, and it is the reason the fee question deserves more attention than the fund-selection question. The full version of that arithmetic, including what the same charge looks like when you price it as an extra monthly contribution, is in the hidden cost of investment fees.
The useful reframe is this: a fee does not cost you money. It costs you time. Every 1% you hand over pushes the date you were aiming at further into the future, and the date is the thing you were actually buying.
The doubling you actually observe is mostly your own deposits
Every number so far assumes a lump sum left alone. Almost nobody has one. Most people have a plan they are still paying into, and in a plan the balance doubles for a reason that has nothing to do with compounding.
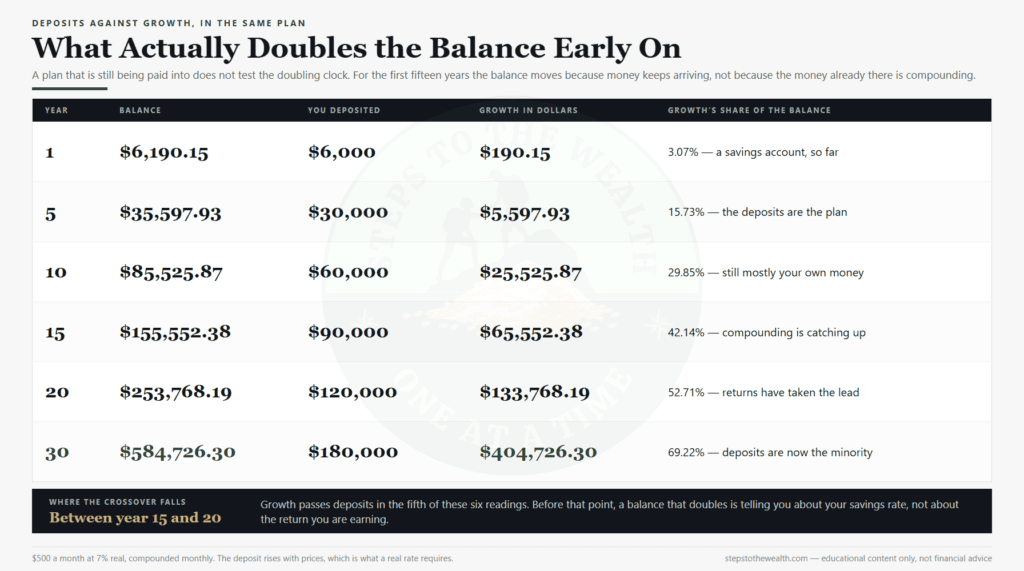
Run $500 a month at 7% real for thirty years, with the deposit rising with prices as a real rate requires. After one year the balance is $6,190.15, of which $6,000 is your own money. Growth’s share is 3.07%. That is not compounding. That is a savings account with a market attached.
After five years the balance is $35,597.93 and growth is 15.73% of it. After ten years it is $85,525.87 and growth is 29.85%. After fifteen years, $155,552.38 and 42.14%. Growth does not become the majority of the balance until somewhere between year fifteen and year twenty, and it does not get to 69.22% until year thirty.
This is why watching your balance double in the first decade tells you nothing about your returns. It is a readout on your savings rate. The same point, priced from the other direction, is what the stages of wealth building is about: early on the contribution is the entire lever, and there is a specific balance at which that stops being true.
It also explains a common and expensive misreading. Somebody watches a plan double in six years, concludes they are getting spectacular returns, and increases their risk to keep it going. They were not getting spectacular returns. They were making deposits.
Four answers to one question, and why all four are correct
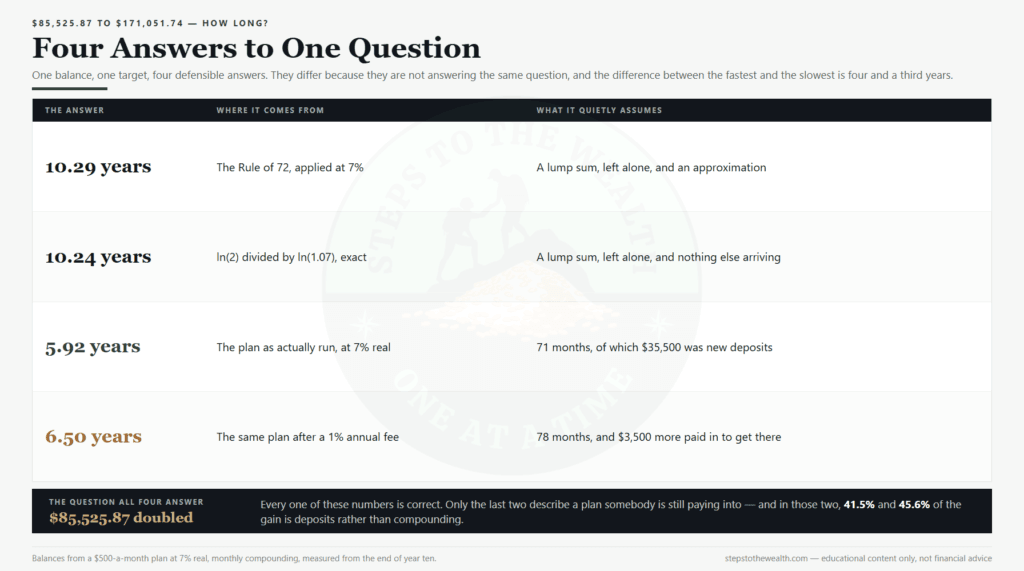
Take the year-ten balance above, $85,525.87, and ask a single question: how long until it is $171,051.74? There are four defensible answers and they span four and a third years.
The Rule of 72 at 7% says 10.29 years. The exact logarithm says 10.24 years. Both assume the money sits there and nothing else arrives.
Keep paying in $500 a month at 7% real and it doubles in 5.92 years — 71 months. But $35,500 of that gain walked in from your current account. Only $50,025.87 of it was compounding, which is to say 41.5% of the doubling was a transfer, not a return.
Now hand 1% a year to a fund. The same plan takes 6.50 years, 78 months, and you pay in $3,500 more to get to the same place. The deposit share rises to 45.6%, because when the return is smaller you have to buy more of the outcome yourself.
None of these numbers is wrong. They are wrong only when you quote one of them as the answer to a question it was not asked. If you want to know whether your investments are performing, the deposits have to come out of the measurement first — which is the whole reason XIRR exists as a way to measure a DCA plan.
The doubling clock runs on debt too, and faster
Compounding is a mechanism, not a reward. It runs identically on money you owe, and on the rates debt is typically priced at it runs much faster than anything a portfolio will do for you.
A balance at 22% doubles in 3.49 years. A portfolio at 7% real takes 10.24. In the time it takes your investments to double once, an untouched card balance doubles nearly three times.
That asymmetry is the entire reason the order of operations matters more than the return assumption. Which one to clear first is not a matter of temperament, and it is not answered by comparing 22% to 7% — those two numbers are quoted in different units, and comparing them directly is the most common error in the whole question. The like-for-like comparison is worked out in pay off debt or invest.
There is a second trap on the debt side, and it is worse than the doubling time. Paying a minimum keeps the balance compounding almost indefinitely, because the minimum is defined as a percentage of the balance rather than a fixed sum. What that actually does to a card balance over a decade is priced in the minimum payment article.
Beyond doubling: the tripling and ten-fold clocks
Doubling is only the most quotable milestone. The same formula answers any multiple you like — replace ln(2) with the logarithm of the multiple you actually care about and divide by the same denominator.
At 7% real, tripling takes 16.24 years. Quadrupling, which is two doublings back to back, takes 20.49. Reaching ten times your money takes 34.03 years. Those three numbers together describe a working life far better than any single doubling does.
There are shortcut rules for the first two, built the same way. Divide 114 by the rate for tripling: 114 / 7 = 16.29 against an exact 16.24, eighteen days long. Divide 144 for quadrupling: 20.57 against 20.49, thirty days long. Both share the Rule of 72’s shape and its accuracy band, and both fail in the same directions outside it.
The ten-fold figure is the one that reframes the horizon question. Forty years at 7% real is 3.90 doublings and roughly fifteen times your money. Twenty years is 1.95 doublings and 3.87 times. Halving the horizon does not halve the result; it takes it from fifteen times down to under four.
That non-linearity is the whole case for starting, and it is the only version of the case that requires no market view to make. It is also why the compounding argument gets weaker, not stronger, the longer somebody spends evaluating it.
What doubling time cannot tell you
Doubling time is a smooth number describing a lumpy process, and it is honest to say what it hides.
It assumes a constant rate. Markets do not deliver one. A portfolio that averages 7% over thirty years will spend individual years at −30% and +25%, and the arithmetic above says nothing about which years those are. If the bad ones land while you are withdrawing, the average stops describing your outcome at all — that is sequence of returns risk, and it is a different question with a different answer.
It says nothing about risk. A 15% doubling time of 4.96 years is arithmetically fine and tells you nothing about whether the thing producing 15% will still exist in five years. Volatility is not the same as risk, but neither of them appears anywhere in ln(2) divided by ln(1 + r). That distinction is worth having straight before you plug an optimistic rate in.
It is silent on tax, and deliberately so here. Tax treatment depends on where you live, and any doubling time quoted after tax is only true in one jurisdiction. The pre-tax number is the one that transfers.
And it does not tell you whether the plan reaches the goal. Doubling is a rate question; reaching a target is a rate, contribution and horizon question at once. If the gap between the two is what you actually want measured, that is what a goal-plan mismatch is.
Frequently asked questions
Is the Rule of 72 accurate enough to use? Between roughly 6% and 10%, yes — the error is under forty days across a full doubling. Outside that band it degrades in a predictable direction: too long below 8%, too short above it. On debt rates it is materially optimistic, so use the logarithm there.
Why is 72 the number, and not 70? Both are used. 70 is the closer approximation for continuously compounded rates, and 69.3 is the exact constant. 72 wins on convenience because it divides evenly by 2, 3, 4, 6, 8, 9 and 12, and because its best accuracy happens to sit near 8%.
Should I use my nominal return or my real return? Real, for anything you intend to spend. A nominal doubling tells you when the number on the statement doubles; a real doubling tells you when your purchasing power does. The gap at these rates is just under three years per doubling, and it compounds across every doubling in the plan.
My balance doubled in six years. Am I doing well? Unknown from that fact alone. If you were contributing throughout, most of the increase was probably your own deposits — in the plan above, 41.5% of the doubling was money transferred in. Strip the contributions out before you judge the return.
How many doublings should I expect over a working life? At 7% real, forty years is 3.90 doublings and roughly fifteen times your money; twenty years is 1.95 doublings and 3.87 times. The count is not proportional to the horizon, which is why the final decade of a lump-sum path adds more than the first two decades put together.
Does it work for a house, a salary or a business? It works for anything compounding at a roughly constant rate, which is a stronger assumption than it sounds. It is a poor fit for anything with lumpy, irregular growth, and it is meaningless for an asset that depreciates.
The check worth running this week
Take the rate you have been using in your own head and write down whether it is nominal or real. Most people cannot answer this immediately, and that hesitation is the whole article.
Then divide ln(2) by ln(1 + that rate), subtract whatever your platform and funds charge annually, and do it again. The difference between the two answers is the number of years the fee is costing you, and it is usually the largest controllable line in the plan.
If you want to see it move rather than read it, the DCA simulator projects a plan forward and lets you change the rate, the fee and the horizon and watch the date shift. If you would rather work backwards from a target you already have, the plan gap tool does that instead. Both are free.
One last framing worth keeping. Delay is a doubling too. Every year you spend deciding is a year that comes off the end of the plan, where the doublings are largest — which is what the cost of waiting actually is, priced.
If this is the kind of arithmetic you want more of, the newsletter is where it goes out.
Assumptions: doubling times are ln(2) / ln(1 + r). The 7% real rate is a disclosed rounding of 6.74%, derived from 10.02% nominal less 3.07% inflation, and 10% is used as a round working figure for the nominal series. Contribution figures assume $500 a month compounded monthly with the deposit rising with prices. External reference: the investor.gov compound interest calculator reproduces the lump-sum figures directly.
Educational content only — not financial advice.