
Investing for short-term goals is the one question where the standard advice and the standard arithmetic point in opposite directions, and almost nobody notices. The advice says get invested, that time in the market beats timing the market, that cash is a slow leak. The arithmetic says money with a date attached to it is a different problem with a different answer.
Both are right, because they are answering different questions. “Should I be invested” and “should this particular money be invested” are not the same question. The first one is about you. The second one is about a calendar, and it has an answer you can compute.
What follows is that computation. It runs two independent tests, they land within about fourteen months of each other, and between them they explain why the rule of thumb everybody repeats is nearly right without anyone being able to say why.
Investing for short-term goals is a calendar problem, not a market problem
Almost every argument about this gets conducted in the wrong currency. People ask whether the market is expensive, whether a correction is due, whether now is a good time. Those are forecasting questions, and forecasting is the wrong question to be asking in the first place.
The question that actually decides it is duller. It is: on the day you need this money, will you have the option to wait?
That single word — option — is the whole thing. An investor with a twenty-year horizon who is down 40% has a paper loss. An investor who needs the money in eleven months and is down 40% has a realised loss, because the sale is not optional. Same index, same drawdown, same account balance. One of them is inconvenienced and the other one is poorer.
This is the distinction that separates volatility from risk. Volatility is a property of the market. Risk is a property of the market and your circumstances taken together, and a deadline is the single most powerful circumstance you can add. It converts a temporary price into a permanent outcome.
So the test is not about the market at all. It is about whether your calendar leaves room for the market to be wrong for a while and then recover.
The two clocks that actually decide it
There are two ways to price a deadline, and they are genuinely independent of each other. That matters, because when two unrelated methods return roughly the same answer, the answer is probably a real feature rather than an artefact of one method.
The first is a duration clock. Historical drawdowns take a measurable amount of time to reverse. If your deadline arrives before the recovery finished, you sell into the hole. This clock does not care about the size of the fall at all, only its length.
The second is an asymmetry clock. Over any horizon, an expected return accumulates while a worst-case loss stays roughly constant. Early on, the potential loss is enormous relative to the expected gain. Eventually the expected gain overtakes it. That crossover is a specific number.
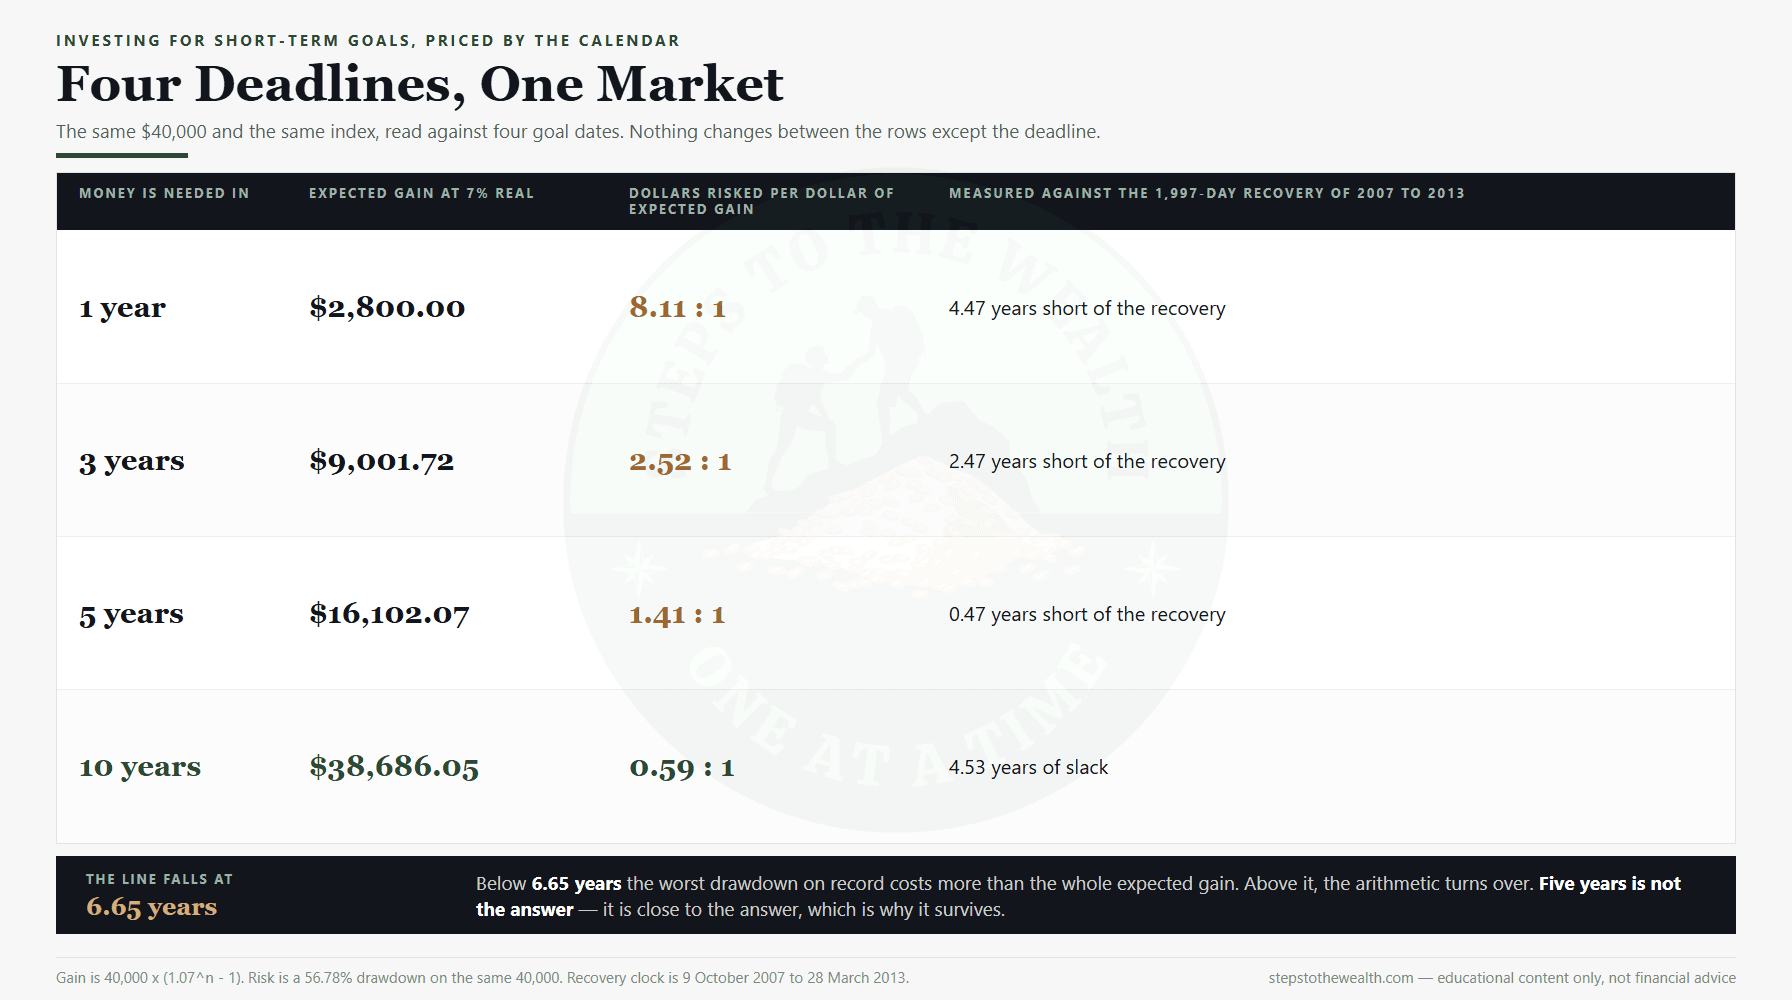
The first clock says about five and a half years. The second says 6.65 years. Neither was derived from the other, and neither was reverse-engineered from the familiar advice. They are close enough to each other that the fuzzy answer everybody gives — roughly five years — turns out to be a reasonable rounding of something real.
Clock one: the market took 1,997 days to give the money back
Depth is the famous number. Everybody can tell you the market fell by more than half in the financial crisis. Almost nobody can tell you how long it took to hand the money back, and the second number is the one with your goal date in it.
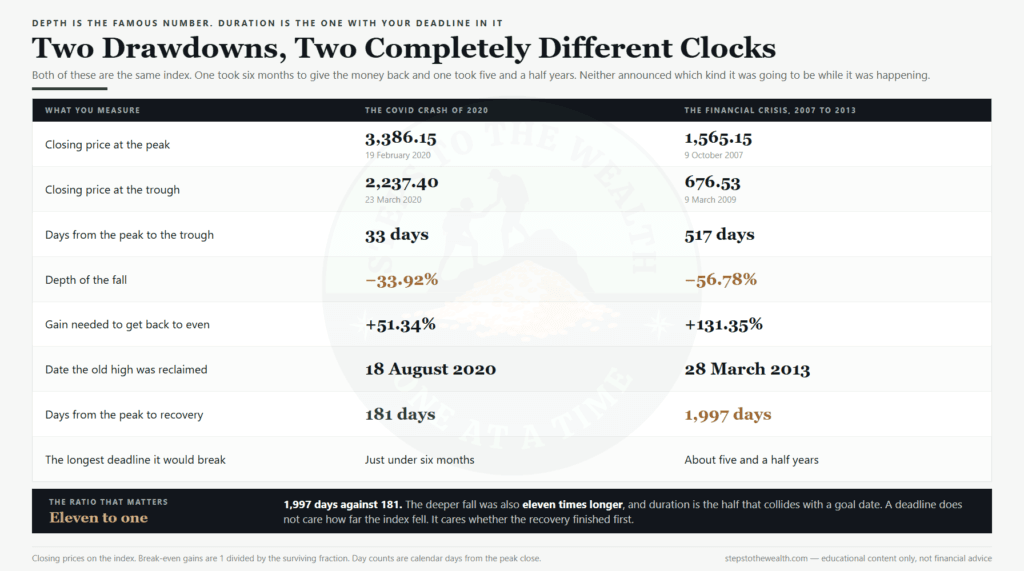
The index closed at 1,565.15 on 9 October 2007 and at 676.53 on 9 March 2009, a fall of 56.78%. Getting back to that old high required a gain of 131.35%, because you are climbing from a much smaller base. It did not get there until 28 March 2013 — 1,997 calendar days, a little over five and a half years, from the peak.
Now set the 2020 crash beside it. The index fell 33.92% in 33 days, needed 51.34% to get level, and had reclaimed the old high by 18 August 2020. Peak to recovery: 181 days. Both events are described the same way in conversation. One of them breaks a six-month deadline and the other breaks a five-year one.
Neither episode announced in advance which kind it was going to be. In March 2020 the fall was faster and more violent than anything in 2008, and it was over in half a year. The 2008 case study and the 2020 one walk through what a steady buyer actually experienced inside each window.
So clock one gives you a planning number rather than a forecast: the longest recovery in the modern record ran about five and a half years. A goal inside that window can be fully destroyed by an event that has already happened, at least once, within the working life of most people reading this.
Clock two: what you risk against what you expect
The second clock ignores duration entirely and asks a pricing question instead. For each dollar of expected gain, how many dollars of worst-case loss are you accepting?
The expected side compounds. At 7% real, one year is worth 7.00%, three years 22.50%, ten years 96.72%. The risk side does not compound in the same way. A 56.78% drawdown is 56.78% whether it arrives in year one or year nine. So the ratio between them collapses steadily as the horizon extends.
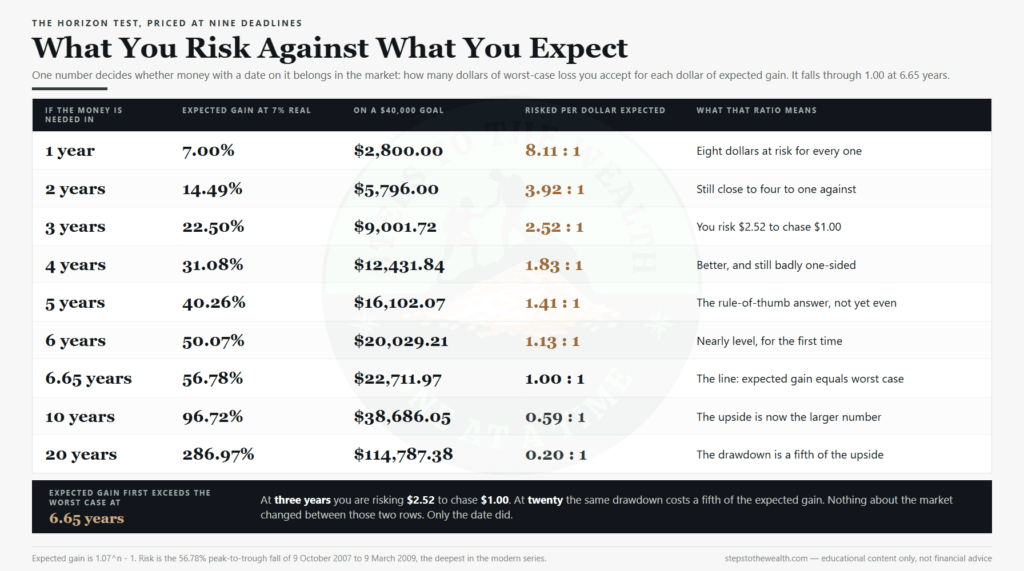
At one year you are accepting $8.11 of worst-case loss for every $1.00 of expected gain. At three years it is $2.52. At five years, the answer most people give without checking, it is still $1.41 — better, and still meaningfully one-sided.
At 6.65 years the two sides are exactly equal: the expected real gain is 56.78%, which is the same size as the worst drawdown on record. Past that point the arithmetic turns over. At twenty years the drawdown costs about a fifth of the expected gain, which is why long-horizon investing forgives so much.
The 7% here is a real return, after inflation, not a nominal one. That distinction matters more than it sounds and is worked through in full in the difference between real and nominal returns. Using a nominal rate here would flatter the invested side and move the line earlier than it belongs.
Why the line lands at 6.65 years and not at five
The crossover is not a rounded rule. It is the solution to a small equation: find the number of years where 1.07 raised to that power equals 1.5678, because 56.78% is what the invested money would need to recover from. That number is 6.6462 years, or a little under six years and eight months.
It is worth being clear about what would move it. A lower assumed return pushes the line later. A shallower worst case pulls it earlier. Assume 6% real instead of 7% and the crossover slides out past seven and a half years; assume the worst drawdown you must survive is 40% rather than 56.78% and it comes back inside five.
So the honest statement is not “the answer is 6.65 years.” It is that under this site’s standing assumption of 7% real and the deepest fall the modern index has actually delivered, the line sits at 6.65 years — and the familiar five-year rule of thumb is sitting about twenty months on the wrong side of it.
That gap is the useful part. Five years is not conservative. It is slightly aggressive, and it is repeated as though it were a floor.
The comparison is deliberately unfair, and that is the point
An objection is coming, and it is a fair one, so it belongs here rather than buried at the end. This test compares an average outcome on one side against a worst outcome on the other. That is not a like-for-like comparison and nobody should pretend it is.
It is done on purpose. A deadline is precisely the circumstance in which averages stop being useful to you. If you have thirty years, you get to experience the distribution — the good stretches and the bad ones average out into something close to the expected number. If you have three years, you get one draw from that distribution, and you have to live with whichever one you got.
Sizing a decision against the worst case rather than the average case is not pessimism. It is what you do whenever the downside is not recoverable, which is the whole basis of a risk-first approach. You buy insurance against the fire, not against the average house.
If you would rather see the symmetric version, it is easy to state: over three years, most outcomes are fine. That is true, and it is also the reason people keep getting caught. The cases that are fine do not need a rule. The rule exists for the case that is not.
What the test actually needs from you
Three inputs, and only one of them is about markets.
- The date. Not “in a few years.” A month and a year. If you cannot name one, the money probably does not have a deadline at all, in which case this whole test does not apply and you should treat it as ordinary long-horizon money.
- The portion that must be there. Rarely all of it. A deposit has a minimum and a preferred number. A wedding has a budget and a version of the budget you would accept. This is the number the test protects.
- What happens if it is not there. The purchase slips by a year? Then your effective horizon is longer than your stated one. The purchase collapses and the deposit is forfeit? Then your effective horizon is shorter, because you will sell early rather than risk it.
That third input is the one people skip, and it is often the one that decides the answer. Two people with identical balances and identical dates can get opposite verdicts, because one of them can move the date and the other cannot.
This is also where a goal gets confused with a plan. Whether the money is enough is a separate question from whether it should be exposed, and it is handled in the gap between a goal and the plan meant to reach it.
Where the money goes when it fails the test
Saying “keep it out of the market” is only half an instruction, and the unhelpful half. Money that fails the horizon test still has to sit somewhere, and every option costs something.
Cash is the obvious answer and it is not free. Held for three years against a goal that inflates with everything else, cash loses purchasing power quietly and continuously. That cost is real, it is just certain and small rather than uncertain and large. Certainty is what you are buying. Cash is a position, not the absence of one, and it should be held deliberately.
Short-dated fixed income is the other structural answer, because the instrument has a maturity date and your goal has a date, and those two things can be matched. The mechanics, and the reason duration is the variable that matters most here, are covered in the piece on bonds for working professionals.
One thing this money is not: your emergency buffer. Those are different pools with different jobs, and spending one on the other is how a single bad month turns into a forced sale. The buffer question sits upstream of this one and gets answered first.
Split the goal, not the portfolio
The framing so far has been binary, and real goals are not. A goal four years out with a hard minimum and a soft preference can be split, and the split is where most of the useful decisions live.
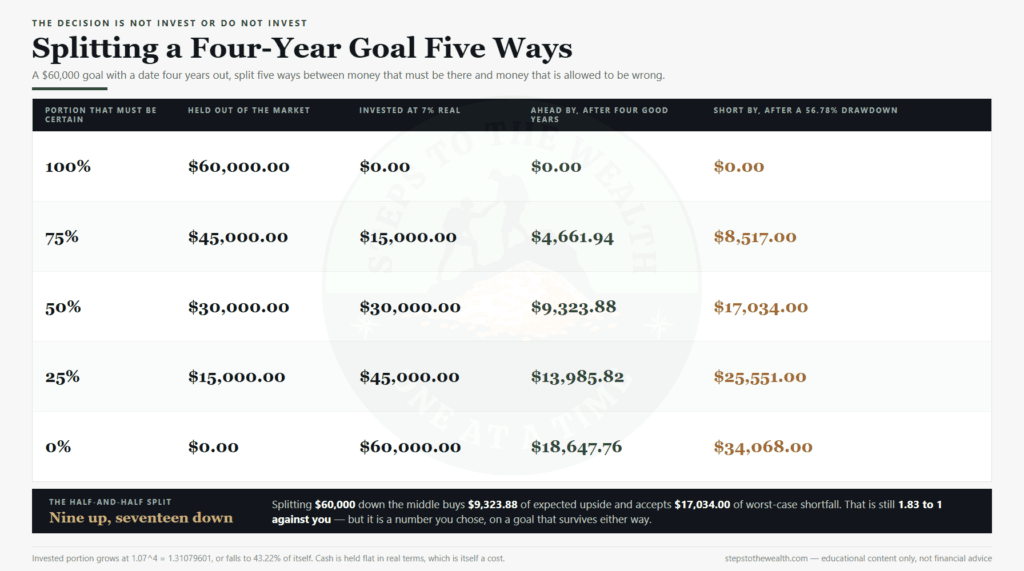
Take $60,000 needed in four years. Hold all of it out and you are certain of the outcome and give up any gain. Invest all of it and a good four years hands you $18,647.76, while a repeat of 2008 leaves you $34,068.00 short of the number you needed.
Split it down the middle and the shape changes. Thirty thousand invested buys $9,323.88 of expected upside and accepts $17,034.00 of worst-case shortfall, which is still 1.83 to 1 against you. But the $30,000 sitting out means the goal survives either outcome. You are no longer betting whether the purchase happens, only how comfortable it is.
That is the correct shape for a dated goal: certainty on the portion that must exist, exposure on the portion that would merely be nice. The split is a decision you make once, in advance, in writing — which is the same discipline that makes rules-based investing work anywhere else.
What a partial recovery does to a deadline
There is a middle case that the binary framing hides, and it is probably the most common one of all. The market falls, it starts recovering, and your deadline arrives partway up.
Run the 2007 clock against a three-year goal. The fall begins, and by the time your date arrives you are two and a half years into a recovery that will take five and a half. You do not sell at the bottom. You sell somewhere in the middle, at a loss you did not choose, on a date you cannot move.
This is why the duration clock is the more practical of the two. It does not require the worst case to land exactly on your deadline. It only requires the recovery to be unfinished when you get there, and unfinished is a far wider target than the trough.
It is also why an extension option is worth so much. If you can delay the purchase by eighteen months, a three-year goal becomes a four-and-a-half-year one, and both clocks move materially in your favour. The flexibility is worth more than the return you were chasing.
The mistakes this test is designed to stop
Three specific errors, each of which shows up constantly.
The first is treating a strong recent run as evidence about the next three years. It is not evidence about anything, and the impulse to read it that way is the ordinary recency bias doing its work on a deadline instead of a portfolio.
The second is planning to get out before it gets bad. Nobody in October 2007 knew what October 2007 was. Every version of this plan requires you to identify the top in advance, which is the thing that reliably does not work.
The third is the most human. It is putting deposit money into the market because leaving it in cash feels like doing nothing while everyone else is compounding. That is a comparison problem, not a portfolio problem. The cash is doing something specific: it is guaranteeing that the purchase happens.
The honest limits of a two-clock test
This test tells you about exposure. It says nothing about how much money you need, whether the goal is sensible, or whether you can afford it, and it should not be read as a recommendation about any particular asset.
It also leans on two assumptions worth naming plainly. The 7% real figure is a long-run average that no individual three-year window is obliged to deliver. And the 56.78% drawdown is the deepest in the modern series, not a ceiling — nothing in the historical record caps a fall at any particular depth, and the next one is under no obligation to be shallower.
Contributions change the picture too. The arithmetic here treats a lump of money sitting still. Money still being added month by month across the same window has a different cost basis and a different exposure profile, and that case is closer to the lump sum against staged entry comparison.
Finally, this is the accumulation-side version of a problem that also exists on the way out. Drawing money down while markets fall is sequence-of-returns risk, and it is the same collision between a calendar and a drawdown, seen from the other end of a working life. Broader context on matching exposure to a time horizon is set out by the regulator-run investor education site investor.gov.
Run it against your own dated goal
Take one goal with a real date on it and do this in about ten minutes. Write the month and the year. Write the amount that must exist on that date, separately from the amount you would like to exist. Count the years between now and then, and read the ratio off the table above.
If the horizon is under about six and a half years, the default is that the money stays out, and any exposure you take is a portion you have deliberately sized rather than the whole amount by inertia. If it is over, the calendar has stopped being the binding constraint and the ordinary long-horizon rules apply again.
Then check whether the plan reaches the number at all. The Plan Gap tool works a goal backwards from the date — it takes what you need and when, and returns what the plan actually has to deliver. It is free, it runs in the browser, and nothing you enter leaves your machine.
Two clocks, one calendar. The market is not the variable you are managing here. The date is.
Educational content only — not financial advice. Figures are illustrative and based on historical index closes; past performance does not indicate future results.