
The whole of inflation vs nominal returns comes down to one question, asked before any number goes into a spreadsheet: does this cash flow rise with prices, or does it stay the same number of dollars? Get that answer right and everything downstream is arithmetic. Get it wrong and you produce a plausible figure that is wrong in a predictable direction, usually the flattering one.
Most people never ask it. They take a return, subtract inflation, and carry on — which is not quite the right conversion, and is applied to a cash flow that may not deserve it.
This article does three things. It gets the conversion right, which is a multiplication rather than a subtraction. It shows what the difference actually costs over a working life. And it gives you the one-question rule for deciding which rate a given projection needs.
Throughout, the standing assumption is the one used across this site: 7% after inflation, with inflation at 3%, results stated in today’s money. Both numbers are stated so that you can change them, and every figure below moves if you do.
Educational content only. Not financial advice.
The conversion: 7 + 3 is not 10
A real return is growth in purchasing power. A nominal return is growth in the number of dollars. To get from one to the other you multiply, because inflation applies to the growth as well as to the money you started with.
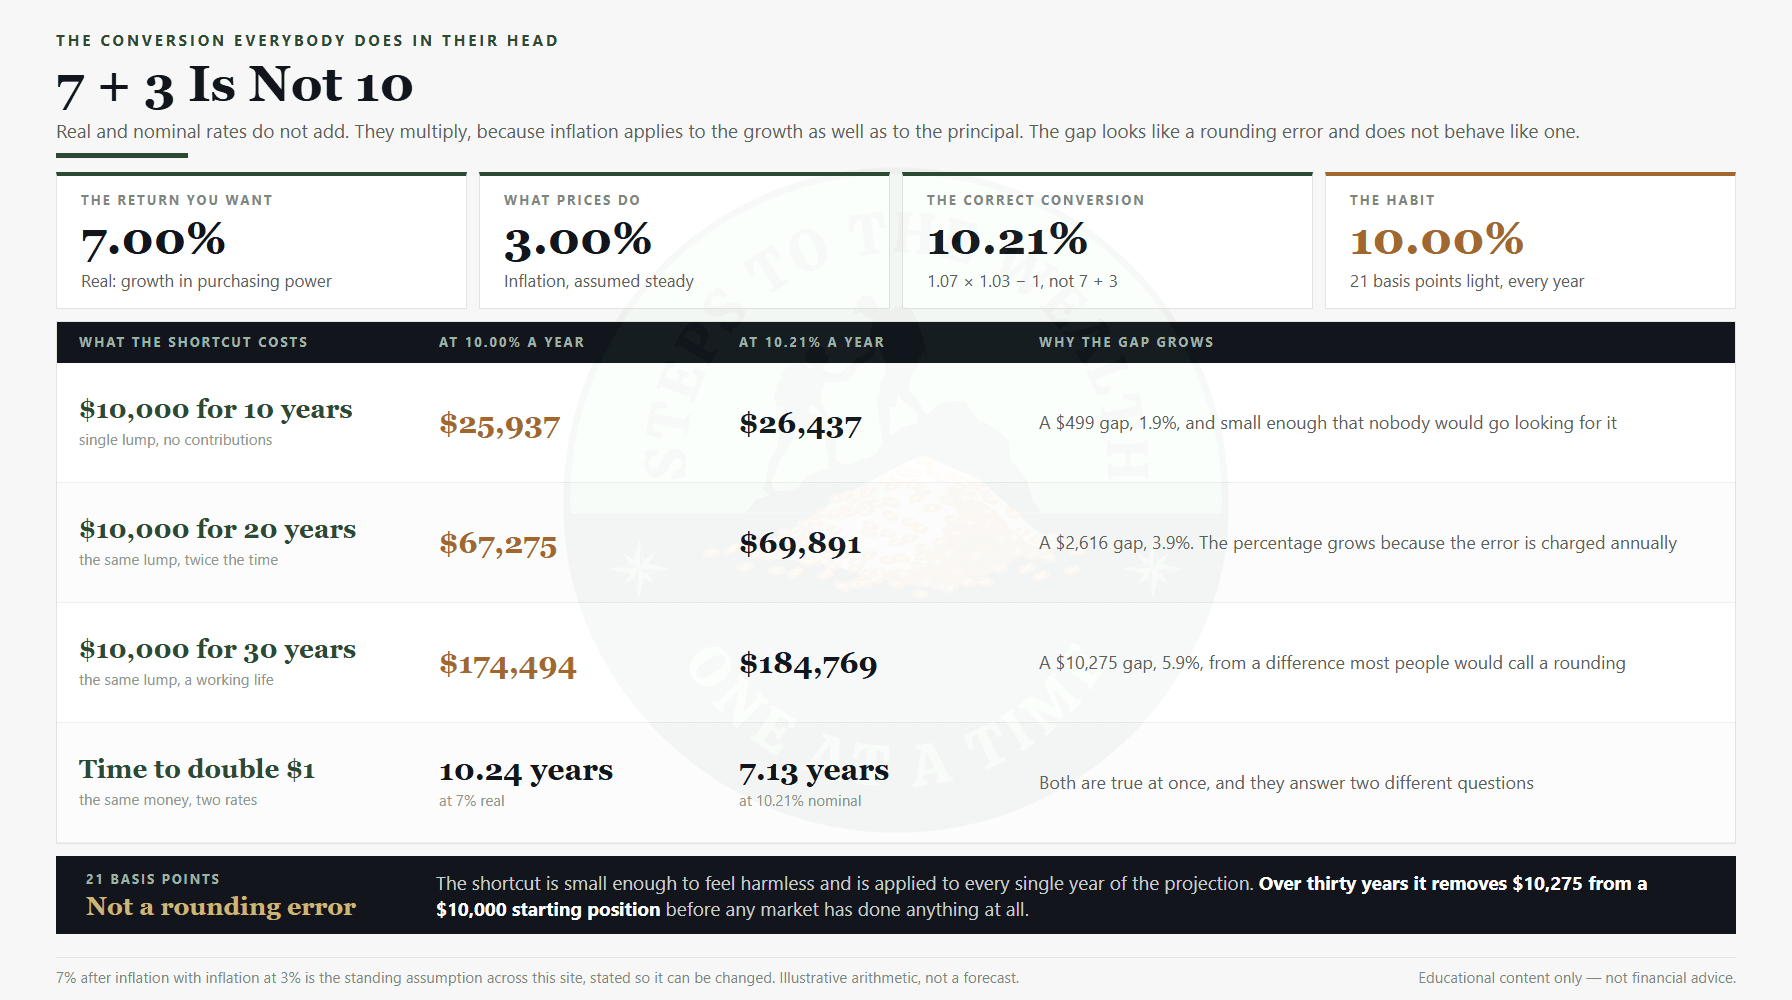
7% real with 3% inflation gives 1.07 × 1.03 − 1 = 10.21% nominal. Not 10%. The shortcut of adding the two is 21 basis points light, every single year of the projection.
Twenty-one basis points sounds like the definition of a rounding error. Here is what it does to $10,000 left alone, with nothing added:
- Over 10 years: $25,937 at 10.00% against $26,437 at 10.21%. A gap of $499, or 1.9% — small enough that nobody would go looking for it.
- Over 20 years: $67,275 against $69,891. A gap of $2,616, or 3.9%.
- Over 30 years: $174,494 against $184,769. A gap of $10,275, or 5.9% — more than the entire starting position.
The percentage grows because the error is charged annually and then compounds on itself. That is the general shape of every mistake in this article: they do not look expensive at the point where you make them, and they are only ever paid at the end.
What inflation vs nominal returns does to a single dollar
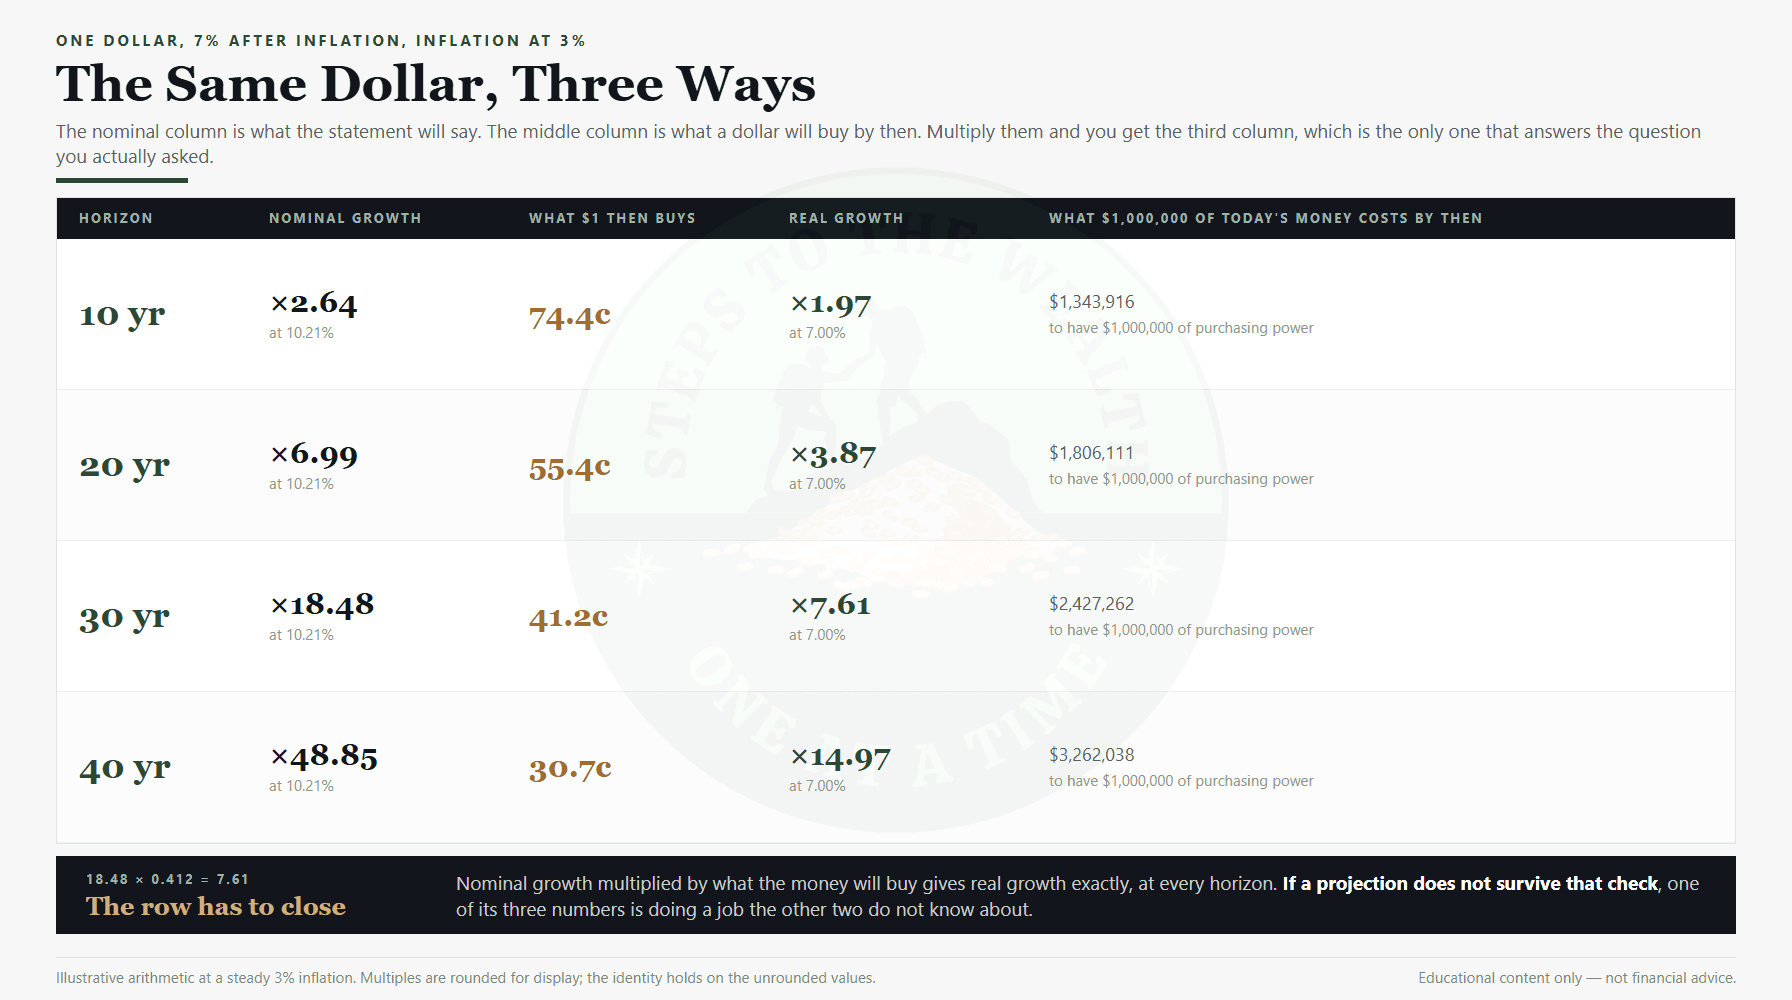
Run the same dollar at both rates and three separate facts fall out, all true at once.
Over thirty years, a dollar compounding at 10.21% nominal becomes $18.48. That is the number a statement would show. Over the same thirty years, 3% inflation reduces what a dollar buys to 41.2 cents. Multiply those together and you get $7.61, which is exactly what the same dollar does at 7% real.
That identity is worth keeping as a check. Nominal growth, multiplied by what the money will buy by then, equals real growth — at every horizon, not just this one. If a projection does not survive that test, one of its three numbers is doing a job the other two do not know about.
The same arithmetic answers the question people actually care about, which is what a named target costs. If you want $1,000,000 of today’s purchasing power:
- In 10 years, you need $1,343,916.
- In 20 years, $1,806,111.
- In 30 years, $2,427,262.
- In 40 years, $3,262,038.
Nobody plans in those numbers, and nobody should have to. The point is that “a million” is a statement about purchasing power, and purchasing power has a date attached whether or not you attached one.
The error that costs 13.5%, and always in the same direction
Here is the mistake that matters most, because it hides inside calculations that look completely reasonable.
Take $50 a month for ten years — a subscription, a set bill, any payment that stays the same number of dollars. You want to know what that money would have been worth if invested instead, stated in today’s money.
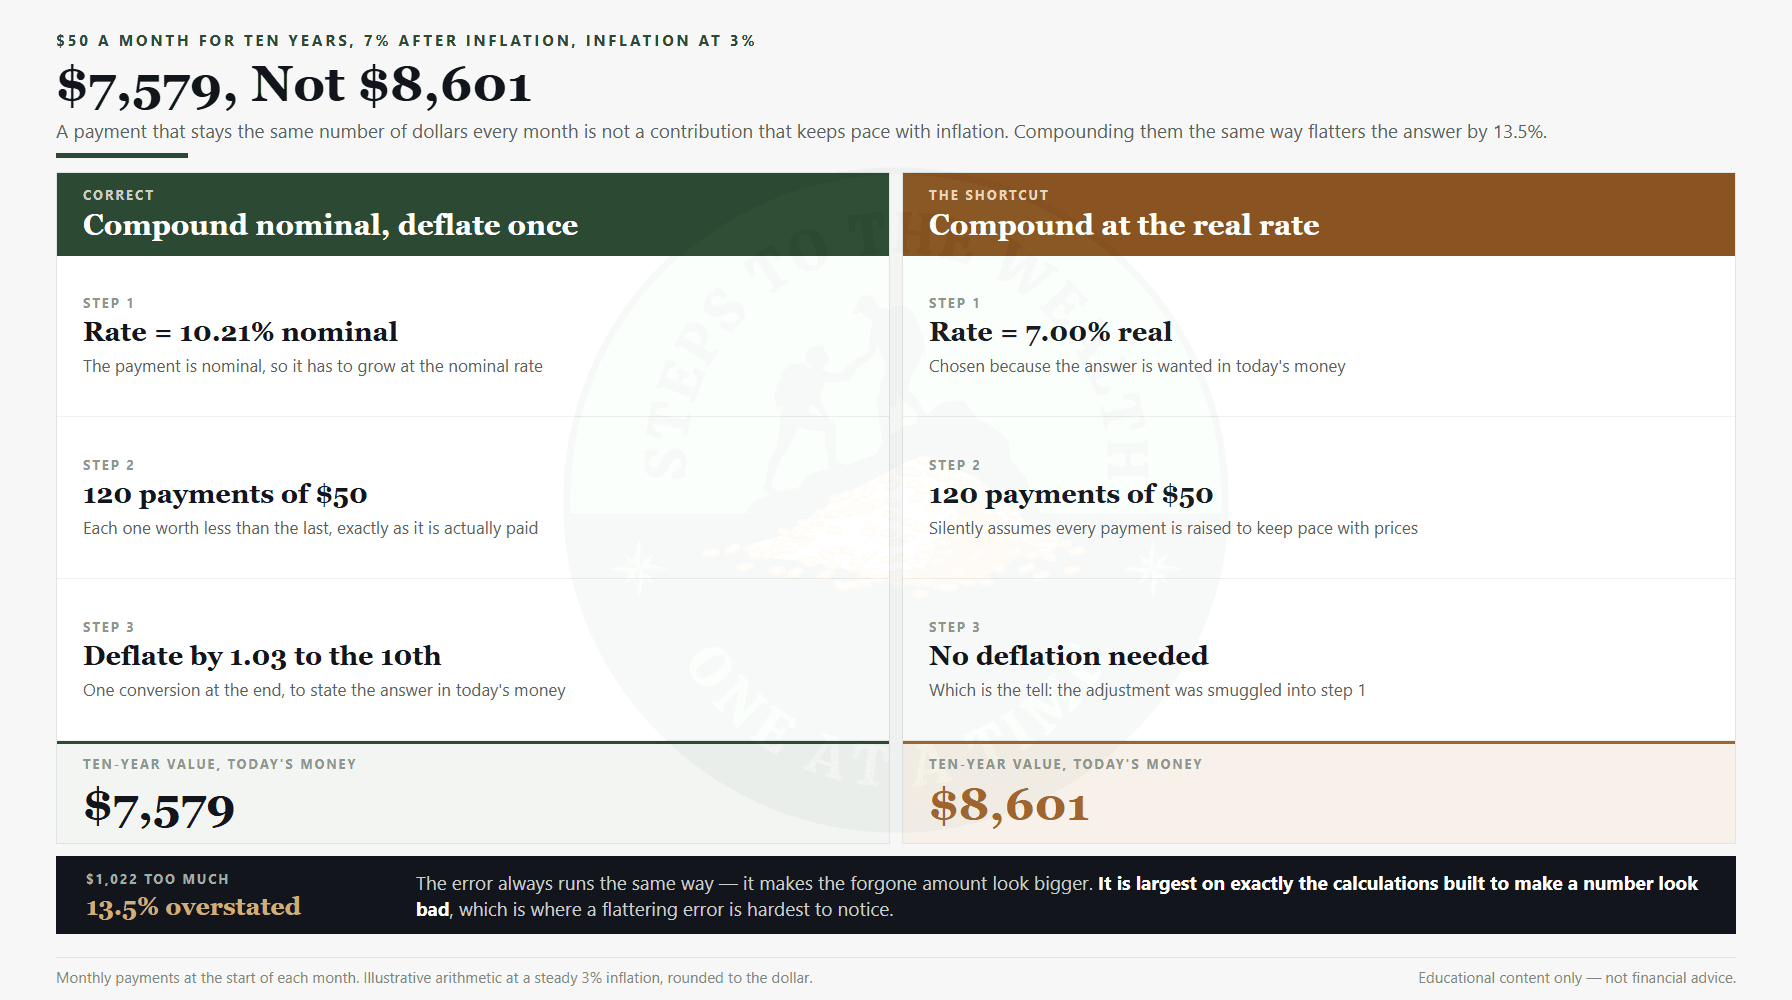
The correct route. The payment is nominal, so it has to grow at the nominal rate: 10.21%. A hundred and twenty payments of $50, each one worth slightly less than the last, exactly as they are actually paid. Then one conversion at the very end, dividing by 1.03 to the tenth, to state the answer in today’s money. Result: $7,579.
The shortcut. The answer is wanted in today’s money, so the real rate gets used from the start: 7%. A hundred and twenty payments of $50. No deflation at the end, because it feels like the adjustment has already been made. Result: $8,601.
That is $1,022 too much, a 13.5% overstatement, from a method that looks tidier than the correct one.
The reason is worth understanding rather than memorising. Compounding a payment stream at the real rate silently assumes the payer escalates every payment to keep pace with prices. A $50 subscription does not do that. It bills $50 forever, and each of those $50 payments is worth less than the one before. Using the real rate quietly upgrades your subscription into an inflation-linked one and then reports the result as though nothing happened.
Notice the direction. The error always makes the forgone amount look bigger, which means it is largest on exactly the calculations built to make a number look bad — the ones about what a habit is costing you. A flattering error inside an argument you already agree with is the hardest kind to catch. It is worth knowing that the subscription arithmetic and what a purchase actually costs are exercises where this distinction decides the headline figure.
Which rate does this projection need?
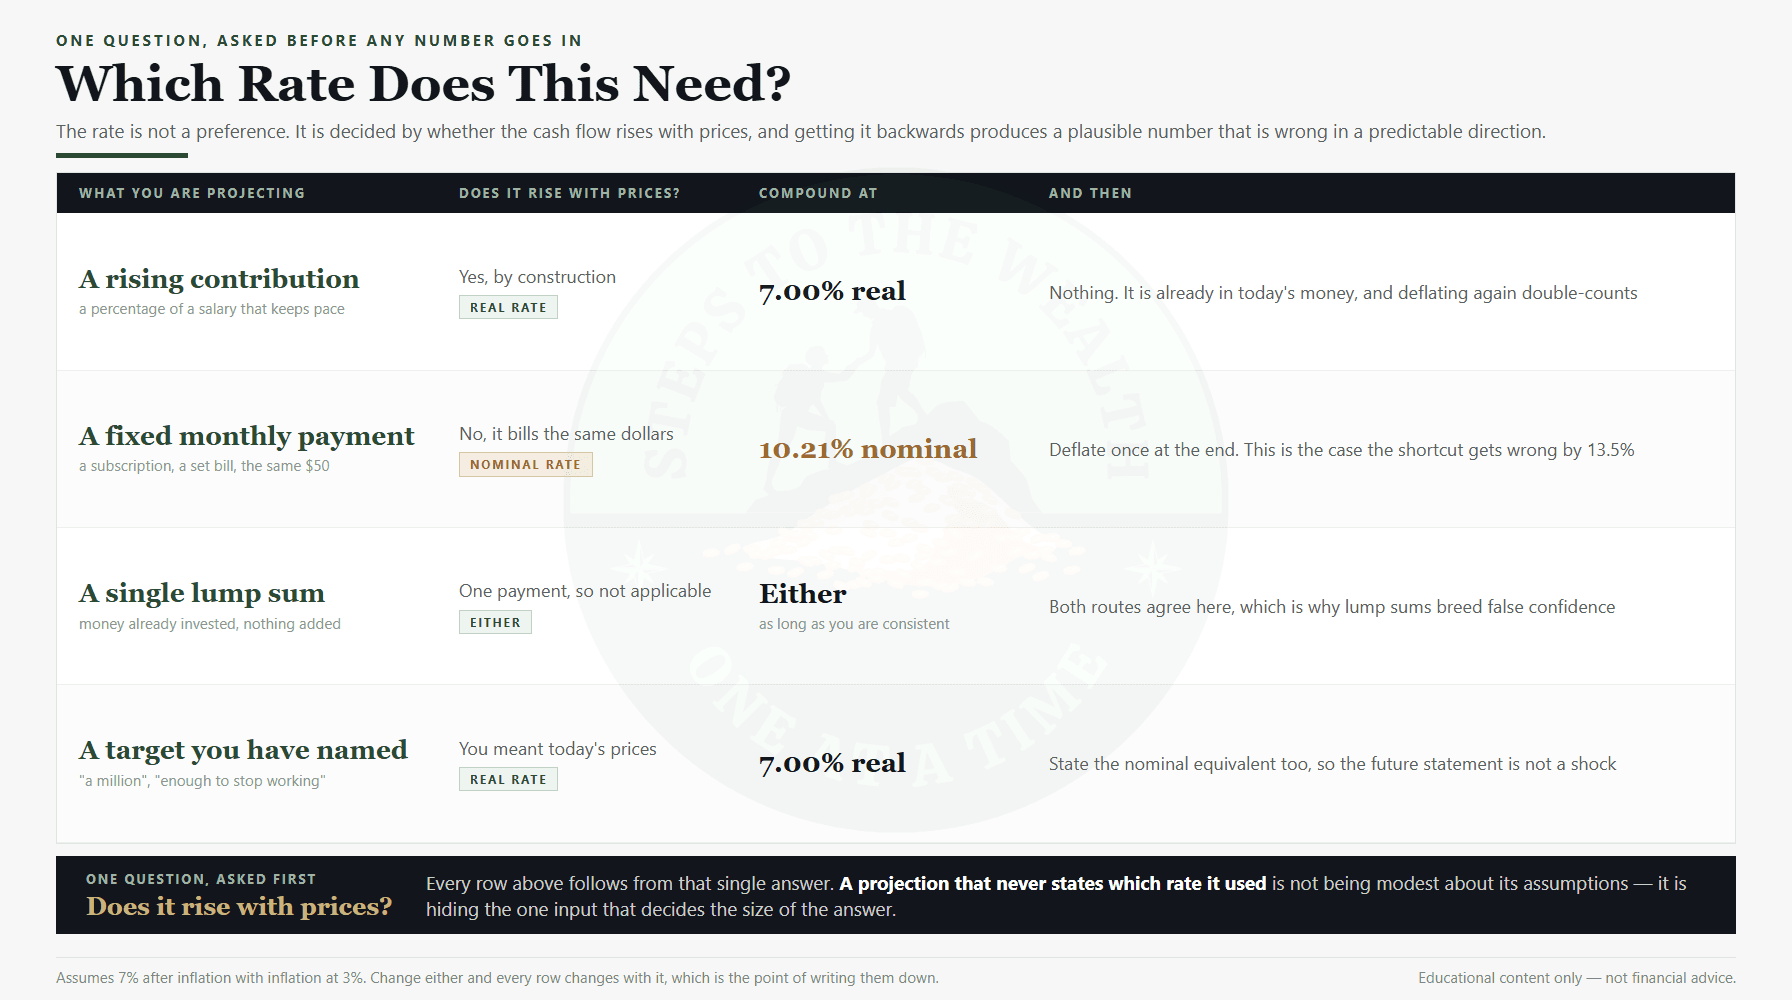
The rule is short: does the cash flow rise with prices?
A contribution you escalate — a fixed percentage of a salary that keeps pace — rises with prices by construction. Compound it at the real rate, 7%, and do nothing at the end. The answer is already in today’s money, and deflating it again double-counts.
A fixed monthly payment does not rise. Compound it at the nominal rate, 10.21%, and deflate once at the end. This is the row the shortcut gets wrong by 13.5%.
A single lump sum has no stream to escalate, so both routes agree. Use either, consistently. This row is the reason the confusion survives: people test the two methods on a lump sum, find no difference, and conclude the choice never matters.
A target you have named — “a million”, “enough to stop working” — was almost certainly meant in today’s prices. Work in real terms, then state the nominal equivalent as well, so that the number on a future statement is not a shock.
Every row follows from the one question. And a projection that never states which rate it used is not being modest about its assumptions; it is hiding the input that decides the size of the answer.
Three places this quietly changes the answer
The distinction is not academic. It changes the output of three calculations most working professionals run at some point, and in each case the error runs in a direction that feels reassuring.
The savings rate. A contribution set once and never revisited is a fixed nominal payment, whatever it was intended to be. Left alone for a decade at 3% inflation it is contributing 74.4 cents of real money for every dollar it started with, without a single decision having been made to reduce it. This is the quiet twin of lifestyle creep: spending drifts up while the contribution drifts down in real terms, and neither movement generates a moment where you notice. A contribution expressed as a percentage of income escalates by construction and does not have this problem, which is the strongest practical argument for defining it that way.
Anything a calculator tells you. Every projection tool has to pick a convention, and the useful ones say which. When you run numbers through the DCA simulator or any similar model, the first thing worth checking is whether the output is in today’s money or future dollars — because the same inputs produce two answers that differ by a factor of 2.43 over thirty years, and both are correct labels for different questions. A tool that does not tell you which one it is showing has left the most important assumption undocumented.
Comparisons against other people. Balances quoted for age brackets are nominal figures gathered at a point in time, so comparing a number you will have in fifteen years against what people your age have saved today compares two different currencies wearing the same symbol. It is not a small distortion. Over fifteen years at 3%, it is roughly a third of the value of the money.
None of these requires more sophistication. They require one line of bookkeeping: write down whether the number is real or nominal, next to the number itself, every time.
Why this matters more than the return assumption
People spend a great deal of energy arguing about whether to model 6% or 8%, and almost none on whether the number is real or nominal. The second question moves the answer further than the first.
Consider a thirty-year horizon. The gap between 7% real and 7% nominal, at 3% inflation, is the gap between $7.61 and $3.13 per dollar in today’s money — the second figure being $7.61 divided by the same 1.03 to the thirtieth that the first one already accounts for. Arguing 6% against 8% does not produce a difference of that size. Mislabelling the rate does, and it does so silently — the same way the lump sum against dollar-cost averaging question turns on assumptions people rarely state out loud.
It also changes what “on track” means. A plan that hits its nominal number and misses its real one has not succeeded quietly; it has failed in a way that will only become visible at the point where the money has to buy something. That is the difference between a plan gap you can still close and one you discover at the end.
And it changes what counts as a safe asset. An investment that returns less than inflation is losing purchasing power at a steady, unremarkable rate that produces no bad statements and no obvious moment of loss. Nominal thinking cannot see that at all, which is why cash held for years without a job attached is more expensive than it looks — a cost set out in what waiting actually costs. The regulator’s plain guide to asset allocation is a reasonable place to start on how much risk belongs in the portfolio at all.
What this framing does not fix
An honest account has to say where the arithmetic stops helping.
It does not make 3% inflation true. A steady rate is a modelling convenience, not a forecast. Real inflation arrives in bursts, and the years in which it runs hot are the same years in which everything else feels difficult. What the assumption buys you is a stated, checkable input rather than a hidden one.
It does not tell you your personal inflation rate. The basket that determines your cost of living is not the national basket. Housing, childcare and education have their own trajectories, and a household heavily exposed to one of them can experience something quite different from the published figure.
It does not make real returns predictable. Getting the conversion right removes an error you control. It says nothing about the return itself, which stays uncertain in exactly the way it was before — and a long grind can test that, as the 2008 case study shows.
And it does not replace the rest of the plan. Deciding the rate is a modelling question. How much you contribute, and whether the structure survives a bad decade, are separate ones — which is what a portfolio stress test exists to answer.
Frequently asked questions
What is the difference between a real and a nominal return?
A nominal return is the change in the number of dollars. A real return is the change in what those dollars buy. Nominal is what a statement reports; real is what actually happened to your position, and the two are separated by inflation over the period.
How do you convert a nominal return to a real one?
Divide rather than subtract: (1 + nominal) ÷ (1 + inflation) − 1. At 10.21% nominal and 3% inflation that gives exactly 7% real. Subtracting gets close at low rates and drifts as either number rises, which is why the multiplication is worth doing properly once rather than approximating it every time.
Should I plan in real or nominal terms?
Plan in real terms, because every goal you actually have is a statement about purchasing power, and because a plan that has to survive a full-time job needs a target you can actually check against. Then convert to nominal once, so the number you will eventually see on a statement is not a surprise. What matters is that the projection says which one it is using.
Why does the shortcut overstate by 13.5%?
Because compounding a fixed payment at the real rate assumes the payment rises with inflation, and a fixed payment does not. On $50 a month over ten years at 7% real and 3% inflation, the correct method gives $7,579 in today’s money and the shortcut gives $8,601. The gap is $1,022, and it grows with the horizon.
Does inflation affect all assets equally?
No, and that is a separate question from this one. This article is about measuring returns correctly once you have them, not about which assets respond to inflation in which way. Getting the measurement right first is what makes the second question answerable at all.
Should my monthly contribution rise every year?
If you want the plan to keep its shape, yes — and the simplest way is to define the contribution as a percentage of income rather than a fixed amount, so it escalates without a decision. What that escalation is actually worth, measured against a flat plan on real market history, is priced in increasing your contributions. A fixed amount is not neutral: at 3% inflation it is a contribution that shrinks in real terms every year you leave it alone. That is also what makes it eligible for the real-rate shortcut described above, and getting it wrong there overstates the result by 13.5% over ten years.
Does a 10% historical average mean 10% real?
No. Long-run averages quoted for equities are almost always nominal unless the source says otherwise, and the difference over a working life is the difference between the two columns in the figure above. Check what a quoted number is before building anything on it.
The one question, asked first
Inflation vs nominal returns is not a subtlety for people who enjoy spreadsheets. It decides the size of the answer, and it decides it in a predictable direction.
Multiply rather than add: 7% and 3% make 10.21%, and the missing 21 basis points removed $10,275 from a $10,000 position over thirty years. Then ask the single question that decides everything else — does this cash flow rise with prices? A contribution that escalates gets the real rate. A payment that stays the same number of dollars gets the nominal rate and one deflation at the end. Getting those backwards on a fixed payment overstates the result by 13.5%, in the direction that flatters whatever you were already arguing.
State which rate you used. That single line of disclosure does more for the honesty of a projection than any amount of precision in the return assumption, and it is the part almost everyone leaves out. It is also the discipline that keeps a plan honest across the decades where time in the market is doing the actual work.
If you want the weekly reading and the reasoning behind it, that is what the newsletter is for.
Educational content only. Not financial advice. All figures are illustrative arithmetic at a stated 7% after inflation with inflation at 3%, not forecasts, and both assumptions are yours to change. Individual circumstances, tax treatment and personal inflation rates vary.