
Every other number in a plan gets argued about. The contribution gets argued about. The horizon gets argued about. The asset mix gets argued about at length, usually by people who will change it again next year. Investment fees are the one input that reads as rounding, gets nodded at once on a fact sheet, and is never revisited.
A 1% annual charge sounds like a rounding error because it is quoted against the wrong thing. Quoted against a year, it is small. Quoted against a thirty-year plan, on a balance that is supposed to be growing the whole time, it is one of the largest single line items you will ever agree to — and unlike the market, it is the one you control.
This is what it costs, on closed arithmetic you can reproduce, and what it looks like when you price it as a thing you have to do something about.
What a 1% investment fee actually costs over thirty years
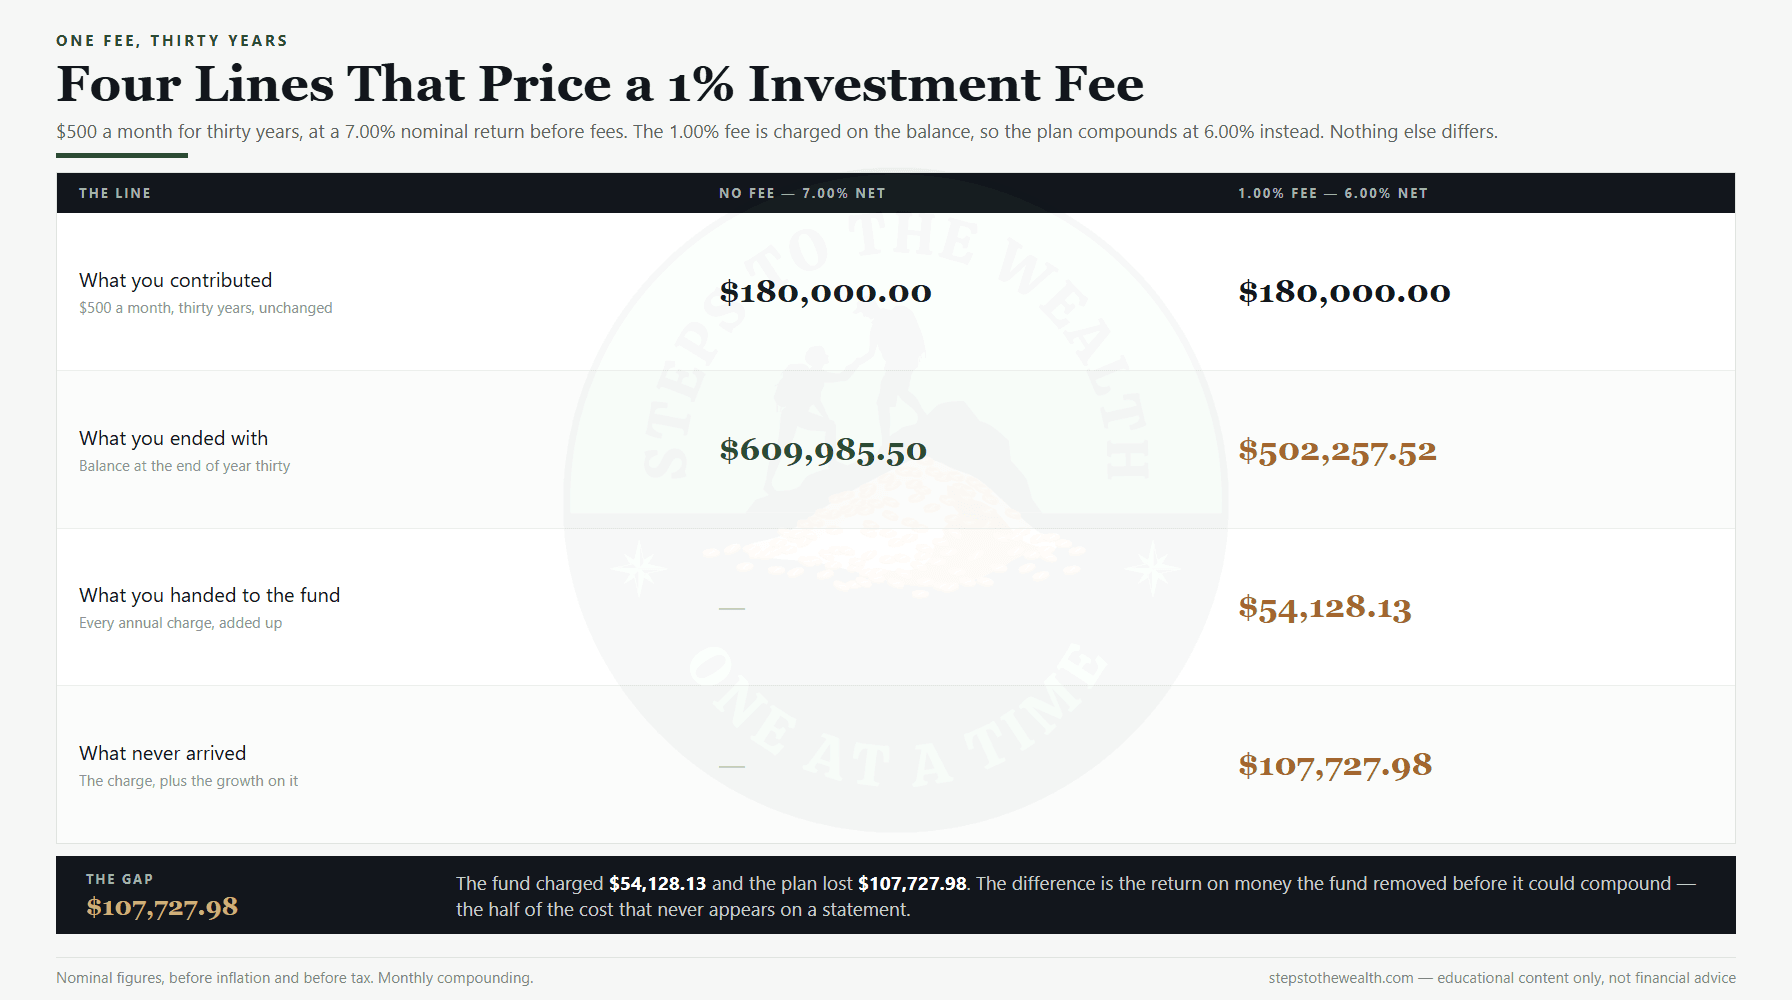
The setup is deliberately ordinary. $500 a month, every month, for thirty years. A 7.00% nominal return before any charge. Monthly compounding. No lump sum at the start, no raises, no missed months, no clever timing. Nothing in this example is doing any work except the fee.
A 1.00% annual charge, taken from the balance, means the plan compounds at 6.00% instead of 7.00%. That is the entire difference between the two columns below.
The plan with no charge ends at $609,985.50. The plan carrying 1.00% ends at $502,257.52. The difference is $107,727.98.
Hold that against what went in. You contributed $180,000 over those thirty years. The fee took a figure equal to 59.8% of everything you ever put in. Not 59.8% of the growth — 59.8% of the contributions themselves, measured in end-of-plan dollars.
That is the number that makes people assume the arithmetic is rigged. It is not. It is the ordinary consequence of removing a percentage from a balance every year for three decades, in a plan whose whole design depends on that balance being left alone to compound.
Why the loss is twice the charge
Here is the part that does the real damage, and it is the part almost nobody prices.
Add up every annual charge the fund took across those thirty years and it comes to $54,128.13. That is the money that actually left, the money a statement could in principle show you. But the plan did not lose $54,128.13. It lost $107,727.98.
The gap between those two figures — $53,599.85 — is not a second charge. It is the return that the first charge would have earned if it had stayed invested. Every dollar taken in year six is also a dollar that never compounded through years seven to thirty.
So the honest way to read a fee is: the number on the fact sheet is roughly half the bill. The other half is invisible by construction, because it is the growth on money that was never there to grow.
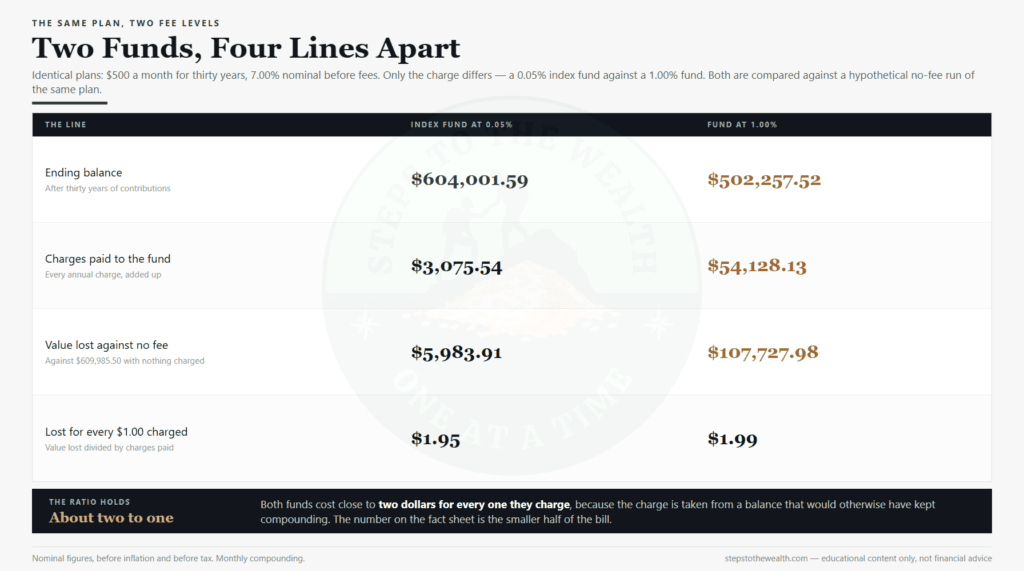
Run the same plan through a 0.05% index fund and the pattern repeats at a scale that barely registers: $3,075.54 charged, $5,983.91 of value lost, an ending balance of $604,001.59. The ratio is the same. The magnitude is not.
The difference between the two funds — $101,744.06 over the life of the plan — is what the phrase “0.95 percentage points” actually means when you stop quoting it as a percentage and start quoting it in money.
The charge is on the balance, not on the gain
Most costs in a financial life announce themselves. A subscription leaves your account on a date. Interest is quoted before you sign. Even tax, however unwelcome, arrives with a number attached.
A fund charge does none of that. It is deducted from the assets before the price you see is published, so the balance on your screen is already net of it. Nothing is ever debited. Nothing needs approving. The number simply grows more slowly than it otherwise would, in a way no single statement can show you, because there is no counterfactual statement to compare it against.
And the size of that deduction is not fixed. The percentage is fixed. What it is charged on is the balance, and the balance is the thing your plan spends thirty years trying to make large.
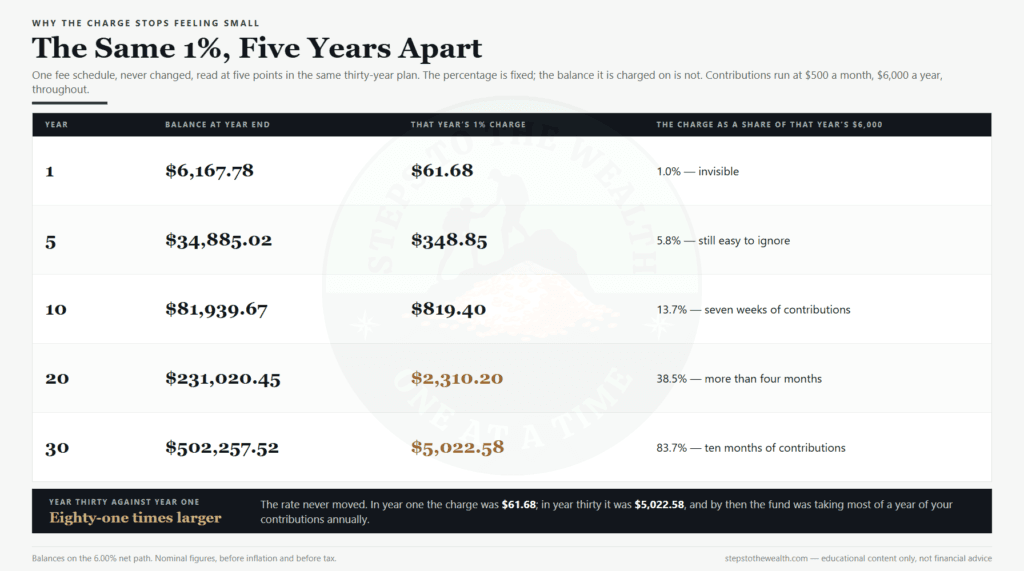
In year one the charge is $61.68 — about 1% of a year’s contributions, genuinely trivial. In year ten it is $819.40. In year twenty it is $2,310.20. In year thirty it is $5,022.58, which is 83.7% of everything you contribute that year.
By the end of the plan, the fund is taking most of a year’s saving annually, and the rate has not moved once. You are, in a real sense, hiring a second contributor who works against you and whose salary rises with your success.
This is also why “I will look at fees once I have some real money” gets the timing exactly backwards. The years when the charge is small are the years when fixing it is cheap and easy. The years when it is obviously large are the years when the damage is already done.
What the fee looks like priced as a contribution
A loss of $107,727.98 in thirty years is a real number, and it is also a number nobody can act on this week. It is too far away and too abstract. So price it the other way round: hold the goal fixed and ask what the fee does to the work.
Take a target of $600,000 in thirty years, starting from nothing. At a 7.00% return the plan needs $491.81 a month. Put the same goal against 6.00%, which is what is left after a 1% charge, and it needs $597.30 a month.
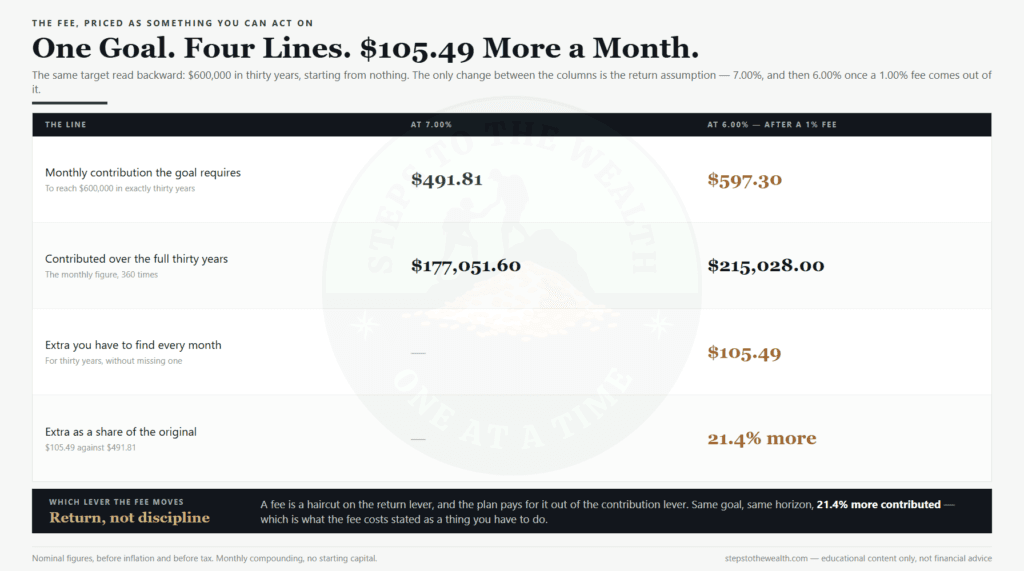
The fee costs $105.49 a month, every month, for thirty years. That is 21.4% more contributed for the identical outcome. Over the full horizon it is $215,028.00 paid in rather than $177,051.60.
Stated that way it stops being an abstraction about compounding and becomes a question with an answer: is the fund doing something for you that is worth $105.49 a month? Sometimes it genuinely is. Often nobody has ever asked.
This is also the cleanest way to run it on your own numbers. Our free Plan Gap calculator solves a plan backward — you give it a target, a horizon, a return assumption and what you are contributing now, and it returns the contribution the goal actually requires, plus the three levers that close the gap.
To price your own fee, run it twice. Once at your return assumption, once with the fee subtracted from that assumption. The change in the required monthly contribution is what the charge costs you, in the units you actually manage. Use the same figure on both sides of the comparison; the gap should come from the fee, not from a more optimistic view of markets. And note that the tool asks for a real return, meaning after inflation — see our note on nominal versus real returns for why that distinction matters more than most people assume.
Where the number you are actually paying is hidden
Almost everyone underestimates what they pay, and not because they are careless. The total is genuinely split across places that never appear on one page together.
The fund charge is the visible one: the ongoing charge or expense ratio quoted on the fact sheet. It is deducted from fund assets, so it never appears as a transaction — and it is not the whole gap between the fund and its index, which is the subject of index fund tracking error.
The platform or account fee sits on top of it, sometimes as a percentage of assets, sometimes as a flat annual amount, sometimes as both with a cap.
An advice or management fee is a third layer where one applies, and it is usually the largest of the three.
Then there are transaction and spread costs inside the fund, which are real and are not always in the headline figure, and any performance fee arrangement, which changes the shape of the deal rather than just its size.
Add them honestly. A “cheap” 0.20% fund inside a 0.45% platform inside a 1.00% advice relationship is not a 1.00% arrangement. It is 1.65%, and on the plan modelled above that is a materially worse outcome than the 1.00% column.
The SEC investor education material on fees is a reasonable primer on what the layers are and what questions to ask about them.
What the same arithmetic says at other fee levels
Most people reading this are not paying exactly 1.00%, so the useful version is the whole curve rather than the one point. Same plan throughout: $500 a month, thirty years, 7.00% before charges, and every loss measured against the same $609,985.50 no-fee run.
At 0.25%, the plan ends at $580,732.93 and the charge has cost $29,252.57, or 4.8% of the fee-free outcome. At 0.50% it ends at $553,089.04, having cost $56,896.45. At 1.00% it is the $107,727.98 already priced above.
At 1.50% the plan ends at $456,805.95, down $153,179.55 — a quarter of the fee-free result. At 2.00%, which is not an unusual total once an advice layer sits on top of a platform and a fund, it ends at $416,129.32 and the arrangement has cost $193,856.18, or 31.8%.
Two things fall out of that list. The first is that the relationship is not quite linear: doubling the fee from 1.00% to 2.00% costs $86,128.20 more, slightly less than double, because the smaller balance is also charged less in absolute terms. Being charged more is never good news, but the drag does decelerate.
The second is more useful. Around the middle of that range, every 0.10 percentage points is worth roughly $11,900 over the thirty years. That is the number to hold when comparing two funds that look identical apart from a decimal place. A tenth of a point is not noise; on this plan it is a used car.
Questions this usually raises
Is a 1% fee ever worth paying? Sometimes, and the test is whether it buys something you would otherwise have to buy or would fail to do. Tax handling, a genuinely different asset exposure, or a structure that stops you liquidating in a drawdown can all be worth more than the charge. A quarterly report and a phone number generally are not.
Does a low fee mean a better fund? No. It means a smaller certain drag. Everything else about the fund — what it holds, how it behaves in a fall, whether it does what it says — is a separate question, and a cheap fund holding the wrong thing for you is still the wrong thing. The point of the arithmetic is that the fee is the part you can know in advance.
My fee is charged monthly, not annually. Does that change it? Not materially. The example above deducts the charge as the balance compounds monthly, which is how most arrangements actually work. Quoting it annually is a convention, not a description of the mechanics.
I am twenty years in. Is it too late to bother? The remaining horizon is what the arithmetic runs on, so a shorter one means a smaller number — but it is running on the largest balance you have ever had, which is why the annual charge is at its peak. Ten years at 1% on a balance in the hundreds of thousands is still a five-figure decision.
What this arithmetic does not say
A chart with two diverging lines has an obvious rhetorical use, and this one is not built for it. Several things this does not establish, and they matter.
It does not say that a fee is theft, or that every fund charging 1% is doing nothing. It says the charge has a size, that the size is bigger than it looks, and that it should be compared against what is being delivered. That comparison sometimes comes out in the fund’s favour.
It does not model performance. The whole example assumes both plans earn 7.00% before charges, which is exactly the assumption a fund arguing for its fee would dispute. If a manager reliably adds more than the charge, the arithmetic here runs in reverse. Whether that is happening is an empirical question about your specific fund, and it is not answered by any figure on this page — the honest version of that question is covered in how to measure what your plan is actually returning.
It does not model tax, which in many arrangements is larger than the fee and which is entirely specific to where you live. It does not model inflation: every figure here is nominal, which is the correct treatment for fixed nominal contributions, but it means $107,727.98 in year thirty does not buy what $107,727.98 buys today.
And it uses one return assumption throughout. Real markets do not deliver 7.00% in a straight line, and the order in which returns arrive changes outcomes in ways a smooth curve cannot show. That is a different failure mode, and it is the one sequence of returns risk deals with.
What survives all of those caveats is narrow and durable: for a given return, the fee is a fixed, knowable, compounding drag, and it is the only variable in the list you can change today with a form.
Why this is the highest-certainty decision in a plan
Most of what an investor does is a bet on an uncertain future. Which assets. What weights. When to add. Whether this drawdown is the one that matters. Every one of those decisions is made with incomplete information, and the honest version of most of them ends in a probability rather than an answer.
The fee is not like that. It is contractual. It is disclosed. It applies whether the market rises or falls, whether you are right or wrong, whether you look at the account or never open it again. There is no scenario in which the charge does not apply.
That makes it the rarest thing in a portfolio: a large, certain, negative number that you can reduce by filling in a form, with no forecast required and no view about markets at all.
It also compounds in the direction you are least equipped to notice. A bad year announces itself — the balance falls, you feel it, you make a decision about it. A fee does the same damage silently and gets no attention at all, because nothing on the screen ever goes down because of it.
If you are building wealth in the background of a career you are not planning to leave — the situation most of this framework is written for — that asymmetry is the whole argument. You have limited attention for this. Spend it on the decisions that are both large and certain first.
The check worth doing this week
This does not require a project. It requires about twenty minutes and a willingness to write down a number you may not enjoy.
One. Find the total. Not the fund charge alone — the fund charge, plus the platform or account fee, plus any advice fee. One figure, as a percentage of assets. If a provider cannot give it to you as a single number, that is itself information.
Two. Price it. Subtract it from your return assumption and run your plan at both rates. The change in the required contribution is the fee, expressed as work you have to do. On the numbers above, 1.00% was $105.49 a month.
Three. Ask what it buys. Some fees purchase something real: access, structure, tax handling, a behavioural buffer that stops you selling at the bottom. Some purchase a quarterly PDF. The arithmetic does not distinguish between them. You have to.
Four. If it is not buying anything, check the exit before you move. Transfer costs, exit charges, lock-ins and any tax consequence of switching are real, and they are one-off against a saving that recurs for decades — but they have to be counted, not assumed away.
Five. Write the figure down and re-read it in a year. Fee schedules change quietly, and platforms rarely write to tell you the number went up.
That is the whole exercise. It is not sophisticated and it is not an investing strategy. It is the one decision in the plan where the answer is knowable in advance, which is exactly why it is worth doing before the interesting decisions get any attention at all.
The short version
A 1% charge on a $500-a-month plan over thirty years costs $107,727.98 against a no-fee run — while the fund itself only collects $54,128.13. The gap is the growth on money that was removed before it could compound, and it makes the fact-sheet number roughly half the true cost.
The charge scales with the balance, so it is smallest exactly when it is cheapest to fix and largest once fixing it is worth the most. Priced as work rather than as a loss, 1.00% is $105.49 a month on a $600,000 goal, or 21.4% more contributed for the same result.
It is the one large number in a plan that does not depend on being right about anything. That is the reason to check it first, not last.
Educational content only — not financial advice. Every figure here is a worked example on stated assumptions, not a projection, and your own arrangement will differ.
Want the framework rather than the forecast? The free Sunday email is a risk-first system for working professionals, and joining sends you the one-page Dynamic DCA Blueprint. Or start with the free calculators and price your own decisions first.