
Two funds track the same index. Over five years, one hands you the index return minus 5 basis points a year. The other hands you the index return minus 25. Nothing about the second fund looks worse on a fact sheet. Its published charge can be the lower of the two. Its performance chart is indistinguishable at the scale anyone actually looks at it. And across a thirty-year contribution plan it will quietly cost you more than eleven percent of every dollar you put in.
The number most people reach for to catch that is index fund tracking error, because it is the one with the word tracking in it. It is the wrong number. Tracking error measures dispersion — how much the gap between the fund and the index wobbles from one year to the next. It does not measure the gap. A fund can have a beautifully small tracking error and be costing you at a perfectly steady rate, and the steadiness is exactly what makes the number look reassuring.
What follows is the distinction that actually prices a fund, the five line items that sit between the published expense ratio and the gap you really paid, the second cost that appears in neither number, and the break-even that decides which of two funds is cheaper for you specifically. Every figure here is closed from assumptions stated on the page. None of them is a measured fund, and none of this is a recommendation about any product.
What index fund tracking error actually measures, and what it does not
Two quantities describe the relationship between a fund and the index it follows, and they are routinely used as if they were one.
Tracking difference is the level. For a given period it is the index return minus the fund return, and it carries a sign. Positive means the fund delivered less than the index. That is the number that came out of your account.
Tracking error is the dispersion. It is the standard deviation of those period-by-period differences. It answers how consistent the gap has been, not how large it was. Take the average out of a series and the standard deviation does not move at all, which is precisely the property that makes it useless as a price.
The chain runs in one direction only. To know what a fund cost you, you need the level. Tracking error discards the level by construction. So a fund can be ranked well on tracking error and badly on the only thing you pay, and no amount of staring at the first number will tell you about the second.
Twenty basis points, and the dispersion prices none of it
Take two funds tracking the same index for five years. Fund A trails by 5, 7, 3, 6 and 4 basis points. Fund B trails by 25, 27, 23, 26 and 24. Fund B is Fund A shifted up by exactly 20 basis points in every single year, so the two series have identical spread around their own averages. Their tracking error is the same number to two decimals: 1.58 basis points each.
Their tracking difference is not the same number. Fund A averages 5.00 basis points a year and Fund B averages 25.00 — five times as much. On the metric named after tracking, these two funds are twins. On the metric you actually pay, one of them is five times the other.
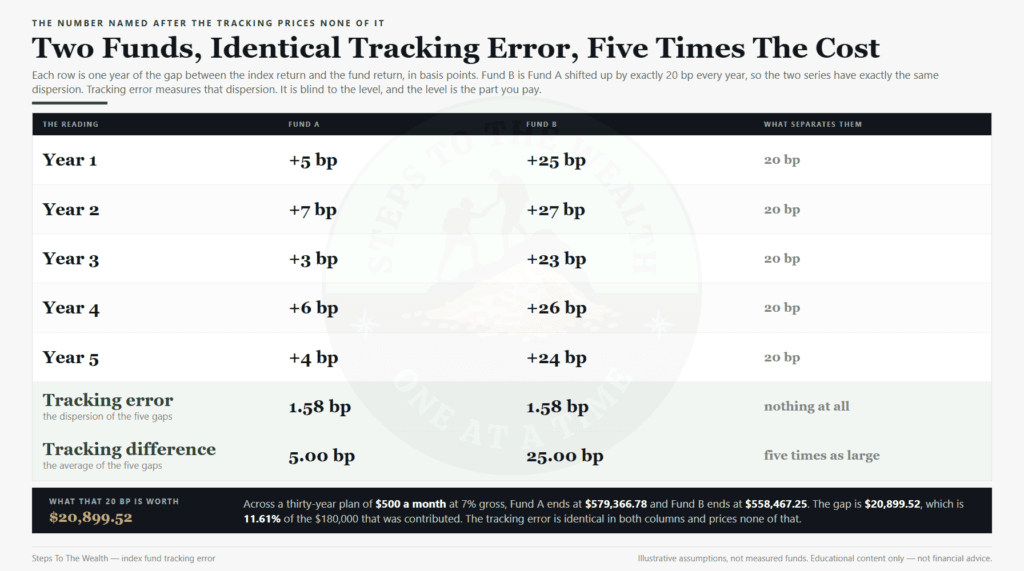
Price the difference. Run a level plan of $500 a month for thirty years at 7% gross. Fund A ends at $579,366.78. Fund B ends at $558,467.25. The gap is $20,899.52, which is 11.61% of the $180,000 that was contributed over those three decades. Twenty basis points a year, invisible on any chart, took an eighth of the money that was saved.
This is the same arithmetic that makes a headline charge so expensive over a long horizon, worked through in detail in what a 1% investment fee actually costs over thirty years. The mechanism does not care whether the drag is labelled a fee. It only cares that it is charged on the balance, every year.
None of this makes tracking error worthless. It answers a real question: how predictable is the gap. A fund with a wide tracking error may deliver the index return in one year and lag badly in the next, which matters if you might need to sell at a specific moment. But predictability is not price. Use it to judge reliability, never to judge cost.
The expense ratio is one line in a ledger of five
Here is the second thing that gets collapsed. Even when people correctly go looking for the tracking difference, they assume it should equal the published expense ratio. It never does, and the reason is that the ratio prices one line of a ledger that has at least five.
The expense ratio is what the manager charges to run the fund. It is the only line that is published as a single, prominent number.
Index turnover is the trading the fund is forced to do when the index itself changes its constituents. Somebody has to buy the additions and sell the deletions, and that trading costs money. It is not in the ratio.
Cash and dividend timing is money sitting uninvested between the moment it arrives and the moment it is put back to work. The index assumes instant reinvestment. A real fund cannot do that. Also not in the ratio.
Securities lending revenue runs the other way. A fund that lends its holdings out earns a fee for doing so, and where that revenue is returned to the fund it is a credit against everything above it.
Sampling difference is what happens when a fund holds a representative subset of the index rather than every constituent. It can go either way in a given year, and it is noise rather than a systematic charge.
When the printed ratio ranks two funds in the wrong order
The five lines do not merely add noise to the headline number. They can reverse it.
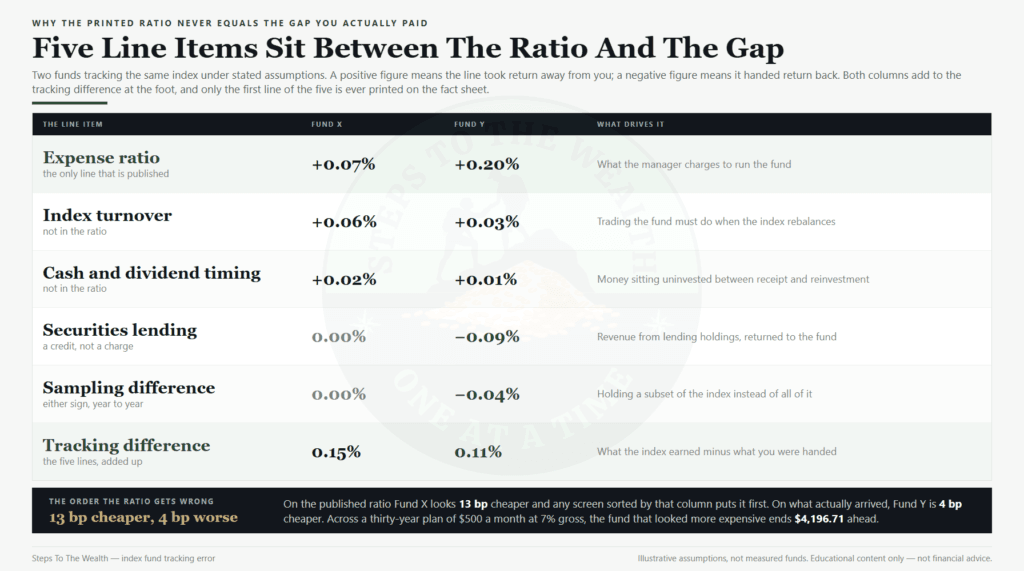
Suppose Fund X charges 0.07% and, because it fully replicates a high-turnover index and lends nothing out, adds 0.06% of turnover cost and 0.02% of cash drag. Its tracking difference is 0.15%. Suppose Fund Y charges 0.20% but samples the index, trades less, and returns 0.09% of lending revenue to holders. Its lines are 0.20% plus 0.03% plus 0.01% minus 0.09% minus 0.04%, and its tracking difference is 0.11%.
On the published ratio, Fund X looks 13 basis points cheaper. Any screen sorted by that column puts it first, and most screens sort by that column. On what actually arrived in the account, Fund Y is 4 basis points cheaper. Across the same thirty-year plan of $500 a month, the fund that looked more expensive ends $4,196.71 ahead.
Those figures are constructed, and the whole point of the exercise is that they are internally consistent rather than measured. The mechanism, though, is not constructed. Lending revenue genuinely does offset a management charge. Turnover cost genuinely is excluded from the ratio. The regulator’s own primer on how mutual funds charge and report is worth ten minutes if you have never read it end to end.
The practical rule that falls out is short. Rank funds by the realised gap between index and fund, not by the ratio. If you cannot find that gap, you are ranking on one line of five.
The cost that appears in neither number
Everything above is charged on the balance and accrues with time. There is a second cost with completely different mechanics, and it appears in neither the expense ratio nor the tracking difference.
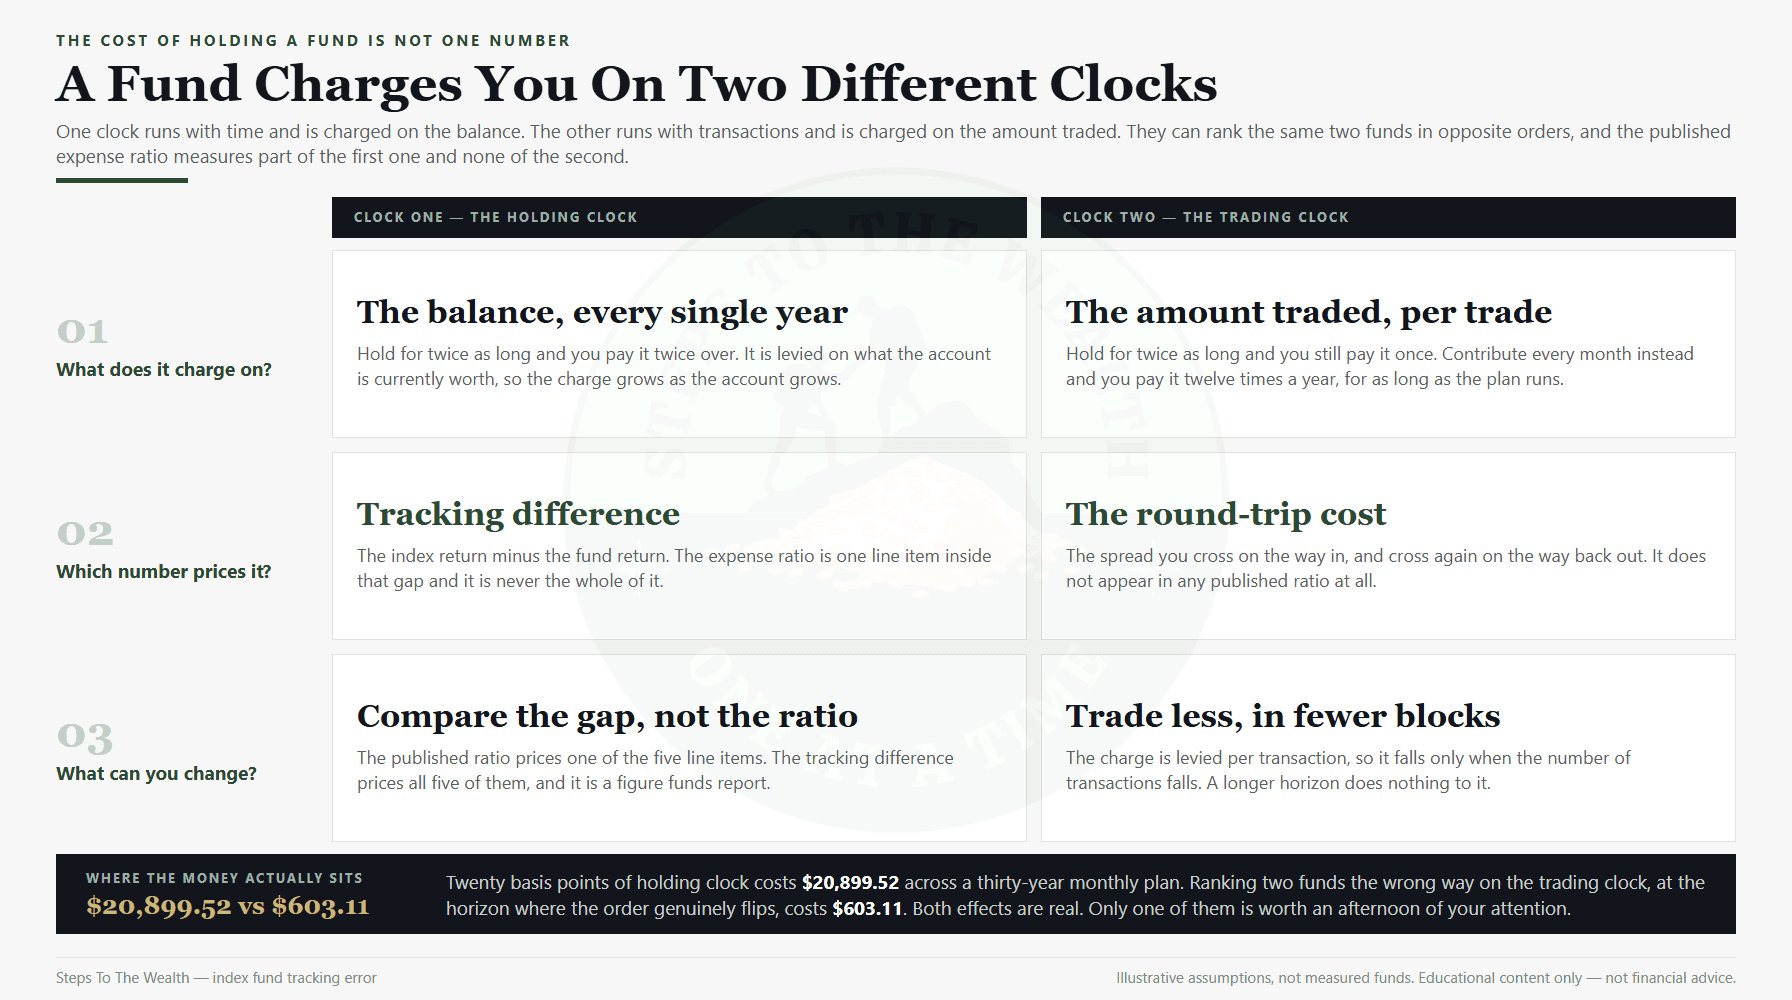
To own a fund you first have to buy it, and to stop owning it you have to sell it. On an exchange-traded fund you cross a spread in both directions, and you may also pay a premium to, or accept a discount from, the value of the underlying holdings at that moment. Call the two together the round-trip cost. It is levied per transaction, on the amount traded. Holding for another decade does not increase it. Holding for another decade does not reduce it either.
So a fund charges you on two clocks that behave in opposite ways. One runs with time and is charged on a growing balance. The other runs with transactions and is charged on the amount moved. The published ratio measures part of the first and none of the second.
The break-even that decides which fund is actually cheaper
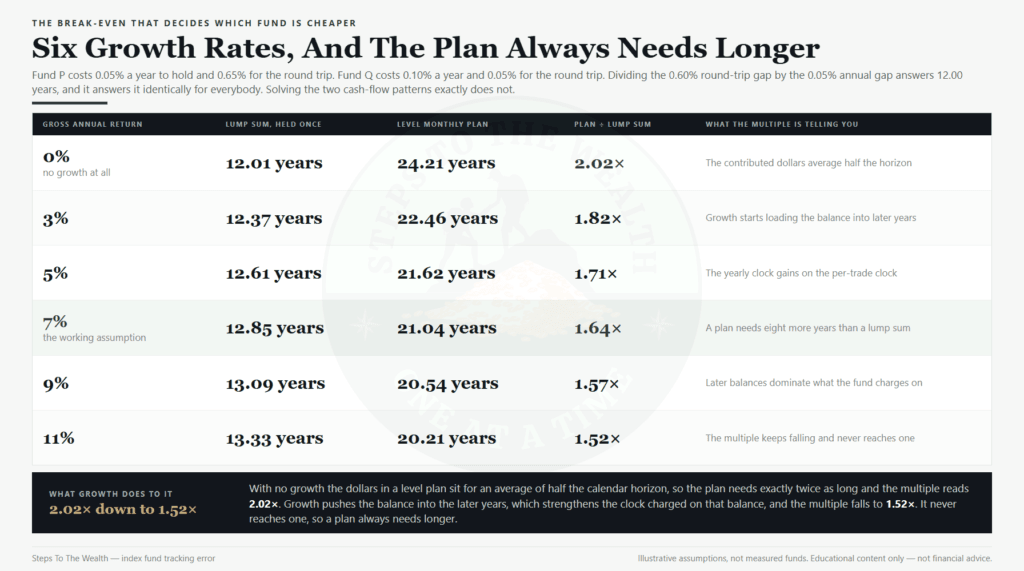
Two clocks means two funds can be ranked either way, and there is an exact horizon where the ranking flips. Suppose Fund P costs 0.05% a year to hold but 0.65% for the round trip. Fund Q costs 0.10% a year but only 0.05% for the round trip. P is cheaper to hold and dearer to trade.
Set the extra round-trip cost against the annual saving and solve. The round-trip gap is 0.60% and the annual gap is 0.05%, so the naive break-even is 0.60 divided by 0.05, which is 12.00 years. Hold longer than that and the cheaper-to-hold fund wins. Hold for less and the tighter-spread fund wins.
Solve it properly for a lump sum that is bought once, held, and sold once, at 7% gross, and the answer is 12.85 years rather than 12.00. The naive rule is a decent approximation for a single purchase. It is not an approximation at all for the way most people actually invest.
Why a monthly plan needs a longer horizon than a lump sum
A contribution plan does not buy once. It buys every month, so it pays the entry side of the round trip on every contribution, for as long as the plan runs. Meanwhile each contributed dollar only gets to enjoy the lower annual cost for its own remaining life, not for the full calendar horizon.
That shifts the break-even a long way. On the same two funds at 7% gross, the level monthly plan does not break even at 12.85 years. It breaks even at 21.04 years — a multiple of 1.64 on the lump-sum answer. Across four other pairs of assumed funds the multiple lands between 1.62 and 1.91. It is never one.
The reason it is not exactly two is worth a sentence, because two is where the intuition lands. In a level plan the contributed dollars sit for an average of half the calendar horizon, so with no growth at all the plan needs precisely twice as long. Solve it at 0% and the multiple reads 2.02. Growth changes it, because growth loads the balance into the later years and the annual clock is charged on that balance. At 7% the multiple falls to 1.64, and at 11% to 1.52. It falls as growth rises and never reaches one.
Which means the practical version is simple. If you contribute monthly rather than investing once, roughly double whatever horizon a break-even rule hands you before deciding the cheaper-to-hold fund is the right pick. The same asymmetry between a single purchase and a repeated one shows up whenever you compare the two patterns, which is the ground covered in time in the market versus timing the market.
What this changes for a plan that contributes every month
Here is where honesty matters more than the arithmetic. The two clocks are both real, and they are not remotely the same size.
Getting the holding clock wrong by 20 basis points cost $20,899.52 in the first example. Getting the trading-clock ranking wrong, at a 17-year horizon where the order genuinely flips, costs about $603.11 on a $100,000 lump sum — and around $248.79 on the monthly plan. Both are real numbers from the same model. One is roughly thirty times the other.
Near a break-even, by definition, the two funds are almost identical, so the money at stake there is small. That is not a flaw in the arithmetic; it is what a break-even is. The conclusion is that the ordering question deserves a few minutes and the level question deserves the afternoon.
So the priority list is short. Find the realised gap between index and fund, and compare funds on that. Only then look at the spread, and only if you are trading often or the fund is thinly traded. If you are contributing monthly into a broad fund for two decades, the spread is a rounding error next to one missed contribution and the annual gap is not.
This is also why cost is the part of a plan worth being rigid about. You cannot reliably add two points of return through better selection. You can reliably stop losing them, which is the argument made at length in the small investing mistakes that compound, and it is why a rules-based approach beats a discretionary one on the things that are actually within your control.
What this arithmetic does not say
These are not measured funds. Every figure in this article is closed from assumptions stated on the page. The mechanisms are real and the arithmetic is exact given those inputs, but no number here should be treated as a description of any actual product.
Tracking difference is backward-looking and it moves. A fund’s realised gap last year is evidence about its structure, not a promise about next year. Index turnover changes, lending markets change, and a sampled fund’s error is noise by construction. Read several years, not one.
It ignores tax entirely. Where a fund is domiciled relative to where its holdings pay out can move the realised gap by more than every line item discussed here. That interacts with your own circumstances and is genuinely outside what a general article can price.
It says nothing about whether the index is right. Choosing a cheaper wrapper for the wrong exposure is a rounding error on a larger mistake. What the fund actually holds — and what owning it entitles you to — is the prior question, covered in what you actually own when you buy a fund and in how diversification reduces risk.
Frequently asked questions
What is the difference between tracking error and tracking difference?
Tracking difference is the index return minus the fund return for a period, a signed level that tells you what the fund cost you. Tracking error is the standard deviation of those differences, which tells you how consistent the gap has been. Shifting a whole series up or down changes the difference and leaves the error untouched, which is why the error can never price a fund.
Should index fund tracking error ever affect which fund I choose?
Yes, but for reliability rather than cost. A wide tracking error means the gap in any single year is less predictable, which matters if you may have to sell at a specific moment rather than at a moment of your choosing. If your horizon is long and your selling is flexible, rank on the tracking difference and treat the error as secondary.
Why is the tracking difference larger than the expense ratio?
Because the ratio prices the management charge and nothing else. Index turnover costs and cash or dividend timing sit outside it and push the gap wider, while securities lending revenue and sampling can push it narrower. The published number is one line of a ledger with at least five in it, so the two agreeing would be the surprise.
Can a fund with a higher expense ratio genuinely be cheaper?
It can, and the example above is constructed to show exactly how: a 0.20% fund landing at a 0.11% realised gap against a 0.07% fund landing at 0.15%. Whether it happens with any two specific funds is an empirical question you answer by reading their realised gaps over several years, not by reasoning from the ratios.
Does the spread matter if I invest a fixed amount every month?
It matters more than it does for a lump sum, because you pay the entry side on every contribution rather than once. But it is still the smaller of the two clocks for a long-horizon plan in a liquid fund. Double whatever break-even a naive rule gives you, and if your horizon still clears it comfortably, the annual gap is where your attention belongs. The same horizon test decides whether a tilted fund is worth its extra cost at all, which is the arithmetic factor investing runs.
The check worth doing this week
Pull up whatever broad fund you hold the most of. Find its published expense ratio, then find its realised return next to the index’s realised return for the last three full calendar years and subtract. That difference, averaged, is what it actually cost you. Compare it with the ratio you were quoted.
If the two are close, you have learned something useful and it took ten minutes. If the gap is materially wider than the ratio, you have found a line item worth understanding before you contribute for another decade. Either way you now have a number that prices the fund, instead of one that describes how steadily it does whatever it does.
If you want the weekly version of this — the risk readings and the arithmetic behind them, without a sales pitch attached — the Sunday newsletter is where it goes out. And if you would rather test how a cost assumption changes a real contribution schedule, how to backtest a DCA plan walks through the setup.
Educational content only — not financial advice. Every figure in this article is derived from assumptions stated on the page and does not describe any specific fund or product.