
A factor tilt is the most respectable-looking decision a working professional ever makes. It is not a stock pick. It is not a market call. It is a rule — sort the index by one measurable characteristic, hold more of the end that has historically paid more. It arrives with academic papers attached, and it costs about the same as the broad fund you already own.
Factor investing is the practice of tilting a portfolio toward a measurable characteristic — value, size, momentum, quality, low volatility — because that characteristic has, on average and over long samples, earned a premium above the broad market. The evidence is real. The papers are real. The funds are real and cheap.
None of that is the question worth asking. The question worth asking is arithmetic: how long do you have to hold a tilt before the premium is distinguishable from noise? A premium that is real over ninety years of data and invisible over your actual holding period is not an edge you can spend. It is a fact about a dataset.
This article runs that number. Not the debate about whether factors exist — the arithmetic that decides whether a real one can show up inside a horizon you will actually hold.
Educational content only. Not financial advice.
What factor investing actually is
Start with what a factor fund is not. It is not a manager choosing companies he likes. It is not a forecast about next year. It is an index fund whose index sorts on something other than size.
A broad index fund sorts by market capitalisation: the bigger the company, the bigger your slice. A factor fund replaces that single sorting rule with another one, or layers a second rule on top. Sort by price relative to book value and hold the cheap end, and you have a value tilt. Sort by market capitalisation and hold the small end, and you have a size tilt. Sort by trailing twelve-month return, by earnings stability, or by realised volatility, and you get momentum, quality and low-volatility tilts.
That is the whole mechanism. The tilt is a sorting rule, and the promise attached to it is that the end you hold has historically returned more than the whole list did. The academic record behind those sorts is public: the Ken French data library publishes the monthly factor return series that nearly every paper on the subject is built from.
Two consequences follow immediately, and both matter more than most tilt decisions account for.
First, a tilt does not add a new asset. It re-weights the one you already hold. If you own a broad fund and add a value fund, you now own many of the same companies twice, at different weights. That is fund overlap, and it means your effective number of real bets moves far less than the number of tickers in your account suggests.
Second, the tilt is defined entirely by the difference between two portfolios. Nobody earns “the value premium” in isolation. You earn the broad market return, plus or minus whatever the tilt did relative to the broad market that year. Everything that follows is about that second term — the spread — because it is the only part the tilt controls, and the only part you are paying for. If you have not yet worked out what sits inside the fund itself, what you actually own is the prior question.
The premium is an average, not a payment schedule
Here is where most factor investing decisions quietly go wrong. A premium quoted as “roughly three points a year” is a long-run mean across a very long sample. It is not an annual payment. It does not arrive in instalments.
The spread between a tilted portfolio and the broad market is itself volatile — often as volatile as a mid-sized asset class. In a given year the tilt can be ten points ahead or ten points behind while the underlying premium never changes at all. The average is the thing that is stable. The path is not.
This is the same structural problem as a flat decade, one layer down. A market with a positive long-run return still delivers ten-year stretches of nothing. A factor with a positive long-run premium still delivers ten-year stretches of underperformance. In both cases the long-run number is not wrong. It is just not a description of any particular decade you might live through.
So the honest framing of a tilt is not “this earns three points more.” It is: this earns three points more on average, with a spread whose year-to-year noise is several times the size of the thing I am trying to collect. Once you write it that way, the next question is unavoidable.
How long a premium takes to prove itself
If you want to know whether a premium is actually showing up, you are running a statistical test, whether you call it that or not. There is a closed formula for how much data that test needs.
The standard error of an average return shrinks with the square root of time. To conclude that an observed premium is not just noise, you need the premium to be some multiple of that standard error. Rearranged for years:
Years required = (t × sigma / mu)2
Where mu is the annual premium you are trying to detect, sigma is the annual volatility of the spread between the tilt and the broad market, and t is how confident you insist on being.
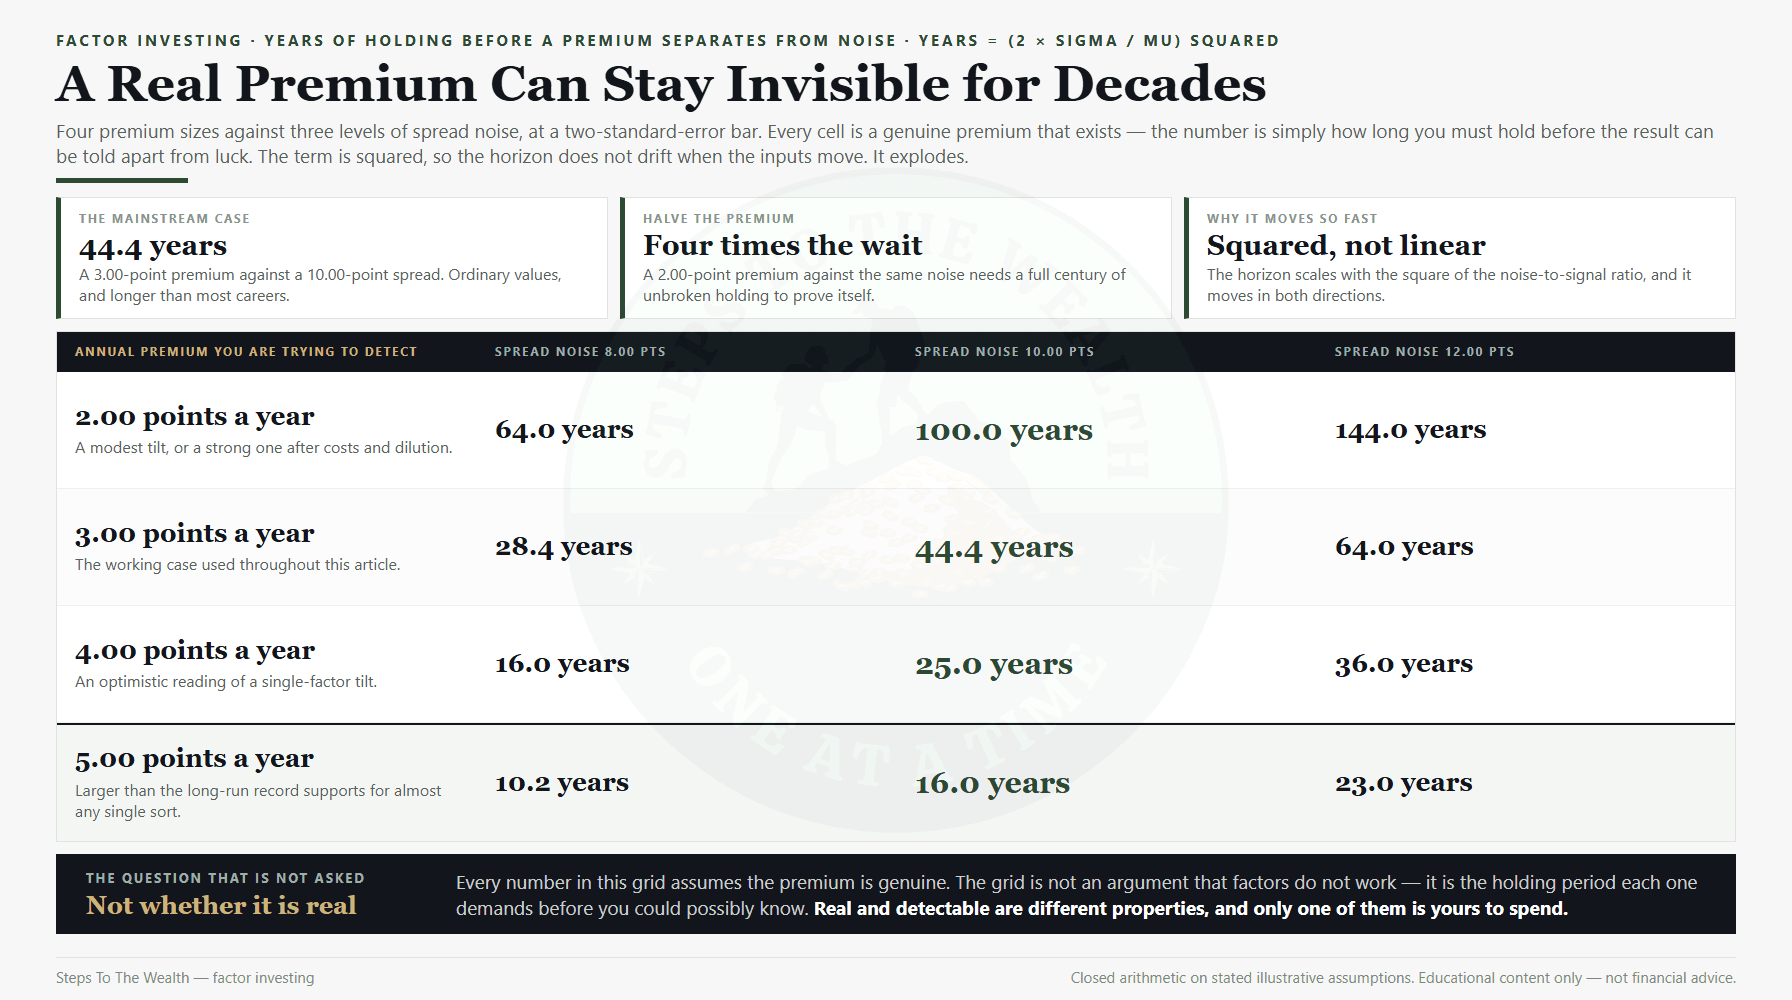
Put working numbers in. Take a premium of 3.00 points a year and a spread volatility of 10.00 points a year — unremarkable values for a mainstream single-factor tilt against a broad index. At a two-standard-error bar:
(2 × 10.00 / 3.00)2 = 44.4 years.
Forty-four years of holding before the result separates cleanly from noise. Relax the bar to roughly 90% one-sided confidence and it still takes 18.2 years. That is the softer, more forgiving version of the question, and it is already longer than most people hold any single fund decision.
The sensitivity is brutal, because the term is squared. Halve the premium and the horizon quadruples. A 2.00-point premium against the same 10.00-point spread needs 100 years. Widen the spread volatility from 10.00 to 12.00 points and the 3.00-point case goes from 44.4 to 64.0 years.
None of this says the premium is fake. It says something narrower and more useful: a real 3-point premium and a nonexistent one look identical for decades. You will not be able to tell which one you bought by watching your account.
What the odds look like inside a horizon you will actually hold
Detection is the strict question. There is a softer one that matters more day to day: what are the chances the tilt is simply behind the broad index when you next look at it?
Same assumptions — a genuine 3.00-point annual premium, a 10.00-point annual spread volatility, returns treated as independent year to year. The probability the tilt is behind the index after a given holding period:
- 1 year: 38.2%
- 3 years: 30.2%
- 5 years: 25.1%
- 10 years: 17.1%
- 20 years: 9.0%
- 30 years: 5.0%
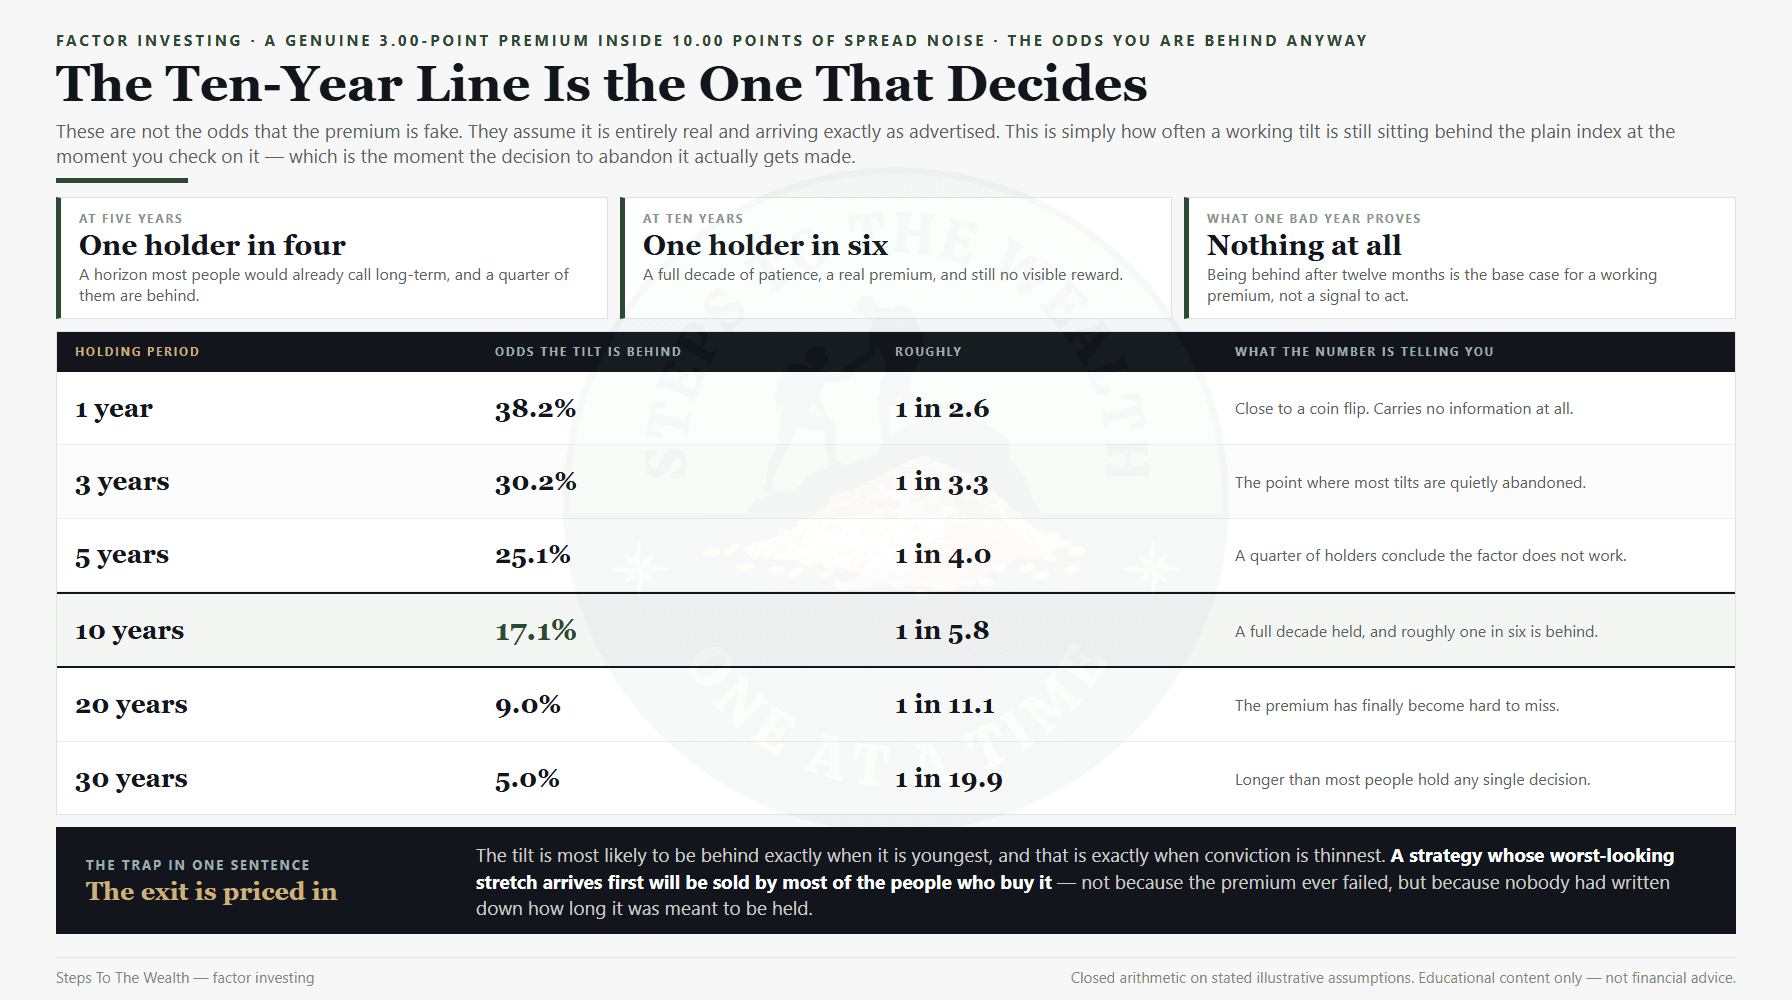
Read the ten-year line again, because it decides most outcomes. Even when the premium is completely real and you hold for a full decade, roughly one tilt in six is still behind the plain index at the end of it. At twenty years it is about one in eleven. At five years — a horizon most people would call long-term — it is one in four.
That is not a failure of the factor. That is what a 3-point signal inside 10-point noise looks like. The premium is doing exactly what it promised, on average, and a quarter of five-year holders still end up behind and conclude the thing does not work.
This is also why comparing your tilt to the index once a year tells you almost nothing. A single year of underperformance carries no information when the one-year base rate of underperformance is 38.2% under a working premium. If you are going to run that comparison, benchmark it properly — and know in advance how many years of data would actually change your mind.
The fee comes out of the premium, not out of the return
A factor fund typically costs more than the broad fund it sits beside. The difference is small in absolute terms, and it is almost always presented against the wrong denominator.
Suppose the tilt costs 0.25 points a year more than the broad fund. Against a 7% or 8% total return that looks like a rounding error. But the fee does not come out of the total return. It comes out of the spread, because the spread is the only thing the tilt is being paid to deliver.
0.25 against a 3.00-point premium is 8.33% of the entire edge, surrendered before the market opens.
Run it back through the detection formula. The net premium falls from 3.00 to 2.75, and the two-standard-error horizon moves from 44.4 years to 52.9 years. A quarter of one point bought 8.4 extra years of waiting.
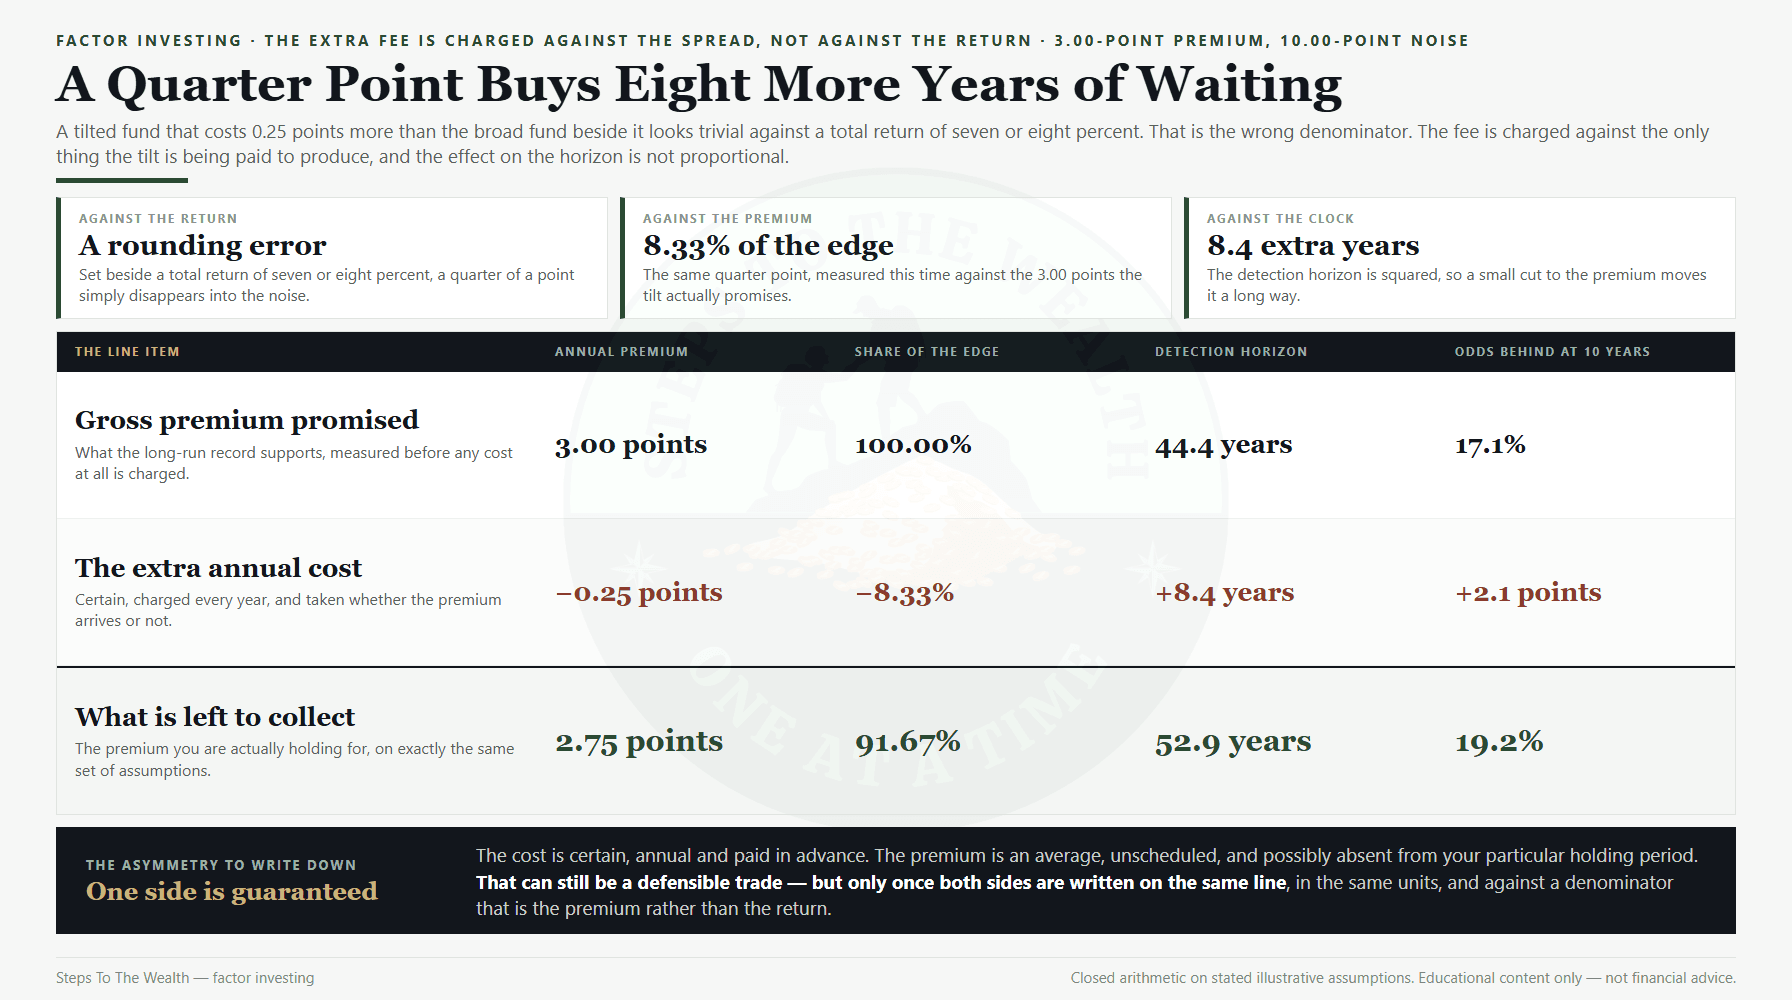
The asymmetry is the point. The fee is certain, annual and paid in advance. The premium is an average, unscheduled and possibly absent from your particular holding period. You are paying a known cost for an unknown, unpunctual benefit — which is a defensible trade, but only if you have written both sides down. The same asymmetry runs through every layer of fund cost, including the ones the expense ratio never prints: tracking error and the hidden cost of investment fees both bite the spread before they bite the return.
The tilt usually dies of behaviour, not of arithmetic
Everything above assumes you hold. That assumption does most of the work, and it is the one that fails.
The realistic failure sequence is not exotic. You add the tilt after reading the evidence. Three years pass. The tilt is behind — a 30.2% event under a perfectly real premium, so slightly less likely than a coin landing tails twice. You do not experience it as a base rate. You experience it as being wrong. Meanwhile the part of the market that has run is loud, and the case for moving toward it is everywhere.
So the tilt gets sold near the bottom of its relative cycle and the money goes to whatever has just worked. That is not factor investing failing. That is chasing, wearing an academic paper as a disguise, and it converts a positive-expectation position into a realised loss.
The engine underneath is ordinary. Recency makes three bad years feel like a verdict. Confirmation makes the exit research easy to find. Loss aversion makes the relative shortfall hurt more than the absolute gain pleases. All of it sits in the standard list of investing biases, and none of it is defeated by knowing the premium is real.
Which produces the honest reading of the whole class. The arithmetic says a tilt needs decades. Human behaviour gives the median tilt a few years. A strategy whose edge requires a holding period longer than the holder’s patience is not an edge. It is a tax on optimism.
Three honest questions before you tilt
None of this makes tilting wrong. It makes tilting a decision with a specific set of preconditions, and the preconditions are checkable in about ten minutes.
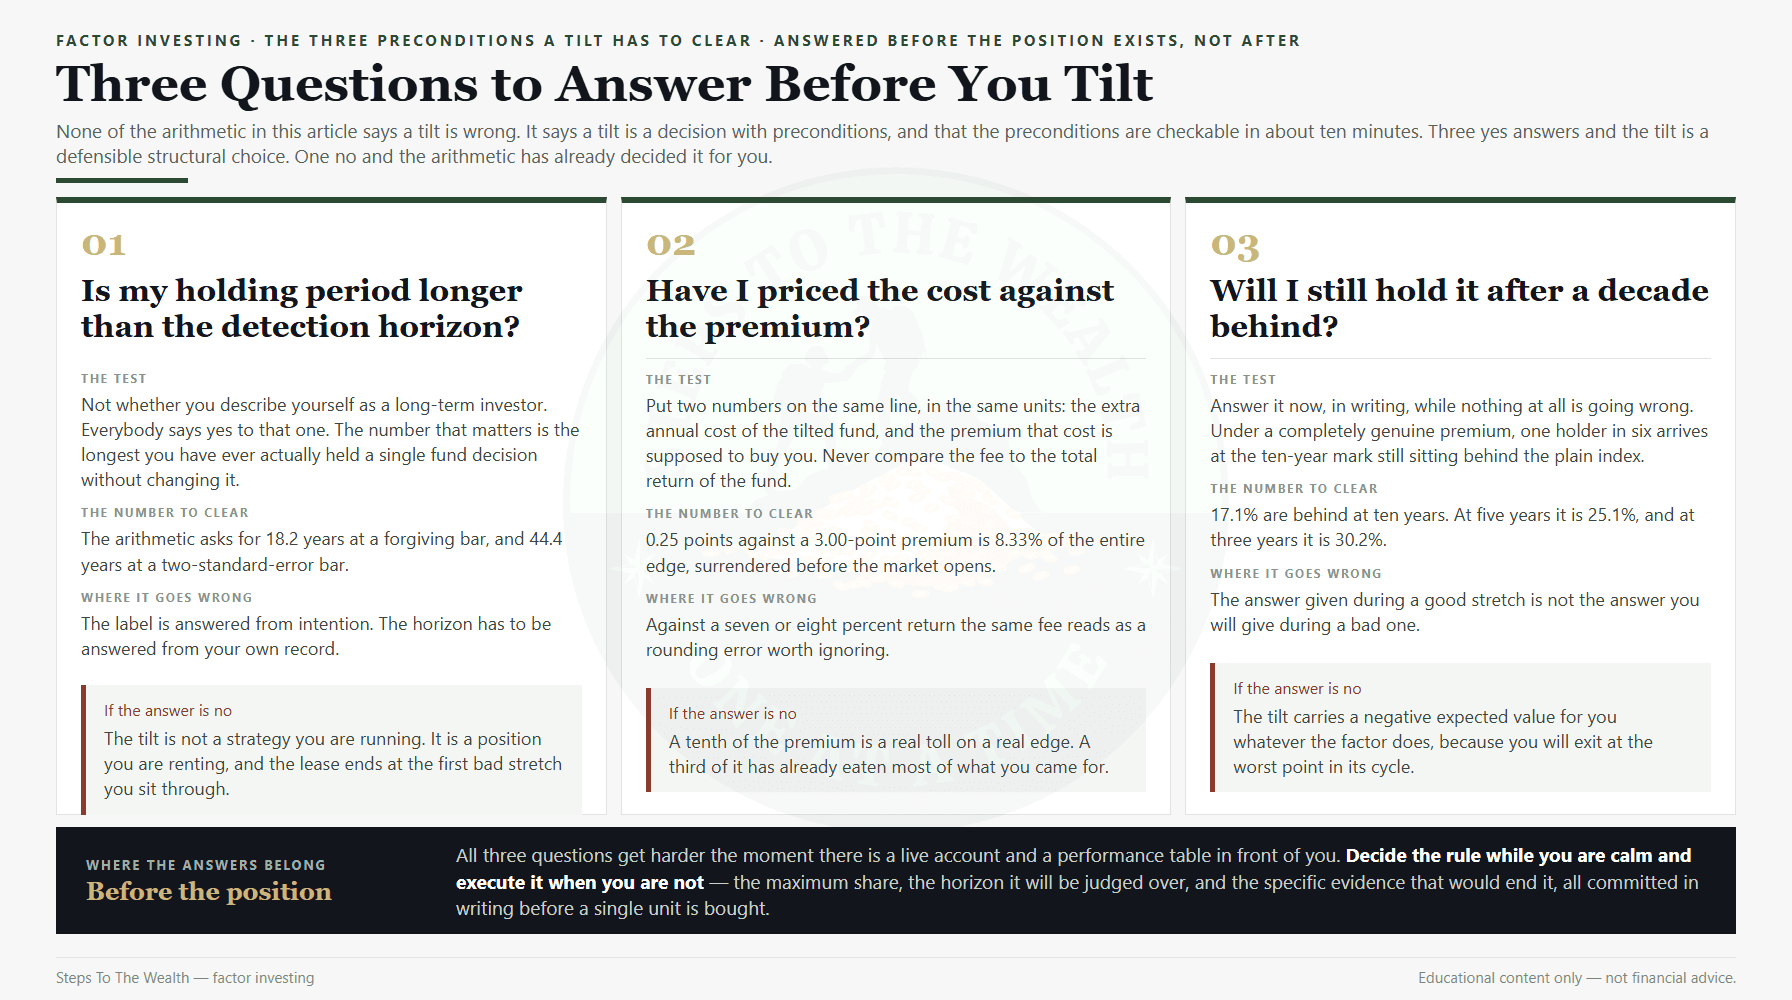
1. Is my holding period longer than the detection horizon?
Not “am I a long-term investor.” Everyone says yes to that. The real question: what is the longest you have ever actually held a single fund decision without changing it? If the answer is four years and the arithmetic asks for eighteen at the forgiving bar, the tilt is not a strategy you are running. It is a position you are renting.
2. Have I priced the cost against the premium, not against the return?
Write both numbers on the same line. The extra cost of the tilted fund, and the premium it is supposed to deliver. If the cost is a tenth of the premium, that is a real toll on a real edge. If it is a third, the arithmetic has already eaten most of what you came for — before any question of whether the premium shows up at all.
3. Will I still hold it after a decade behind the index?
Answer this now, in writing, while nothing is going wrong. Under a genuine premium, one holder in six reaches the ten-year mark behind. If the honest answer is no, the tilt has a negative expected value for you regardless of what the factor does, because you will exit it at the worst point in its cycle. A position you cannot hold through its bad state is worse than not holding it.
Three yes answers and a tilt is a defensible structural decision. One no and it is a decision the arithmetic has already answered.
How a rules-based system treats the same decision
The reason these questions are hard is that they get asked in the moment, against a live account, with a performance table in front of you. That is the worst possible time to run any of them.
A rules-based system handles it by moving the decision earlier. Sizing is decided before the position exists, not adjusted after the price moves. Review frequency is fixed, so a three-year shortfall does not get re-litigated eleven times. The exit condition is written down at entry, in terms of the thesis rather than the drawdown.
Applied to a tilt, three things get committed in advance: the maximum share of the portfolio it may occupy, the horizon over which it will be judged, and the specific evidence that would end it. Position sizing rules do the first job. The detection arithmetic above does the second. The third is the one almost nobody writes, and it is the one that stops the exit being chosen by a bad quarter.
The broader principle is the one that governs contribution timing in a risk-first framework: decide the rule when you are calm, execute it when you are not. If you want that framework as a written system rather than a set of instincts, the free Blueprint lays out the structure.
What this arithmetic does not say
Three limitations, stated plainly, because a one-sided case is not an argument.
The model treats annual spread returns as independent and roughly symmetric. Real factor spreads are not perfectly independent — they cluster, and their volatility itself changes over time. That cuts both ways: it can shorten a favourable run and lengthen an unfavourable one.
The numbers used here — a 3.00-point premium and a 10.00-point spread volatility — are illustrative working values, not measurements of any specific fund. Put your own into the formula. The structure of the answer does not change: the horizon scales with the square of the noise-to-signal ratio, so modest changes in the inputs move the result violently.
And nothing above argues that factor premia are not real. The argument is narrower and harder to dismiss: a premium can be entirely real and still be undetectable, unrewarding and psychologically unholdable inside the horizon of the person buying it. Real is not the same as available. That distinction is also why diversification gets defended on structure rather than on any one year’s result — and why a track record shown to you has to survive a survivorship check before it means anything at all.
Frequently asked questions
What is factor investing?
Factor investing is holding a portfolio sorted by a measurable characteristic — value, size, momentum, quality or low volatility — rather than by market capitalisation alone, on the evidence that the favoured end of that sort has earned a premium over long historical samples.
Is factor investing the same as stock picking?
No. A stock picker selects individual companies on judgement. A factor fund applies one mechanical sorting rule to a whole universe and holds everything on the chosen side of it. The rule is public and does not change with anyone’s opinion.
Does factor investing beat plain index investing?
On long historical averages, several factors have. Over the horizons real people hold, the answer is frequently no even when the premium is genuine: under a 3-point premium with 10-point spread volatility, about one holder in six is still behind the index after ten years.
How long should you hold a factor tilt?
Longer than most people expect. The detection arithmetic asks for roughly 18 years at a 90% confidence bar and about 44 at a two-standard-error bar, on the illustrative numbers used above. If your realistic holding period is materially shorter, the tilt cannot be evaluated inside it.
Is smart beta the same as factor investing?
Broadly yes. “Smart beta” is a marketing label for rules-based indices that weight by something other than market capitalisation. The underlying mechanism — a published sorting rule applied to an index — is the same one described here.
Can I tilt with only a small part of the portfolio?
You can, and it lowers the risk of the decision. It also lowers the effect proportionally: a 3-point premium on 10% of a portfolio contributes 0.3 points to the whole, before costs. Small tilts are safer and quieter; they are not a way to get the premium without the horizon.
Does a factor tilt help in a downturn?
Not reliably. Some tilts have historically fallen less than the broad market and some have fallen more, and which does what varies by episode. A tilt is a long-run return decision, not drawdown protection. Volatility and risk are not the same thing, and a tilt addresses neither directly.
The check worth running this week
Open the holding you are most tempted to tilt toward, or the tilt you already own, and write down four numbers on one line: the extra annual cost, the premium you believe you are buying, the volatility of the spread, and the longest you have ever held a single fund decision unchanged.
Then put the first three into the formula and compare the answer to the fourth. If the horizon the arithmetic asks for is longer than the horizon your own history supports, you have learned something concrete, and you learned it before paying for it — which is the entire point of running the numbers first.
The broad fund is not a consolation prize. It is the position that does not require you to be patient for forty-four years to find out whether you were right.
Educational content only. Not financial advice. The figures here are illustrative arithmetic on stated assumptions, not projections or measurements of any specific fund. The jurisdiction in which the site operator resides governs any dispute arising from this content.