
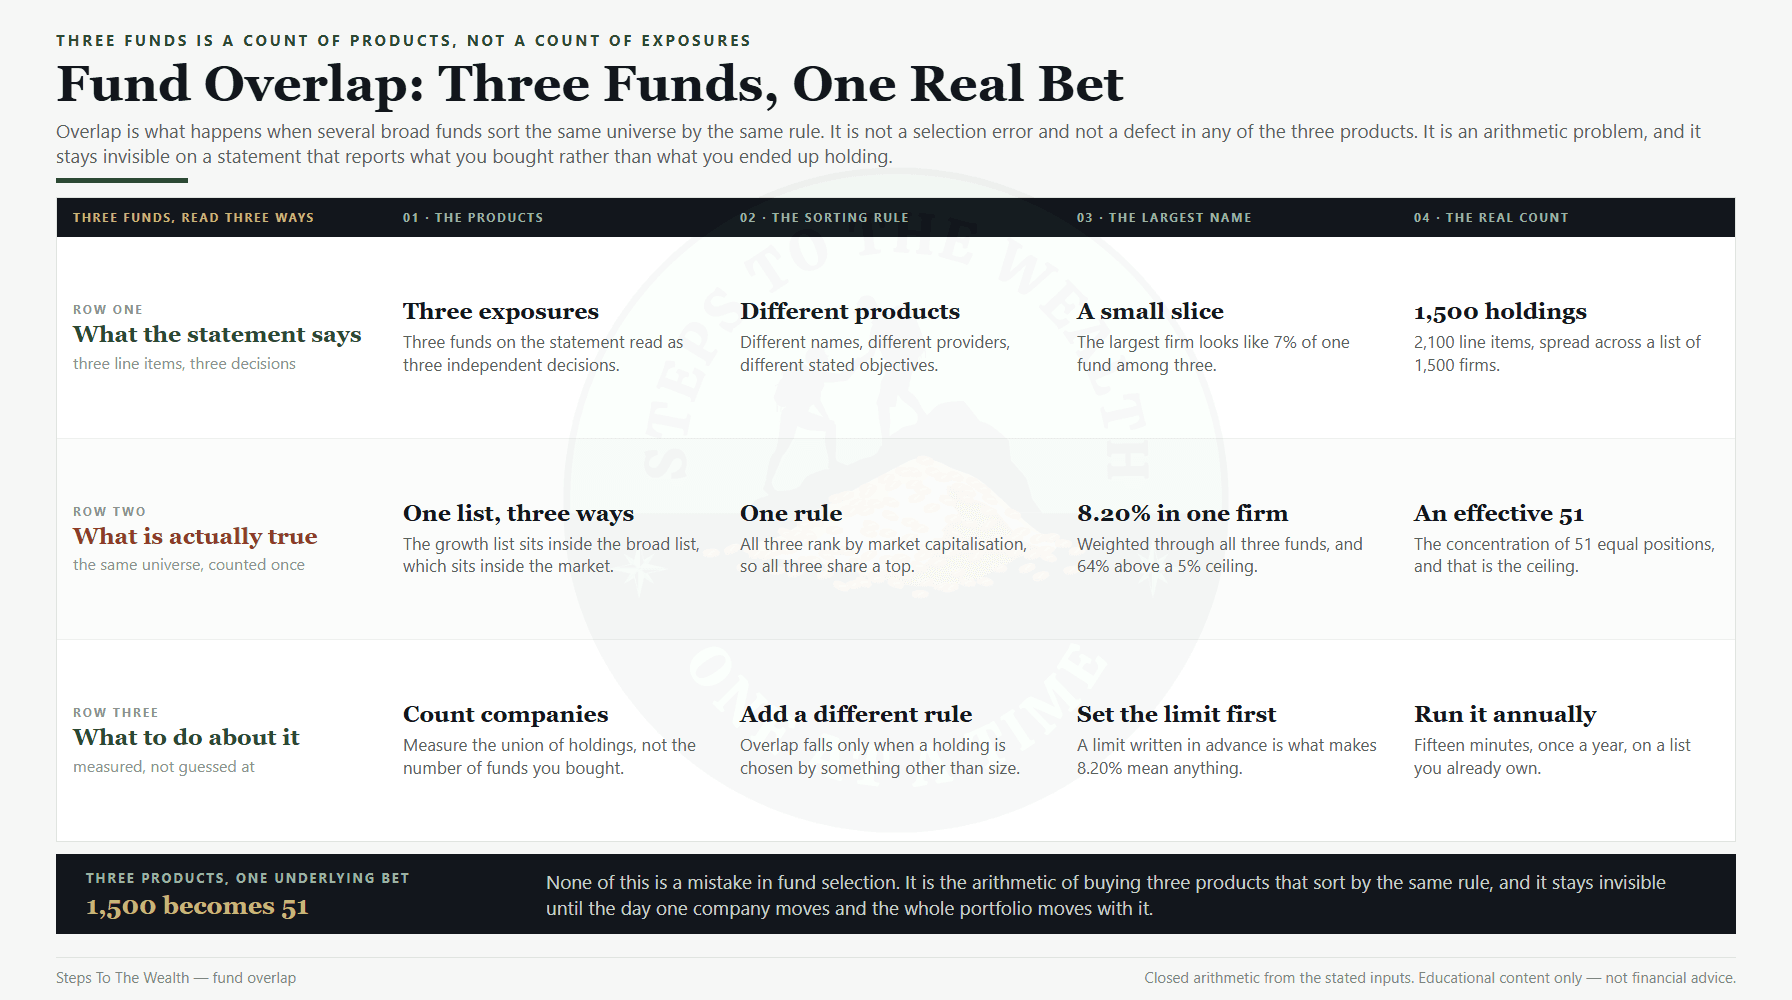
Open your brokerage statement and count the funds. Three, most likely, maybe four — a broad index fund, something labelled total market, and one tilted toward growth or technology. Three line items, three decisions, three exposures. That is what the statement shows, and it is what most self-directed investors believe they own.
Now count the companies underneath them. In a portfolio built the ordinary way, those three funds list roughly two thousand holdings between them, and a large share of those entries are the same firms appearing more than once. The statement never says so, because a statement reports what you bought, not what you ended up holding.
Fund overlap is the gap between those two counts. It is the share of your portfolio that reaches a single company through more than one fund at the same time, and it is not a rare accident. It is the predictable output of the way broad index funds are built. Left unmeasured, it turns a portfolio that looks diversified into one that is quietly making a single concentrated bet.
What follows is the arithmetic that prices it, one worked example carried the whole way through, and a fifteen-minute check you can run on holdings you already own. The numbers are illustrative — round figures chosen so the mechanism is visible — not a description of any particular fund or provider.
What fund overlap actually is
Fund overlap is a measurement problem before it is a portfolio problem. Two funds overlap when they hold the same underlying company, and the size of the overlap is the share of your money that arrives at that company by both routes at once.
The word “diversified” tends to get applied at the wrong level. A fund holding 500 companies is diversified internally. Three such funds sitting side by side in one account are not automatically three times as diversified, because diversification is a property of the combined position, not of the number of tickers on the statement.
This is the same confusion that what you actually own works through at the level of a single share, where the ticker is not the thing. Fund overlap is that error one level up. The fund is not the exposure. The companies underneath it are, and they do not care which wrapper delivered your money to them.
None of this makes overlap a defect. A cap-weighted index fund holding the market’s largest companies in proportion to their size is doing precisely what it advertises, and doing it cheaply. The failure is arithmetic rather than moral: believing you hold three separate bets, sizing each one as though it were separate, and discovering the true concentration only when a single company moves and the whole portfolio moves with it.
The parent argument — why spreading money across genuinely different exposures reduces risk at all — is worked through in how diversification reduces risk. That article gives the principle and a one-line check. This one supplies the arithmetic that turns the check into a number.
Three funds, one sorting rule
Overlap is not bad luck in fund selection. It is structural, and the structure is worth understanding, because it lets you predict which combinations will overlap before you look anything up.
Almost every broad index fund sorts its holdings by market capitalisation, which is simply the total market value of each company. The largest company receives the largest weight, the second largest receives the second largest weight, and so on down the list. That single rule is what makes an index fund cheap to run and predictable to track.
Apply the same rule three times and it returns the same answer three times. A domestic large-cap fund ranks by market capitalisation. A total-market fund ranks by market capitalisation across a wider list. A large-cap growth fund ranks by market capitalisation within a filtered list that the biggest companies tend to pass anyway. The top of all three is populated by the same firms, in roughly the same order, for the same reason.
So overlap is not a coincidence you avoid by picking better funds. It is the sorting rule showing up in every fund that uses it. Two funds fail to overlap only when they sort by something genuinely different, or when they draw from a list that genuinely excludes the other’s holdings. Adding a fourth cap-weighted fund adds line items, not exposures.
The public education material on asset allocation makes the same point in the language of asset classes rather than individual holdings: the diversification that matters comes from owning things that behave differently, not from owning more of them.
Cost is a separate axis and worth keeping separate. Which of two similar funds is genuinely cheaper is a question about fees and tracking, worked through in index fund tracking error. A fund can be the cheapest available and still be almost entirely redundant with what you already hold. Cheap and redundant are not opposites.
What you actually hold in the largest name
Take a portfolio built the ordinary way. Forty per cent in a broad large-cap fund holding 500 companies. Thirty per cent in a total-market fund holding 1,500. Thirty per cent in a large-cap growth fund holding 100. Three funds, three decisions, and a statement listing 2,100 holdings.
Look at what those lists contain. The 100 companies in the growth fund are all large-cap firms, so they already sit inside the 500. Those 500 in turn sit inside the 1,500 the total-market fund holds. The union of all three is 1,500 distinct companies, which is exactly what the total-market fund held on its own. The other two funds contributed 600 duplicate line items and not one new company.
Now price the largest holding. Suppose the biggest company in the market is 7.0% of the large-cap fund, 6.0% of the total-market fund, and 12.0% of the growth fund, where the filtered list concentrates it further. Each fund passes your money through at its own rate, scaled by that fund’s share of the portfolio.
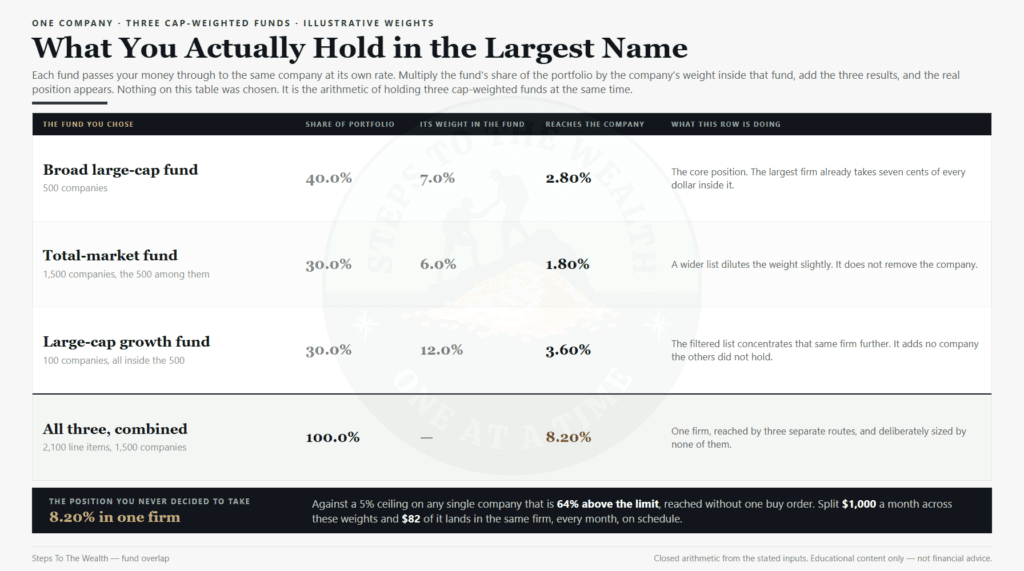
Multiply and add: 0.40 times 7.0% is 2.80%, 0.30 times 6.0% is 1.80%, and 0.30 times 12.0% is 3.60%. The company’s true weight in your portfolio is 8.20%. Not 7%, and not “a bit of it in each fund” — 8.20% of everything you own, concentrated in one firm, arrived at without a single decision to buy it.
Put that against a position-size rule. If your ceiling for any single company is 5%, this holding sits 64% above it, and it got there while you were being careful. The rules for setting that ceiling in the first place are in position sizing rules. The point here is narrower: a ceiling you never measure against is not a ceiling, it is a preference.
The same arithmetic runs forward on contributions, which is where it matters most for anyone investing on a schedule. Split $1,000 a month across those three funds at their target weights and $82 of it lands in that one company every month, or $984 over a year. A plan that adds money mechanically also adds concentration mechanically, at whatever rate the overlap dictates, and it will keep doing so until somebody measures it.
From 1,500 holdings to about 51 real bets
One company at 8.20% is a fact about one company. The more useful question is what the portfolio’s concentration amounts to as a whole, and there is a standard way to answer it.
The measure is the effective number of holdings. Take every company’s weight in the portfolio, square each one, add them all up, and divide one by that total. The result is the number of equally weighted positions that would carry the same concentration as what you actually own. Hold fifty companies in equal amounts and the formula returns fifty. Let one holding dominate and it returns something close to one, however many small positions surround it.
Run it on the portfolio above. Suppose the ten largest effective weights, after the overlap arithmetic has been applied across all three funds, come out as 8.20%, 6.66%, 5.10%, 4.30%, 3.40%, 2.90%, 2.50%, 2.20%, 2.00% and 1.80%. Those ten sum to 39.06% of everything you own. The remaining 60.94% is spread across the other 1,490 companies.
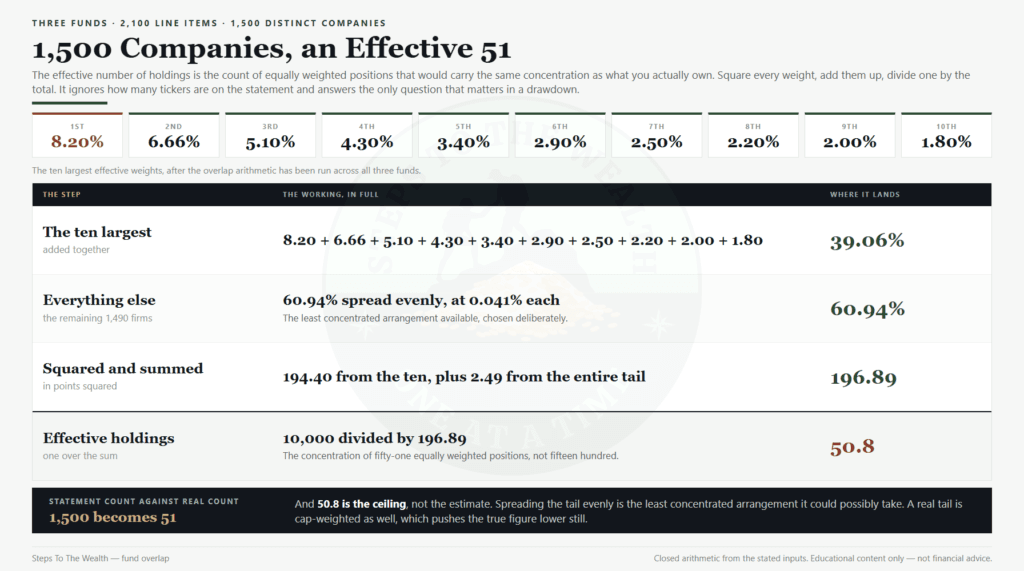
Square the ten largest and they contribute 194.40 to the total, in units of percentage points squared. Spread the remaining 60.94% evenly across 1,490 companies and the entire tail contributes 2.49. Add the two and divide: 10,000 divided by 196.89 gives an effective count of 50.8.
Fifteen hundred companies. Two thousand one hundred line items across three separate funds. The concentration of roughly fifty-one equally weighted positions.
And that is the generous reading. Spreading the tail evenly is the assumption that makes the number as high as it can possibly go, because equal weights are the least concentrated arrangement available to any set of holdings. A real tail is cap-weighted too, which pushes more of that 60.94% toward its own largest members and drives the effective count lower still. Treat 50.8 as a ceiling rather than an estimate. Adding a tilted fund on top does not escape this: a factor tilt re-weights holdings you already own rather than adding new ones.
This is what the diversification checklist is pointing at when it says three funds holding the same ten companies are not three exposures. The effective count turns that sentence into a number you can write down and track, and it is the number that decides how much a single corporate failure can cost you. It is also a useful companion to the point in volatility is not risk: a portfolio can look calm and still be concentrated, because concentration shows up in what a bad outcome costs rather than in day-to-day movement.
The overlap that no fund reports
The arithmetic above stops at the edge of your investment accounts. Two of the largest concentrations most working professionals carry sit outside them entirely, and neither appears on any fund’s holdings page.
The first is your employer. If you hold company stock, unvested options, or a bonus tied to company performance, that exposure stacks on top of whatever your index funds already own of the same firm. It also stacks on top of your salary, which is the largest position most people hold and the one they never write down. Equity compensation risk works through what that concentration actually costs and how to size around it.
The second is your country. A domestic index fund sitting beside a global fund that weights heavily toward the same market is not two geographies, however different the two products look. That is home country bias, and it is fund overlap operating at the level of markets rather than companies. The mechanism is identical: the same universe, sorted twice.
Both belong in the same table as the funds. The honest question is not “how much of my portfolio”, it is “how much of everything that pays me”. A 5% ceiling on a single company means very little if that company also signs your payslip.
How to measure fund overlap in fifteen minutes
The check is mechanical, it uses information you already have access to, and it needs running about once a year. Nothing here requires a subscription or a screener.
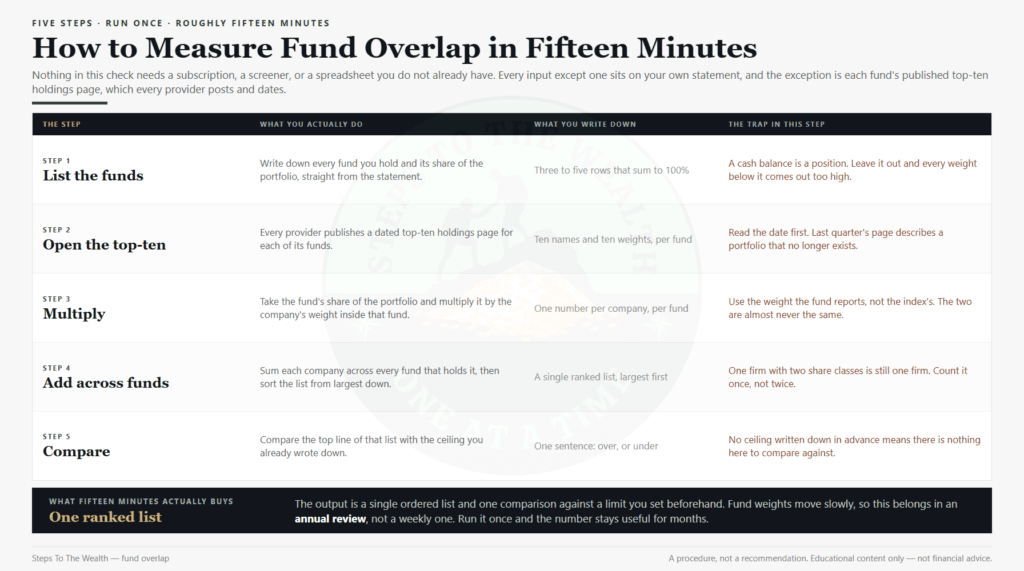
Start by listing every fund you hold and its share of the portfolio, straight from the statement. Include cash. A cash balance is a position, and leaving it out inflates every other weight in the table before you have calculated anything.
Then open each fund’s top-ten holdings page. Every provider publishes one and dates it. Read the date before you read the weights, because a page from last quarter describes a portfolio that has since moved. Write down ten names and ten weights per fund.
Now multiply. For each company in each list, multiply the fund’s share of your portfolio by that company’s weight inside the fund. Use the weight the fund reports rather than the index’s published weight; the two are almost never identical, and the fund’s own number is the one your money actually followed.
Add across funds next. Sum each company over every fund that holds it, then sort the list from largest down. One firm with two share classes is still one firm, so count it once. What you have at this point is a single ranked list of your real exposures, which is something no individual statement can show you.
Finally, compare. Put the top line of that list against the single-company ceiling you set in advance. That comparison is the entire output of the exercise. If no ceiling was ever written down, the number has nothing to be measured against, and the honest first task is to set one rather than to react to what you just found.
This belongs in an annual review rather than a weekly ritual, because fund weights move slowly. The annual investing review is the natural home for it, and the worked example in the reader’s portfolio audit shows the same kind of exercise run end to end on a real set of holdings.
What the effective count does not tell you
The number is a description, not a verdict, and it is worth being precise about its limits.
It does not tell you the concentration is wrong. Cap-weighted exposure to the largest companies in a market is how the broad market return is earned in the first place, and an investor who deliberately chooses it has chosen something defensible. The problem this article is about is unmeasured concentration, not concentration itself.
It does not predict anything. An effective count of 51 says nothing about what those 51 positions will do next, and no arrangement of weights protects against a market-wide decline. Diversification addresses the risk of a single holding failing, which is a narrower job than most people assume.
It is also not a performance measure. Whether your portfolio did well is a separate question with its own traps, and building an honest comparator is what benchmarking your portfolio is for. A concentrated portfolio and a diversified one can post the same return in a given year.
And it does not, by itself, tell you to sell anything. There are three honest responses to a number you do not like, and only one of them involves trading. You can consolidate toward a single broad fund, which removes the overlap by definition because one sorting rule cannot duplicate itself. You can add an exposure chosen by a genuinely different rule. Or you can leave the holdings alone and size future contributions with the real number in front of you.
One thing that will not help is rebalancing between funds that already overlap. Restoring three cap-weighted funds to their target weights changes the ratio between the wrappers and leaves the underlying concentration almost exactly where it was, which is a useful illustration of the distinction drawn in rebalancing vs chasing. Rebalancing is a discipline for holding an allocation steady. It is not a tool for changing what that allocation is made of.
Frequently asked questions
What is fund overlap?
Fund overlap is the share of your portfolio that reaches the same underlying company through more than one fund. It is measured by multiplying each fund’s share of the portfolio by the company’s weight inside that fund and adding the results across every fund that holds it.
Is fund overlap always a bad thing?
No. Overlap is the ordinary consequence of holding several funds that sort the same universe by market capitalisation, and cap-weighted exposure is a legitimate thing to own. The risk comes from holding it unknowingly and sizing your positions as though the funds were independent bets.
How much fund overlap is too much?
There is no universal threshold, which is why the check ends in a comparison against a limit you set yourself. A common approach is to write down a maximum weight for any single company, then treat any effective weight above it as something to address at the next review.
Do funds from different providers still overlap?
Yes, and the provider is largely irrelevant. What determines overlap is the universe a fund draws from and the rule it uses to weight holdings. Two funds from different companies that both track the largest firms by market capitalisation will hold nearly the same names in nearly the same order.
Does adding an international fund fix fund overlap?
It reduces overlap at the company level only to the extent that the new fund holds different companies. A global fund that allocates heavily back to your domestic market brings a large share of the same firms with it, so the reduction is usually smaller than the label suggests.
Will rebalancing reduce fund overlap?
No. Rebalancing restores the weights between your funds; it does not change which companies those funds hold or how they are weighted inside them. If the overlap came from three funds sorting by the same rule, rebalancing them against each other leaves that structure intact.
How often should I check fund overlap?
Once a year is enough for most portfolios, because index weights shift slowly and fund mandates rarely change. The exception is any year in which you add a fund, change providers, or receive a meaningful amount of company stock, since each of those alters the table directly.
The check worth running this week
The reason to run this properly is not that the number is interesting. It is that unmeasured overlap quietly undoes the one protection diversification actually offers, and it does so while the statement in front of you says everything is fine.
Fifteen minutes, once, gets you a single ranked list of what you really own and one honest comparison against a limit you chose in advance. If the top line comes in under your ceiling, you have learned that your allocation is doing what you thought, which is worth knowing. If it comes in above, you have found it in a review rather than in a drawdown.
Either way the answer is a number rather than an impression, and a number is something a system can act on. That is the whole point of running the check before you need it.
If you would rather have the risk readings arrive on a schedule than reconstruct all of this from memory once a year, the Steps To The Wealth Weekly sends the readings and the action steps every Sunday.
Educational content only — not financial advice. Every figure above is an illustration closed from the assumptions stated beside it, using round numbers chosen to make the mechanism visible. They are not a description of any particular fund, not a forecast, and not a recommendation to buy or sell anything.