
Once a year I sit down and grade the framework. Not the portfolio — the framework. The gap between those two things is the entire subject of this article.
Most people’s version of an annual investing review is checking whether the number went up. If it did, the strategy worked. If it did not, the strategy failed. That feels rigorous and it is close to useless, because in any single year the result is dominated by what the market did rather than by what you did. A weak process looks brilliant in a rising market. A sound process looks broken in a flat one.
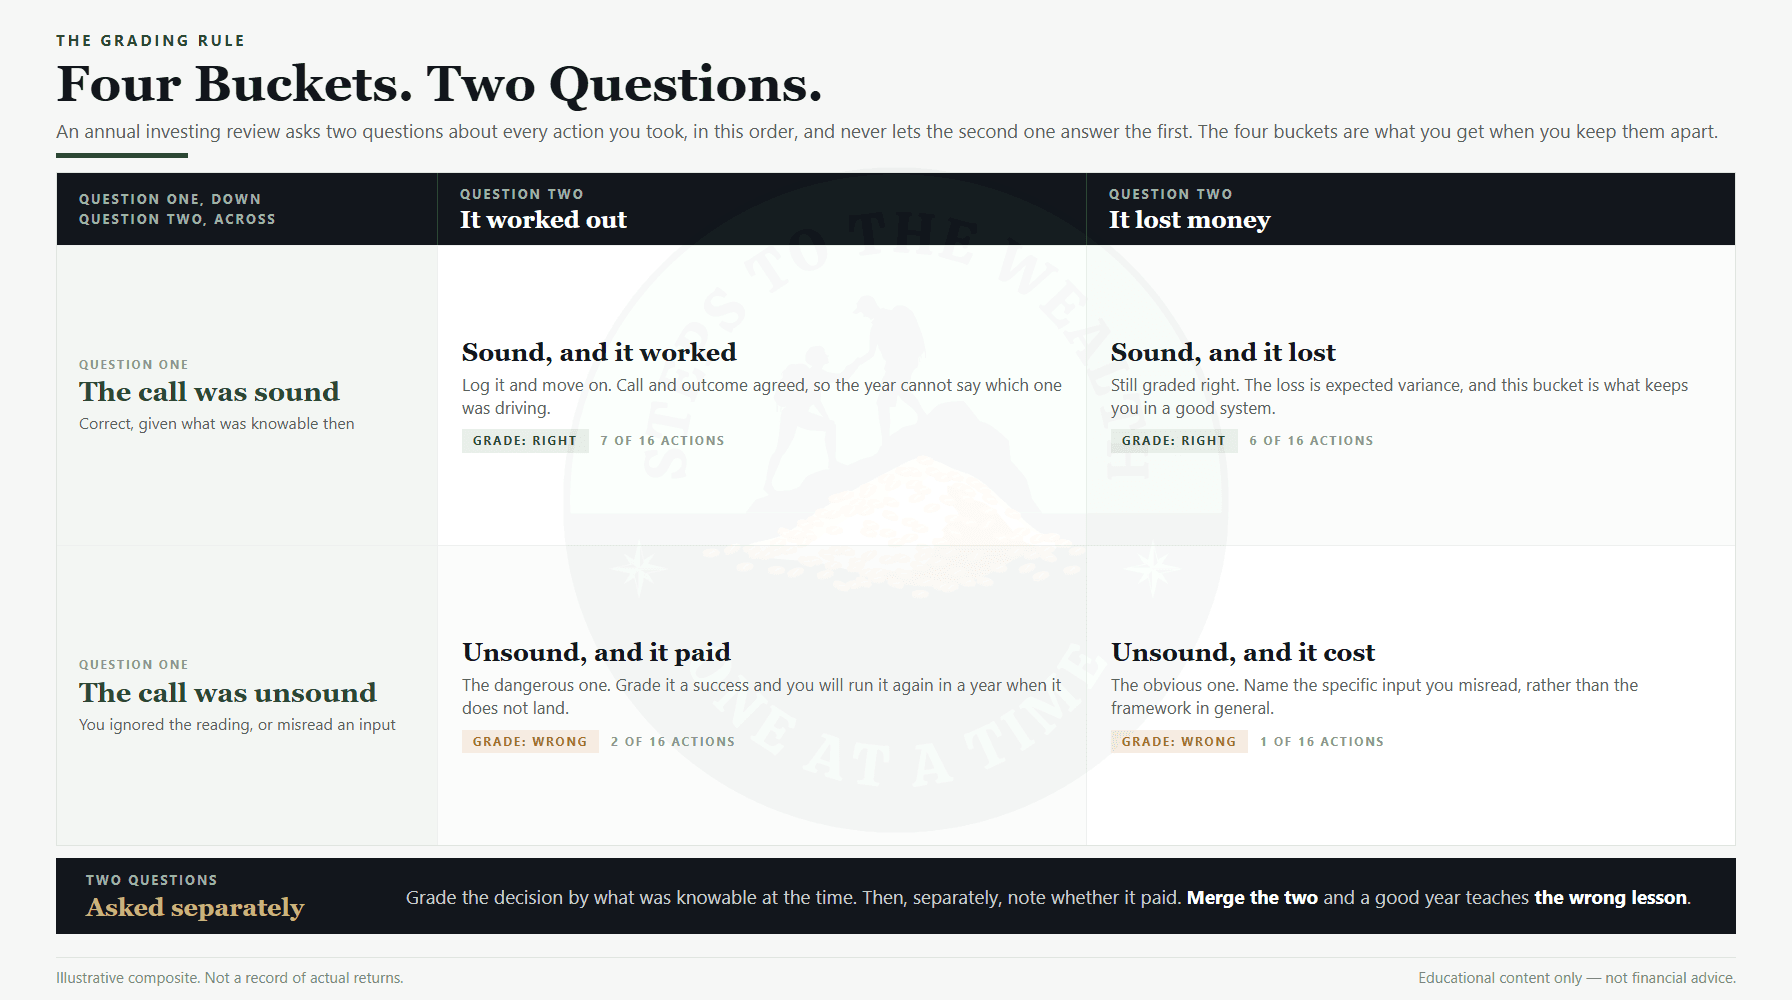
So I grade the calls instead. For every meaningful action taken over the year, I ask two separate questions: was the decision sound given what was knowable at the time, and did it work out. Those two answers come apart far more often than people expect, and holding them apart is the most valuable habit this exercise can build.
What follows is a composite year, illustrative rather than a literal record, run through that grading. Sixteen actions, four buckets, and two scores that end up disagreeing with each other by four actions.
Educational content only. Not financial advice.
What an annual investing review actually grades
An annual investing review grades decisions. That is the whole scope, and being strict about it is what stops the exercise turning into a mood report about the year.
The things being graded are the actions the framework had an opinion about: entries, exits, trims, skips, and every time you did something the reading did not ask for. Each of those is a decision with a date and a reason attached. What the market did afterwards is not part of the decision. It is what happened to the decision, which is a different fact and belongs in a different column.
This is also not a review of what you own. Whether your position sizes are deliberate, whether your diversification is real, and what the structure is quietly costing you in fees are worth checking once a year, but they are questions about the portfolio. This one is a question about your behaviour. Run both if you like — the structural audit is the other half of the annual exercise. Do not run them as a single exercise, because a clean structure and a followed process are two separate things and merging them lets a good answer on one hide a bad answer on the other.
Nor is it the weekly read. A risk-first framework produces a reading on a fixed cadence, and each reading maps to one action that was decided in advance. The annual review is where you look back across a year of those readings and count how often your behaviour matched the map you had already agreed to follow.
The rule that makes the review honest
One rule governs the whole exercise: grade the decision by what was knowable when you made it, not by what happened after.
A reading that said the environment was carrying elevated risk, followed by prices falling, was a sound call that worked. The same reading followed by six more months of gains was, quite possibly, still a sound call. Elevated risk describes conditions. It is not a forecast that price falls next week, and treating it as one is how people conclude a measurement is broken when it was only early.
The reverse case matters more. A reading you ignored that happened to pay is a poor decision with a lucky result, and it belongs in the error column no matter how good the money felt. This is the part almost nobody does, and skipping it is what quietly converts a rules-based approach back into improvisation over a few years.
Separating process from outcome is also why one year of returns tells you so little about whether your approach works. Twelve months is not enough data to distinguish skill from weather, which is the same reason the arguments about dollar-cost averaging never get settled by pointing at a single year. Process, by contrast, is fully observable. You either did the thing you said you would do, or you did not.
The four buckets, and what each one is worth
Two questions with two answers each produce four buckets. Every action in the year lands in exactly one of them, and each bucket earns a different amount of your attention.
Sound, and it worked
Start with the satisfying one, because there usually is one. The framework caught a genuine build-up of risk, the reading climbed, the exit ladder trimmed in steps while the headlines were still confident, and the asset later gave back a chunk. In the composite year this bucket holds seven of the sixteen actions.
People point at this bucket as proof the system works. It is evidence, but it is the least informative bucket in the set, because the call and the result agreed and you therefore cannot tell how much of it was the framework and how much was the weather. I log these, note that the framework behaved as designed, and move on quickly. The boring agreement of call and outcome is pleasant. It is not where the learning is.
Sound, and it lost
This is the most important bucket, and the one most people refuse to keep. Six of the sixteen actions sit here.
The framework read an asset as carrying low risk: depressed sentiment, compressed valuations, price well off its highs. The entry ladder deployed. The asset then went lower and stayed there, and by year end the position was underwater. Outcome bias insists this was a bad call. It was not. Deploying into a low reading is exactly what the ladder exists to do, and a framework that never holds a losing position at year end is a framework that never buys anything cheap.
So I grade the call right and file the loss as expected variance. The test is not whether the position made money this year. It is whether deploying was the correct action given the reading, and whether the prescribed size went in without being renegotiated on the day. Anyone who has looked at what a multi-year drawdown does to a schedule of contributions already knows that the buying which eventually mattered most felt worst at the time. Keeping this bucket honestly is what stops you abandoning a sound system after a bad year, which is exactly when sound systems get abandoned.
Unsound, and it cost
The uncomfortable bucket: the calls that were genuinely wrong rather than sound and unlucky. In the composite year there is one.
An input was distorted and the reading was less reliable than usual, and I did not catch it in time. Mechanical selling made an asset look as though risk had collapsed when nothing structural had changed. The reading was confidently wrong because one of its inputs had detached from what it normally measures, and I acted on it at full size instead of sizing down.
That is a real error, and it is worth being precise about whose error it was. Any framework built on proxies will occasionally take a bad input; that is a permanent property, not a defect that gets fixed. The error was mine, for failing to notice the condition and reduce conviction accordingly. The lesson is not to distrust the framework in general. It is to name the specific distortion, so that the next time it appears you recognise it in the first week instead of the fourth.
Unsound, and it paid
The last bucket is about you rather than the framework, and it is the one that decides whether the review was worth doing. Two of the sixteen actions sit here.
Both were overrides that made money. I skipped an entry the framework called for because it felt frightening, and the asset fell afterwards, so the override appeared to save me money. The temptation is to conclude that judgement beat the system. It did not. It was a negative-expectation decision that happened to land, and if that result is allowed to validate the behaviour, it will get repeated on a day when it does not land. Anyone who watched a volatile asset round-trip through a full cycle can name the moment where an instinct that had worked twice suddenly cost a great deal.
So both overrides go in the error column, the winner as well as the loser. Grading a lucky override as a success is the single most corrosive thing an annual investing review can do, because it trains the exact instinct the framework exists to suppress.
Grading adherence, zone by zone
Before the buckets can be tallied there is a simpler question to answer: in each risk zone, did the action match what that zone commits you to? The zones are decided in advance precisely so this question has a yes or no answer a year later.
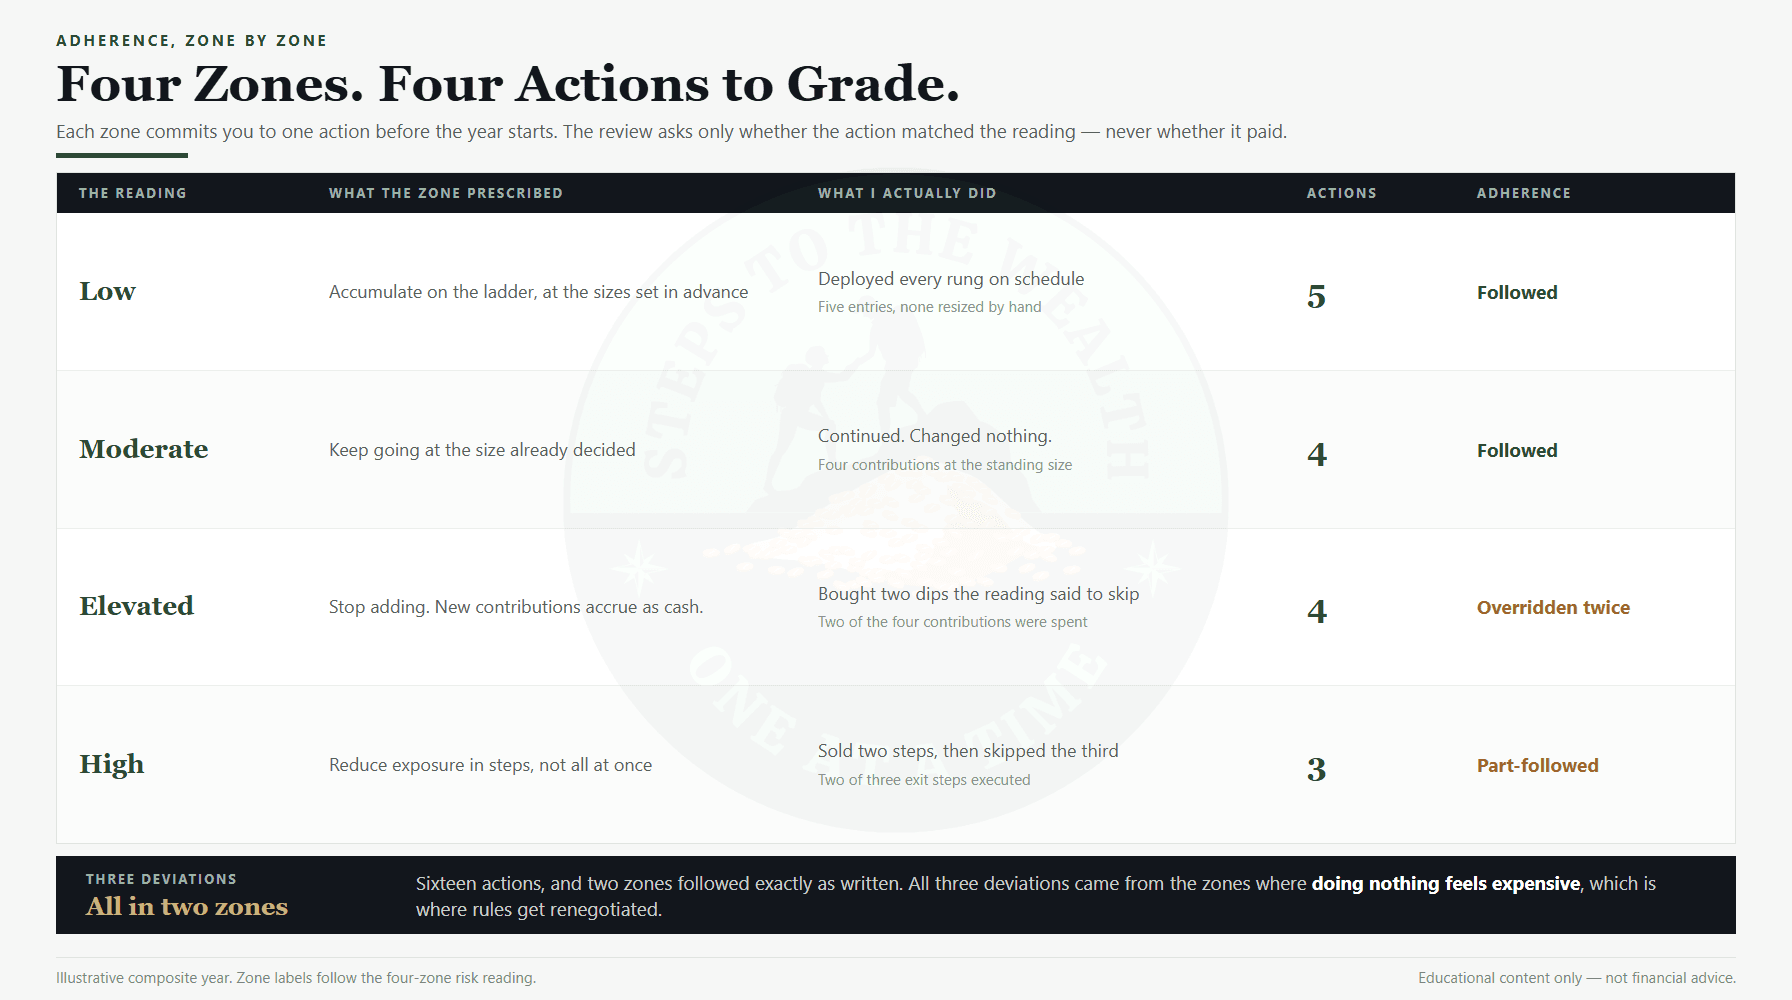
Low risk means accumulate on the ladder at sizes set in advance; five entries went in on schedule, none resized by hand. Moderate means keep going at the size already decided; four contributions, nothing changed. Elevated means stop adding and let new contributions accrue as cash; two of the four were spent buying dips the reading said to skip. High means reduce exposure in steps rather than all at once; two of three steps were sold and the third was not.
Two zones followed exactly, two negotiated with. That is not a coincidence, and it is the most portable finding in the whole review: every deviation came from a zone where doing nothing feels expensive. Nobody overrides a rule that tells them to keep doing what they were already doing. They override the rule that says stand still while something is moving.
The scorecard, and the two numbers that disagree
Sort the same sixteen actions into the four buckets and the year produces a scorecard that looks nothing like a profit and loss statement.
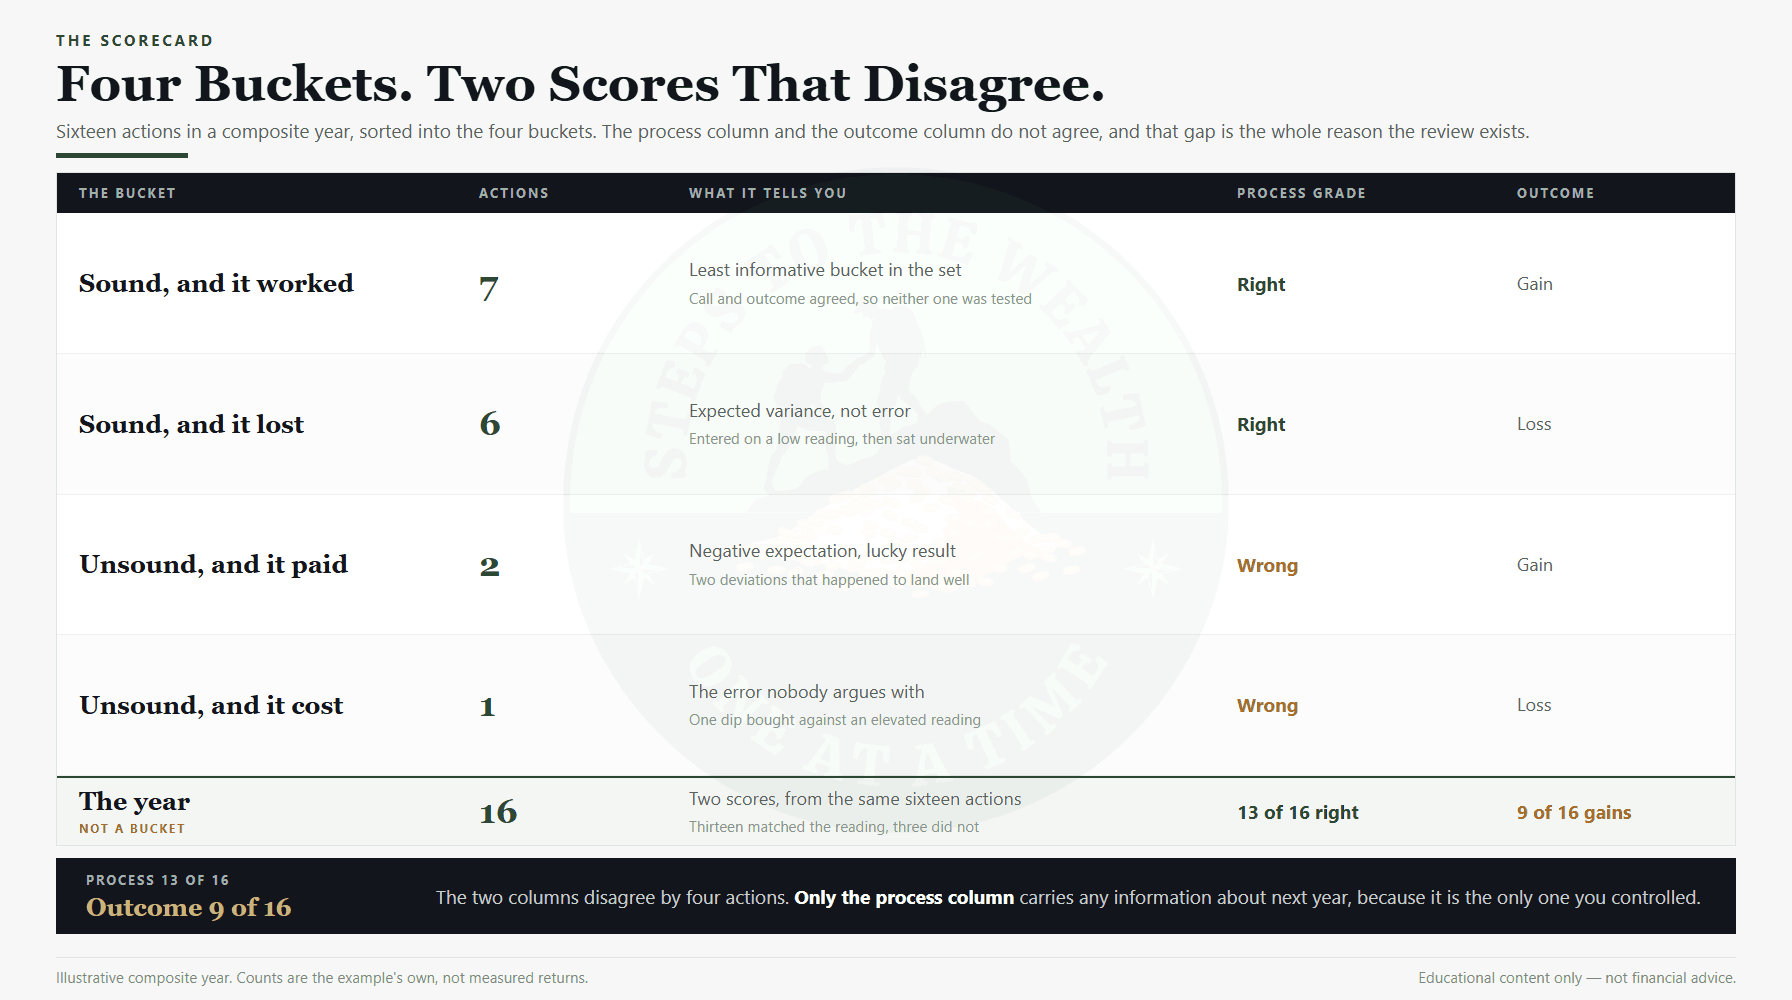
Thirteen of the sixteen actions matched the reading, so the process score is 13 of 16. Nine of the sixteen ended in a gain, so the outcome score is 9 of 16. The two columns disagree by four actions, and that gap is the entire reason the exercise exists.
Notice what the process column measures: adherence and judgement, not return. A good year by that column can sit alongside a flat or negative portfolio year, and a strong portfolio year can hide sloppy behaviour that a rising market quietly paid for. Only one of the two numbers describes something you controlled, and only the controlled one carries any information about next year.
It is worth writing both down anyway. A process score that stays high while outcomes stay poor for several years is a signal about the framework itself, not about your discipline — but one year cannot tell you which, and pretending otherwise is how people rebuild their approach on twelve months of noise. That comparison is what a deliberate stress test is for, because it asks how the structure behaves across conditions you have not happened to live through yet.
The three deviations, and why the profitable ones are worse
Three actions did not match their reading. They are the shortest section of the review and the only one that changes behaviour, so they get written out individually rather than counted.
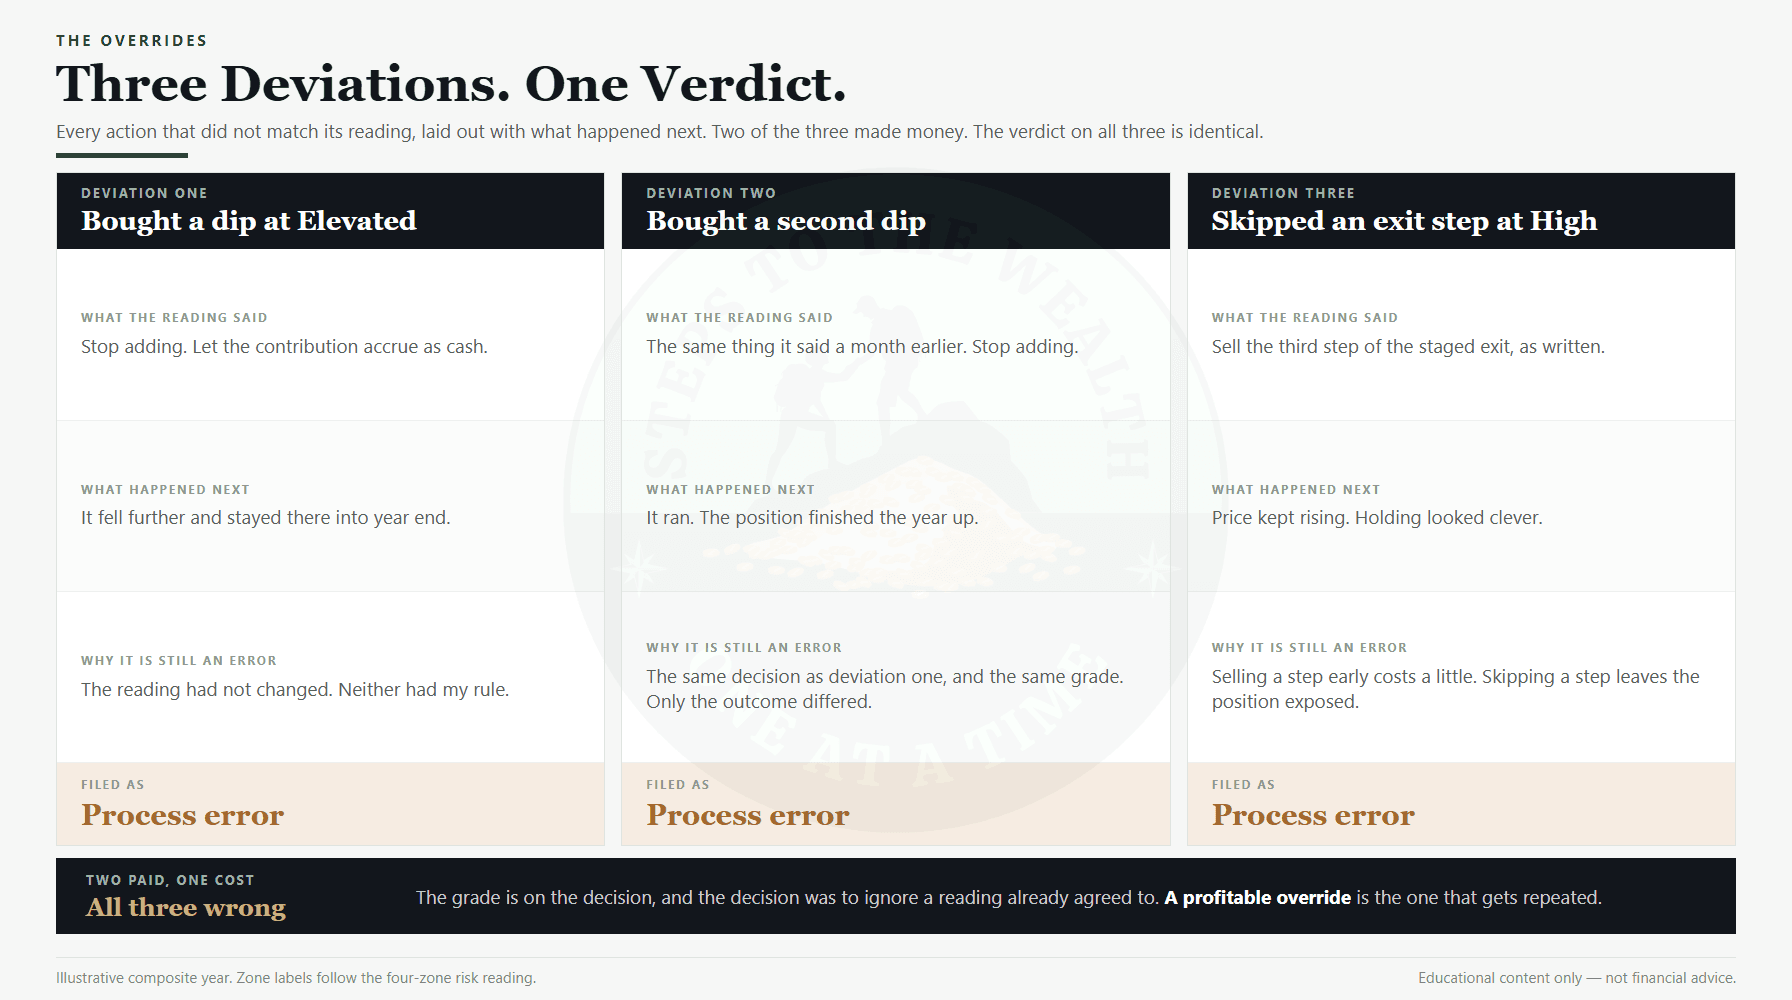
Two of the three made money. All three are filed as process errors, because the grade is on the decision and the decision in each case was to ignore a reading already agreed to. The profitable ones are the dangerous entries: a deviation that costs money corrects itself, while a deviation that pays gets remembered as instinct and repeated.
Writing them out also exposes how similar they are. Deviations one and two were the same decision taken a month apart, and only the results differed. If they had been recorded as a win and a loss instead of as one repeated error, the year would have taught that the behaviour works half the time, which is a conclusion that survives right up until the size is large. Deciding in advance how money gets deployed is what removes the daily judgement call that produces these in the first place.
What an annual investing review cannot tell you
The review grades behaviour, so it is silent about several things people expect it to answer. It does not compare the result to any alternative either; deciding what to benchmark your portfolio against is a separate construction with its own four requirements.
It cannot tell you whether you will do well, because the largest remaining variable is temperament and temperament is not installed by a scorecard. It is, however, measurable. Barber and Odean’s study of 66,465 households from 1991 to 1996 found the market returned 17.9% a year while the average household earned 16.4% and the busiest fifth of traders earned 11.4%. That is 1.5 points behind for the average household and 6.5 points behind for the most active, produced entirely by what people did to their own portfolios.
The original paper is free to read, and it remains the cleanest evidence that activity and results move in opposite directions.
Knowing which failure mode you are prone to is worth more than any single year’s score, and Morningstar’s four behavioural investor types is a reasonable map of the common ones. A review can remove the structural excuses for bad temperament. It cannot supply good temperament.
It also cannot tell you whether your allocation is right. That is a separate decision about how much risk belongs in the portfolio at all, and the regulator’s plain guide to asset allocation is a better starting point than any single year of readings. And it cannot tell you whether you are on track, which is a question about the size of the gap between where the plan lands and where you need it to, not about whether you followed the plan. Comparing your balance against what other people your age have saved answers a different question again, and usually a less useful one.
How to run your own annual investing review
You do not need anything I have that you do not already have. The exercise takes an afternoon with your statements and your notes open.
- List every meaningful action you took across the year: entries, exits, trims, skips and overrides. If you cannot reconstruct them, that is the first finding.
- For each one, write down what the reading was at the time and whether your action matched it. Use what you recorded then, not what you remember now.
- Grade the call, not the result. Was the action correct given what was knowable? Then, separately and in a different column, note whether it worked out.
- Put every deviation in the error column, including the profitable ones. This is the step people skip and the step that does the work.
- Name each genuine framework error precisely: which input was distorted, how you would recognise it earlier, and what you would size down to next time.
- Total both columns. Write the process score and the outcome score side by side, and resist reconciling them.
What you end up with is not a verdict on whether you won this year. It is a map of where your process is solid and where it leaks. That map is worth considerably more than the number, because the number resets in January and the process is the part that compounds.
How often to run it, and what not to do in between
Once a year, plus whenever your circumstances genuinely change: a job move, a vesting cliff, a house, a new dependant. Between those dates the correct number of annual reviews is zero, and the temptation to run a small one every quarter is the same impulse the review exists to catch.
This does not replace the weekly read. The reading still happens on its fixed cadence and still maps to one action, because risk conditions change over weeks while prices change every second. That cadence is also the only one that survives a real job, which is the entire premise of running a system in the margins of a working week. The annual review sits on top of it and grades the year of decisions the weekly read produced.
One more warning about frequency. Reviewing more often does not produce a better process, it produces more occasions to talk yourself into changing something, and the cost of that is exactly what the household data above measures. The cost of sitting still is a real thing worth quantifying, but it is not paid by reviewing less. It is paid by not deciding at all.
Frequently asked questions
What is an annual investing review?
It is a once-a-year grading of the decisions you made, judged against what was knowable at the time rather than against how they turned out. It produces two scores that are kept separate: how often your actions matched your own rules, and how often they made money.
Is this useful if I only buy an index fund on a schedule?
Yes, and it is shorter. The review then has one question: did every scheduled contribution go in at the size you set, or did some of them get skipped, delayed or resized because of how a month felt? Those skips are the entire process record of a simple plan, and they are usually the only thing separating it from the return it was supposed to deliver.
What if I have no framework to grade against?
Then the first review has one finding: nothing was setting the sizes, so there is no call to grade. Write down the rule you will use next year before the year starts, in whatever form you will actually follow, and the next review has something to measure. A rule written in January and graded in December is worth more than a sophisticated one invented in hindsight.
Does a losing year mean the process failed?
No, and treating it that way is the most common way sound approaches get abandoned. A losing year with a high process score is what a framework looks like when the environment did not cooperate. A winning year with a low process score is a warning, not a result. Only a run of years carries enough information to judge the framework itself.
Grade the readings, not the results
An honest annual investing review ends with a page that would look strange to most investors: two scores that disagree, one comfortable bucket you barely look at, one uncomfortable bucket you keep on purpose, and a short list of deviations that includes the ones that made money.
That page is the point. The year’s return was mostly handed to you by conditions. The decisions were entirely yours, and they are the only part that carries forward.
Grade the readings, not the results. Keep at least one sound call that lost and one lucky override on the page, and the review will already be more honest than almost anyone’s.
Educational content only. Not financial advice. The year described here is an illustrative composite rather than a record of actual returns, and nothing in it is a recommendation about any asset. Historical figures cited are worked examples of past behaviour, not forecasts. Your own review and decisions depend on your circumstances — work with a qualified financial professional before acting on any of this.