
Educational content only. Not financial advice.
Position sizing rules are the only input you set exactly
Almost all retail investing content is about selection. Which stock, which fund, which sector, which entry. Selection is a forecast, and a forecast is a thing you can be wrong about.
Position size is not a forecast. It is a number you choose with complete information, before anything happens, and it does precisely what you set it to do. There is no version of the future in which the 10% you allocated turns out to have been 40% on the day it mattered.
That is the case for taking position sizing rules seriously. They are the one part of a portfolio that is fully under your control and fully computable in advance. Everything else is an estimate wearing a decimal point.
What follows is the arithmetic, not the psychology. The psychology of holding a winner past its cap already has its own piece. This one is about what a given cap costs you, what it buys you, and how to work out where yours should sit.
What one position going to zero actually costs
Start with the simplest possible failure. A single holding goes to zero. Not down 40%, not suspended — gone.
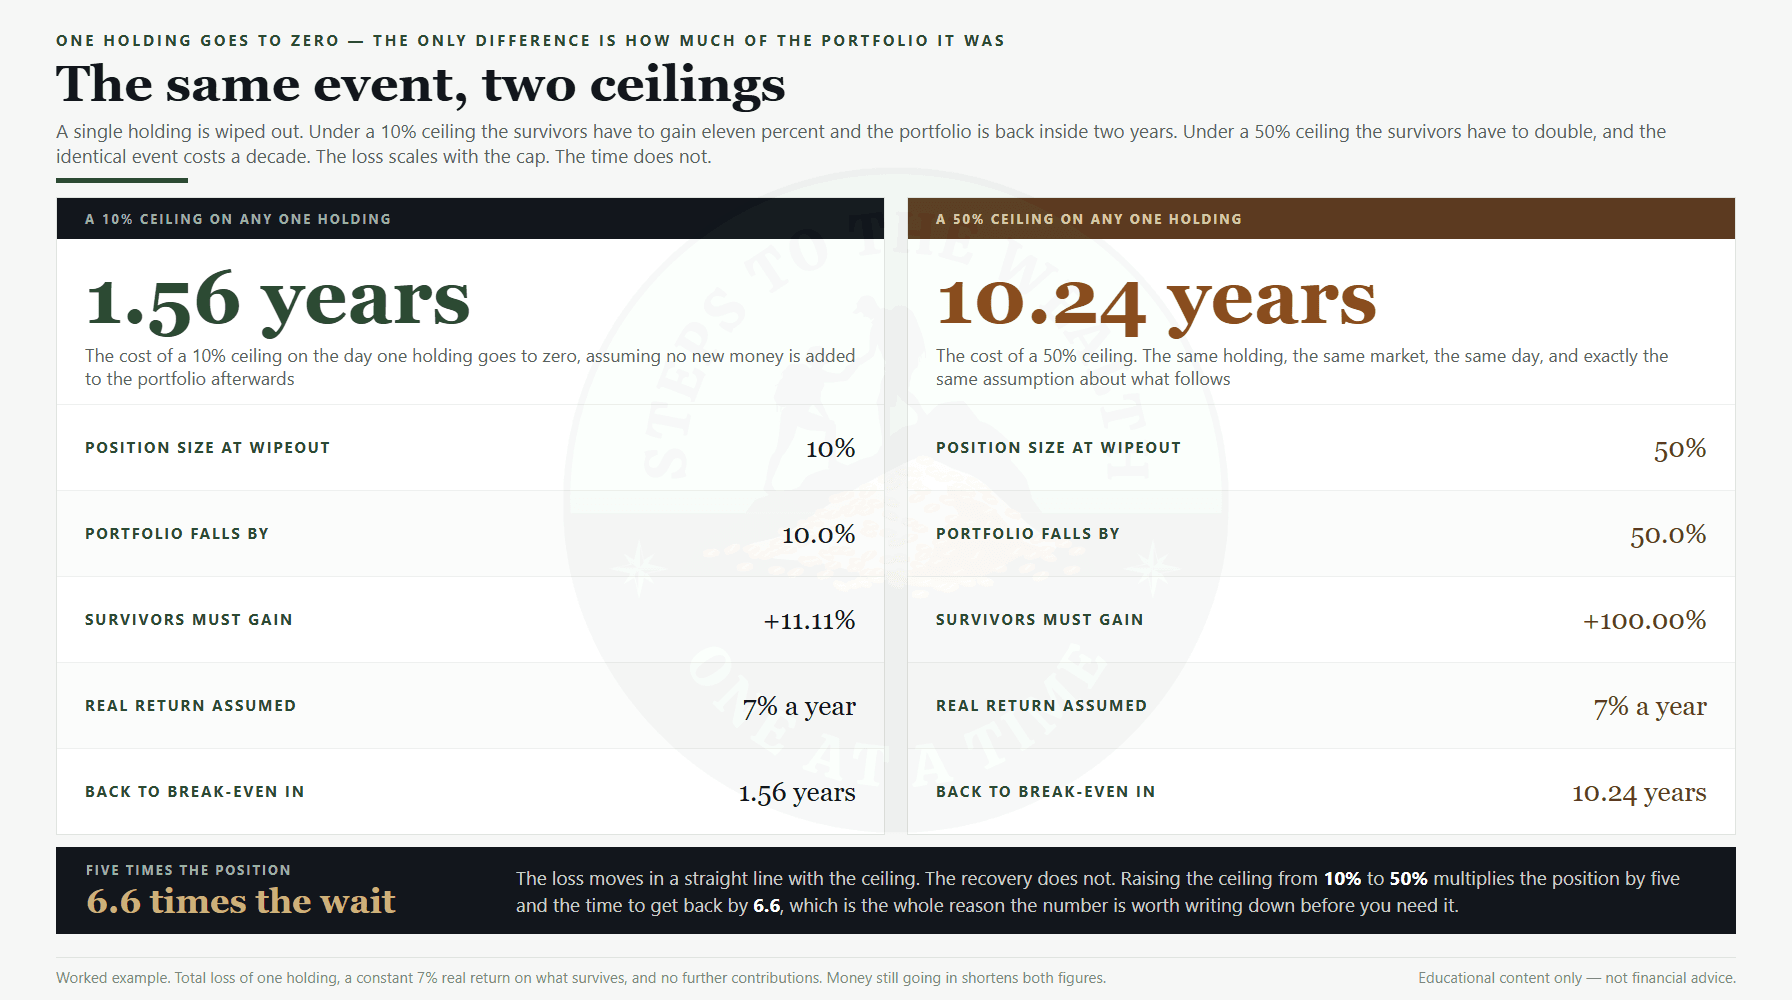
If that holding was 10% of your portfolio, the portfolio falls 10%. To get back to where it was, the remaining 90% has to gain 11.11%, because you are now climbing out of a smaller base. At a long-run 7% real return, that takes 1.56 years.
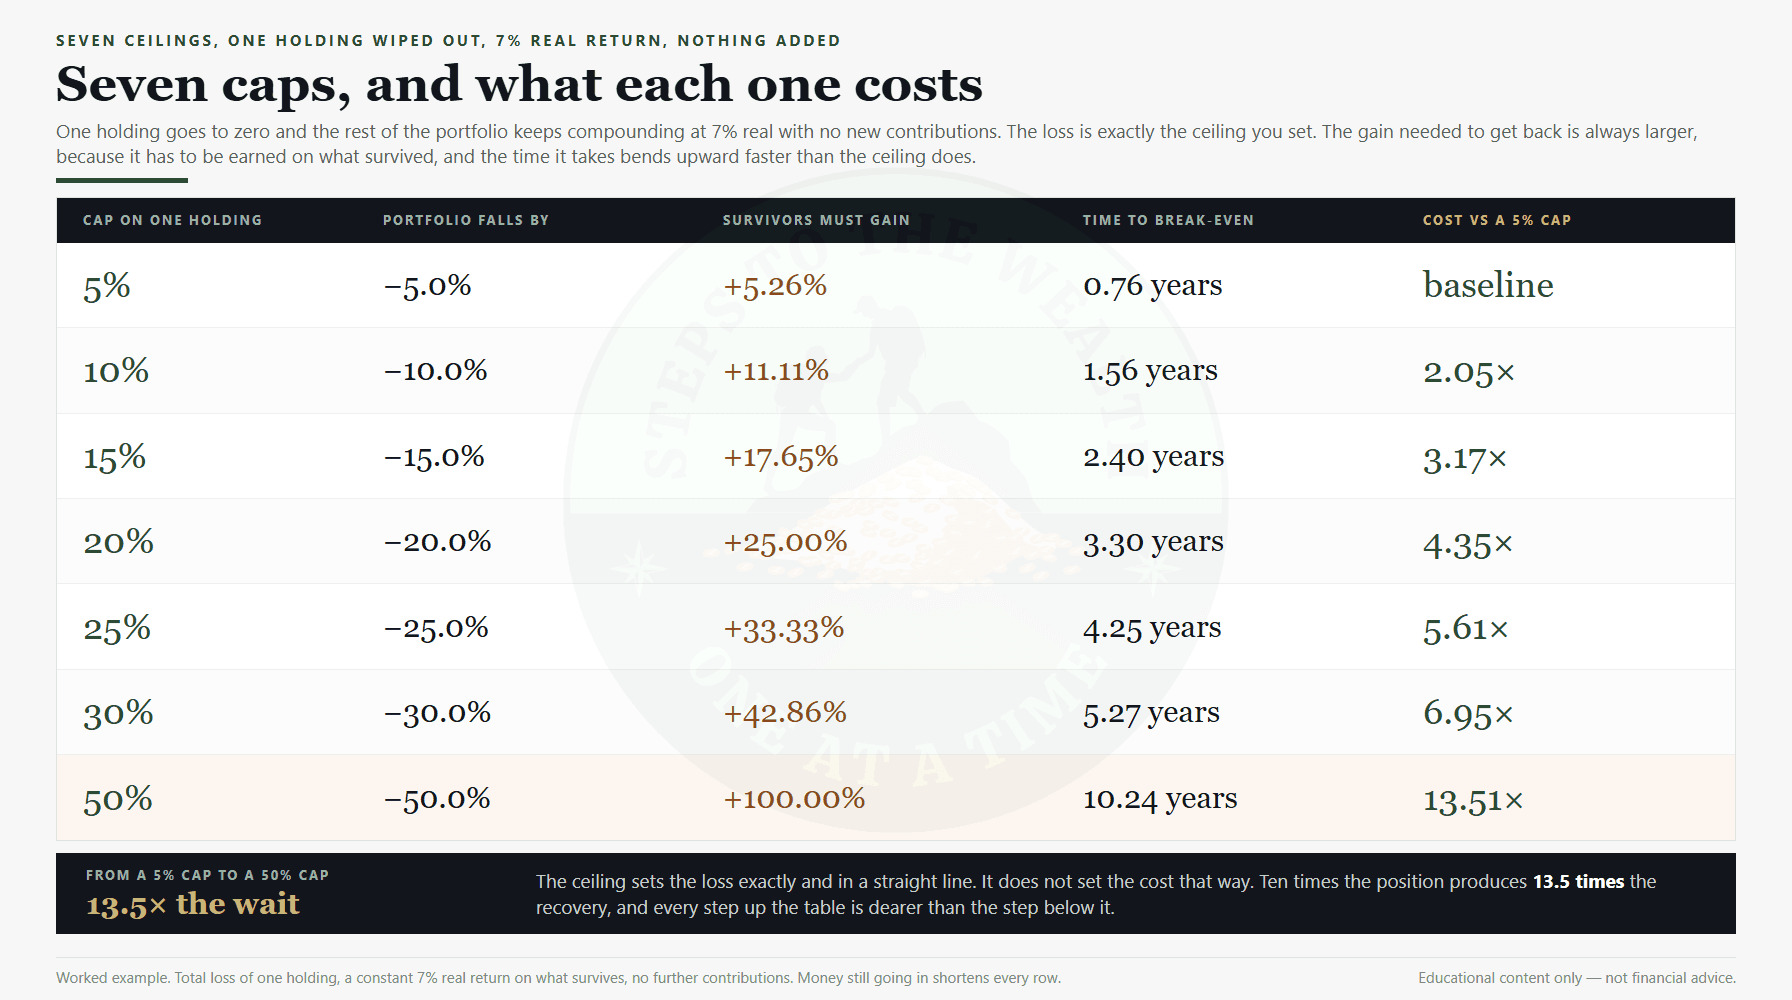
Now make the same position 30%. The portfolio falls 30%. The remaining 70% has to gain 42.86% to get back, which takes 5.27 years.
Three times the position. Three and a half times the recovery. The relationship is not linear, and the gap widens as you go up.
At 50%, the survivors have to double. That is 10.24 years at the same rate — five times the position of the 10% case, and six and a half times the recovery time. This is the arithmetic behind the phrase “lost decade”, and it does not require a market crash. One holding is enough.
The number that matters here is not the loss. It is the time, because time is the only input in compounding you cannot replace. A recovery year produces no progress, and it comes out of a supply you have already partly spent.
The cost curve bends, and that is the whole argument
Lay the sizes out in a row and the shape becomes obvious. Each step up in cap costs more than the last one did.
Going from a 5% cap to a 10% cap adds about nine and a half months to the worst case. Going from 25% to 30% adds twelve. Going from 30% to 50% adds five years.
That curvature is why a cap is a better instrument than a preference. If the cost of concentration rose in a straight line, you could reasonably trade a bit more risk for a bit more upside and call it a judgement call. It does not rise in a straight line. Past a certain point you are paying years for percentage points.
One honest caveat before that table gets over-read. It assumes you stop and wait: no new contributions, and the rest of the portfolio compounding at a steady rate. A working professional still paying in every month recovers faster than this, sometimes much faster, because fresh capital does part of the climbing.
The shape survives that adjustment. The absolute numbers do not. Treat the column as a ranking of caps against each other, not as a prediction of your own calendar.
Total loss is the clean case rather than the common one, and the same arithmetic handles the partial version. Take a 60% fall, which is a realistic stress for a single company rather than an extreme one.
At a 10% position that costs the portfolio 6%, needs 6.38% back, and takes about 11 months. At 30% it costs 18%, needs 21.95% back, and takes 2.93 years. Same curvature, smaller numbers, and the ordering between caps is identical.
Which is the useful part. You do not have to agree with anyone about how bad the worst case is. Pick your own loss, run it through the same two steps, and the caps still rank in the same order. The stress you assume changes the years. It does not change the answer about which cap is defensible.
Equal dollars are not equal risk
The most common attempt at discipline is equal weighting. Five positions, 20% each. Ten positions, 10% each. It feels systematic, and it is a genuine improvement on sizing by mood.
It is also not what it claims to be. Equal dollar amounts only produce equal risk if every holding moves with the same amplitude, and they never do.
Take three holdings whose annual volatility runs 15%, 30% and 60% — roughly the spread between a broad index fund, a single large-cap and something genuinely speculative. Put a third of the money in each.
The contribution each one makes to the portfolio’s swing is its weight times its volatility. That gives 5, 10 and 20 in arbitrary units, which normalises to 14.3%, 28.6% and 57.1% of the total risk. One third of your money is producing well over half of your movement.
Now size them the other way, in inverse proportion to volatility. The weights come out at 57.1%, 28.6% and 14.3% — the same three numbers, in the opposite order. Each holding then contributes exactly one third of the risk.
The mirror is not a coincidence. It is what the arithmetic does when you invert the input, and it makes the point cleanly: equal weighting hands the largest share of your risk to the holding you understand least.
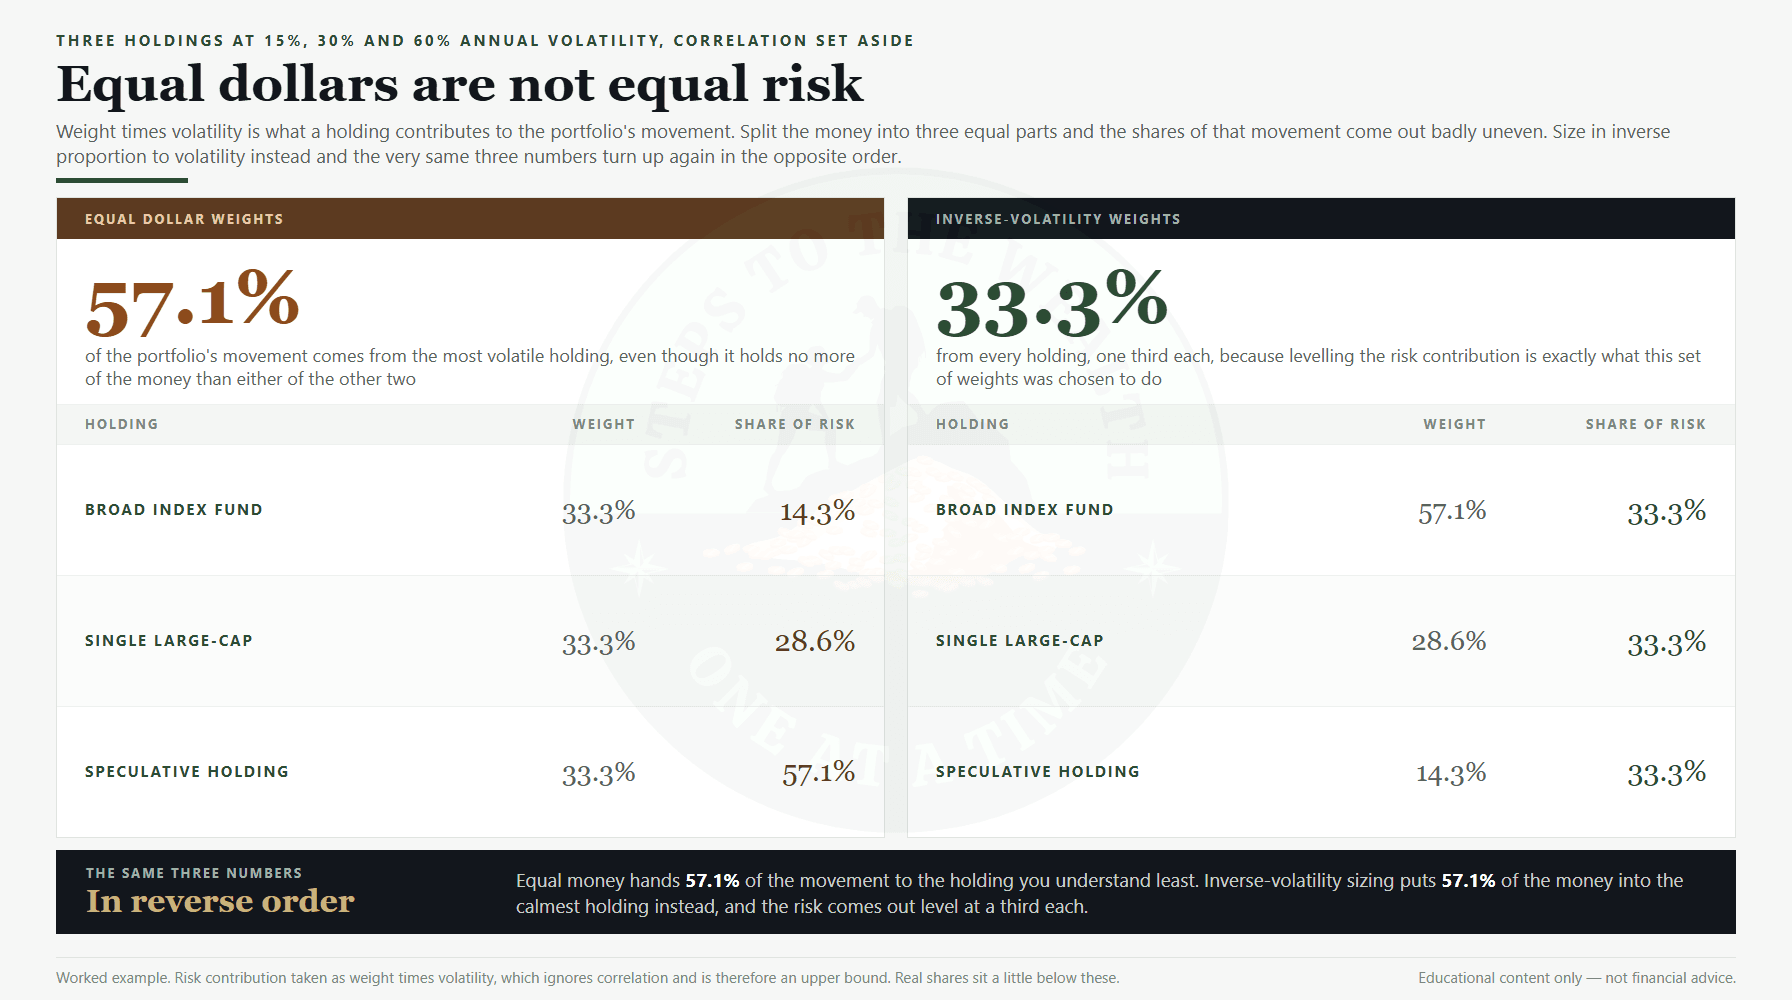
That version deliberately ignores correlation, which makes it an upper bound rather than an exact figure. Holdings that do not move together offset some of each other’s swing, so the real concentration sits a little below 57.1%.
It is close enough to act on, and the direction is never in doubt. For the fuller account of what diversification does and does not remove, that has its own arithmetic. Keep it separate from the related point that volatility and risk are not the same thing. Volatility is what you size against. Permanent loss is what you are sizing to avoid.
The cap you set is not the cap you keep
Caps do not usually break because you broke them. They break because the position wins.
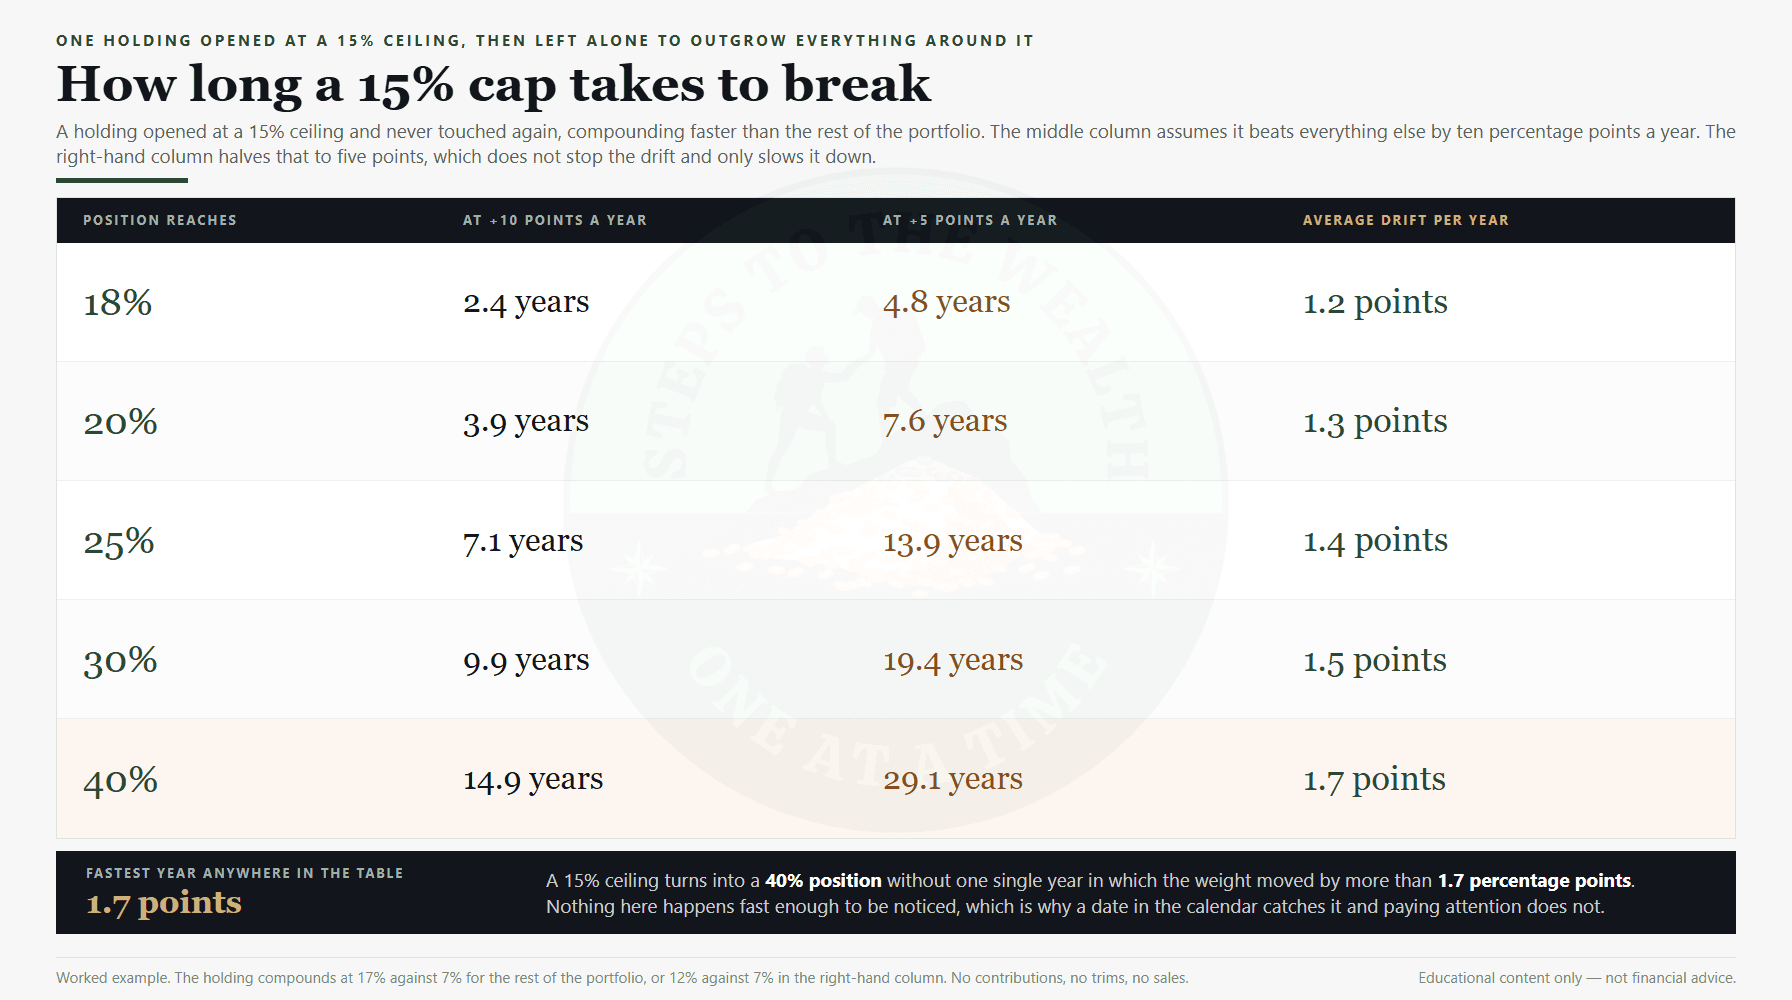
Say you open at a 15% cap and the holding then beats the rest of your portfolio by ten percentage points a year — 17% against 7%. Nothing dramatic. Just a good position doing what you hoped it would.
It crosses 18% after 2.4 years. It reaches 20% after 3.9 years. It hits 25% after 7.1 years and 30% after 9.9 years.
Nobody notices that. There is no day on which the position becomes oversized, no alert, no moment of decision. It works out at roughly a percentage point a year, which is below the resolution most people check at.
Halve the outperformance to five points and the drift is slower but no less certain: 20% after 7.6 years, 30% after 19.4 years. A career-length holding period is more than enough time for a modest winner to become your largest single risk without ever announcing it.
This is the argument for a scheduled review rather than an attentive one. Attention catches events. Drift is not an event, so only a date on a calendar catches it. The annual review exists for exactly this class of problem, and the line between rebalancing and chasing is drawn by whether the date was set in advance.
The trim is bigger than the gap
Here is a small piece of arithmetic that catches people, and it is worth getting right because it changes the order you actually enter.
A holding capped at 15% has drifted to 20%. How much do you sell?
If the proceeds stay inside the portfolio — moved to cash, or into another holding — the answer is the obvious one. Sell 5% of the portfolio. The total does not change, so the difference is the difference.
If the proceeds leave the portfolio, the answer is different. Selling shrinks the denominator as well as the numerator, so 5% is not enough. You need 5.88% of the portfolio to land at a 15% weight, and you can check it: 20 minus 5.88 is 14.12, over 100 minus 5.88, which is 15.00%.
The gap widens as the overshoot does. A 20% cap that has drifted to 30% needs 12.5% sold, not 10%. Under-trimming by a fifth is the standard error here, and it leaves you above your own cap while believing you are back inside it.
Small point, real money. It is also the kind of thing a written rule catches and a mental one does not.
What a workable set of caps looks like
Caps are personal, and anyone who hands you a table without knowing your income, your horizon or your obligations is guessing. What follows is a structure rather than a prescription.
Cap by volatility band, not by name. The question is not whether you like the holding. It is how far it can move against you. A broad index fund is internally diversified and can carry a large share. A single company cannot, however good it is.
Set the cap where the worst case is survivable, then stop arguing. Run the recovery arithmetic above at whatever loss you think is genuinely possible for that holding, not the loss you expect. If the answer is a number of years you would not accept, the cap is too high. That is the entire test.
Cap the category as well as the holding. Five positions at 8% each in the same sector is a 40% sector bet wearing five names. Position-level caps alone do not catch that, which is why the category line has to be written separately.
Count what you already own. A great many working professionals are heavily exposed to property through the home they live in, and to one employer through salary and equity together. Both belong in the exposure calculation, which is where the property comparison tends to land differently than expected.
Write the caps down before you need them. A cap calibrated during a drawdown is not a cap, it is a reaction. The whole value of the number is that it was set at a moment when nothing was happening.
Check that the caps can actually coexist. A 10% cap on everything implies at least ten holdings, because the weights have to sum to 100. If you hold six things and claim a 10% ceiling, the claim is arithmetically false and at least one position is above 16%. Caps that cannot add up are not rules, they are intentions.
You can pressure-test a proposed set against real drawdowns with the portfolio stress test before committing to them, which is cheaper than finding out live.
Conviction is not a sizing input
The failure that does the most damage is not the one you would guess. It is not the speculative punt. It is the high-conviction position sized by how convinced you are.
The logic feels sound: more confidence, more capital. But conviction measures your certainty, and your certainty is not a property of the asset. It is a property of you, and it runs highest exactly when you have spent the most time on the research — which is to say, when you are most invested in being right.
Size measures consequence. Those are different quantities, and substituting one for the other is how a 40% position gets built by someone who would never describe themselves as a gambler.
The test is not “how sure am I”. It is this: if this went to zero next month, what would the recovery arithmetic say? If the answer is four years, it is a four-year bet regardless of how good the thesis is. Run that test on the holding you are most certain about. That is the one it exists for.
None of this says concentration is always wrong. It says concentration should be priced before it is taken, and that a margin of safety in the analysis is not a substitute for a margin of safety in the sizing. They protect against different failures.
A cap is a ceiling, not an opening order
One thing worth separating: the cap is the maximum a position may reach. It is not the amount you buy on day one.
A 15% ceiling reached in a single purchase gives you one entry price and no way to improve it. The same 15% built in layers gives you several cost bases, and the average lands wherever the layers landed rather than wherever the market happened to be on the afternoon you had cash.
That is the mechanism behind a dynamic contribution schedule: the ceiling is fixed by the sizing rules, and the speed of filling it varies with conditions. High risk reading, fill slowly. Low risk reading, fill faster. A market risk indicator is one way to make that reading mechanical rather than intuitive.
The two decisions are genuinely separate. Sizing answers how much this holding may ever be. Scheduling answers how quickly it gets there. Confusing them produces a portfolio that is either fully committed at the wrong time or permanently underweight everything.
Cash sits inside this too, and not as a residual. Cash is a position with its own weight, and the room it leaves you is the reason a cap can be filled deliberately instead of all at once.
What this arithmetic leaves out
Four honest limitations, because a framework that only shows its strong side is marketing.
It is tax-free and friction-free. Every figure here is a real return with no tax on the trim. In practice, selling to enforce a cap can trigger a bill that changes the calculus, and the treatment depends entirely on the jurisdiction in which you live. That is a conversation with someone who knows your local rules, not something a general article can price.
Volatility is backward-looking. Sizing in inverse proportion to volatility uses the past to estimate the future. Volatility is more persistent than returns are, which is why the method works at all, but a quiet holding can become a loud one without warning.
Correlation moves when it matters most. Positions that look independent in calm markets tend to converge in a genuine crisis, which is when the diversification was supposed to pay. Caps that assume offsetting behaviour are least reliable at the moment they are most needed, and the order in which returns arrive can matter more than the average.
A cap is not a floor under quality. Correct sizing on a portfolio of bad holdings produces a slower, more orderly decline. Sizing controls the damage any single decision can do. It does not make the decisions good. For the general case that a written rule beats an attentive one, that argument sits here.
Set your caps this week
This is an hour of work, once, and then a date in the calendar.
Step one. List every holding and its current percentage of your invested capital. Include the cash. Leave out the home you live in for now, but write it down separately, because it belongs in the category line later.
Step two. For each one, ask what a genuinely bad outcome looks like — not the expected one. Down 60% is a reasonable stress for a single company. Total loss is the right test for anything speculative.
Step three. Run the recovery arithmetic. Multiply the holding’s weight by the loss, divide by what is left, and see how many years at 7% that gain takes. If the number is longer than you would tolerate, the cap is too high. Write down the cap that makes it tolerable.
Step four. Add the caps up by category. Equities, property, speculative, cash. If any category total is higher than you intended, the problem is at that level and no individual cap will fix it.
Step five. Mark the review date. Once or twice a year, not when something happens. Drift is slow enough that anything more frequent is noise, and anything less frequent lets a winner become your largest risk unobserved.
If the exercise tells you a position already sits well past where it should, that is a finding, not a failure — and the hard part is acting on it rather than knowing it. That gap between knowing and acting is what The Operator’s Mindset is built around: fifteen lessons, $99 one-time. If you would rather start by seeing how far the current portfolio sits from the plan it is supposed to serve, that gap has its own arithmetic.
Selection decides what you can earn. Position sizing decides whether you are still in a position to collect it. The second one is the part you set exactly, so set it on purpose. On the broader question of how much of any of it should be in equities at all, the regulator’s plain-language guide to asset allocation is a reasonable place to start.
Related reads
- Position sizing when the bull is running
- What diversification actually removes
- Recovering from a big loss
- When not to invest more
- All the calculators, in one place
Educational content only — not financial advice. All figures are worked examples using a constant 7% real return and no further contributions. Real markets deliver neither. Position sizes should be calibrated to your own horizon, obligations and liquidity needs, and tax treatment on any trim is set by the jurisdiction in which you live. Past performance does not predict future results.