
In 2021 a three-month Treasury bill returned 0.04% for the year. In 2023 the same instrument returned 5.28%. Nothing about the asset changed. It was still the shortest, dullest, most boring place to park money that exists. What changed was the rate, and the rate is not a property of cash — it is a property of the moment.
That swing is why so many plans got rewritten twice in three years. When cash paid nothing, holding it felt obviously wrong. When it paid five, holding it felt obviously right. Both feelings were reactions to a headline number, and the headline number is not what you keep. The real return on cash is what is left after the tax authority takes its share of the interest and inflation takes its share of the balance, and on a 4.21% yield those two deductions can leave less than a fifth of one percent.
What follows is the arithmetic, done once and done exactly. The two deductions in order, priced on a concrete balance. The single formula that tells you what a cash yield has to be before it is doing anything at all. Ten years of what cash actually paid. And what all of it does, and does not, change about a decision to wait. Every figure here is closed from assumptions stated on the page. Rates and tax treatment differ everywhere, so the numbers are illustrations of a method, not a forecast and not advice.
What the real return on cash actually is
Three numbers describe any cash holding, and only the first one gets printed anywhere you can see it.
The headline yield is the advertised rate. It is a gross, pre-tax, pre-inflation number, and it is the only one your bank, your broker or your money market fund puts on the screen.
The after-tax yield is what actually lands. Interest is generally taxed as ordinary income in the year you receive it, whether you spend it or not, and whether or not you meant to earn it. If your marginal rate is 25%, a quarter of every interest payment is gone before you have made a single decision about it.
The real return on cash is what is left after inflation. It is not the after-tax yield minus the inflation rate. It is the after-tax yield deflated by the inflation rate, which is a division and not a subtraction. The distinction is small at low rates and large at high ones, and it is worked through in detail in inflation vs nominal returns.
The order matters and it only runs one way. Tax is levied on the nominal interest, so tax comes first. Inflation applies to the whole balance including the interest that survived, so inflation comes second. Reverse the two and you will flatter the answer, because you will be taxing a smaller number than the one the tax authority is actually looking at.
The two deductions, priced on a $40,000 balance
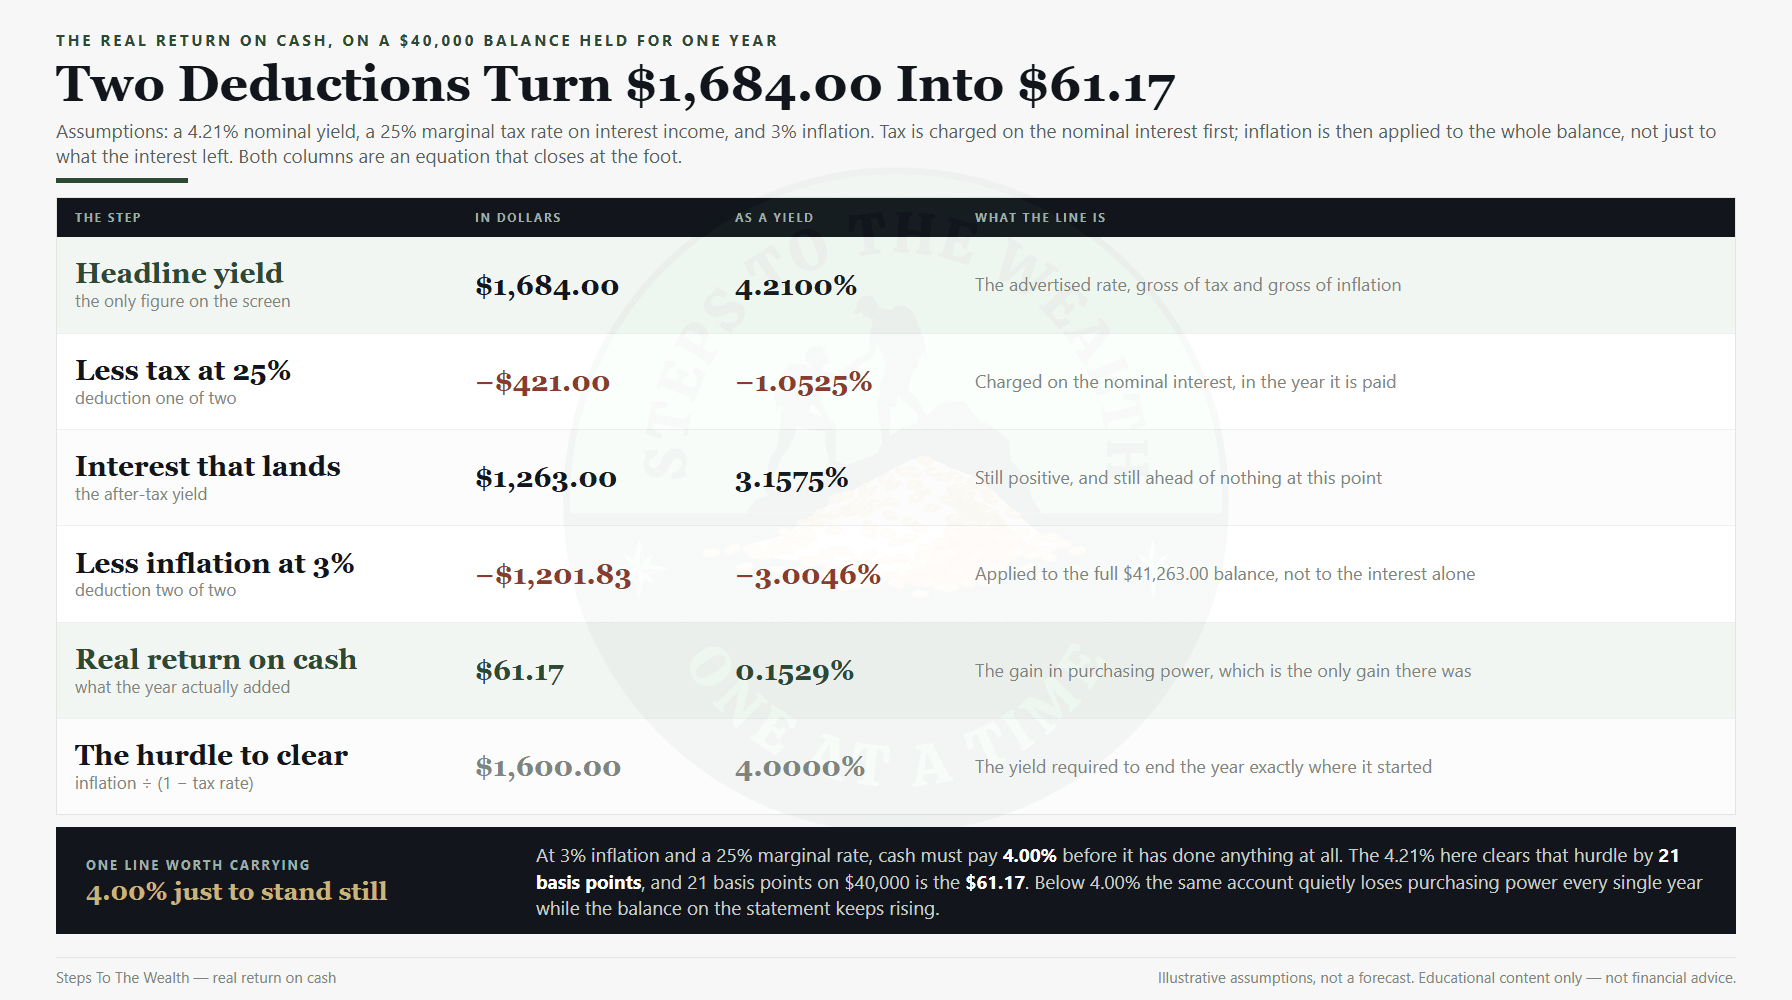
Take a balance of $40,000 held in cash for one year. Assume a nominal yield of 4.21%, a 25% marginal rate on interest income, and inflation of 3%. Those three assumptions are the entire model. Change any of them and the answer changes, which is the point.
The gross interest is $1,684.00. That is the number that shows up in the account, the number that feels like a return, and the number most people would quote if asked what their cash earned.
Tax takes $421.00 of it. What is left is $1,263.00, which is an after-tax yield of 3.1575%. Still a positive number, still visibly more than zero, and at this point the holding still looks like it is working.
Then inflation. Dividing 1.031575 by 1.03 gives 1.00152913, so the real return on cash for the year is 0.1529%. On $40,000 that is a gain in purchasing power of $61.17.
So $1,684.00 of headline interest became $61.17 of actual buying power. Not a loss. Not a disaster. But roughly one twenty-eighth of the number on the statement, and nowhere near what the word “four percent” suggests to anybody who has not done the division.
What cash actually paid, ten years running
The 4.21% in the example is not invented. It is the calendar-year return on three-month Treasury bills for 2025, taken from the long-run dataset maintained by Aswath Damodaran at NYU Stern, which carries annual returns on that instrument back to 1928. The full series is public and worth looking at directly at the NYU Stern historical returns dataset.
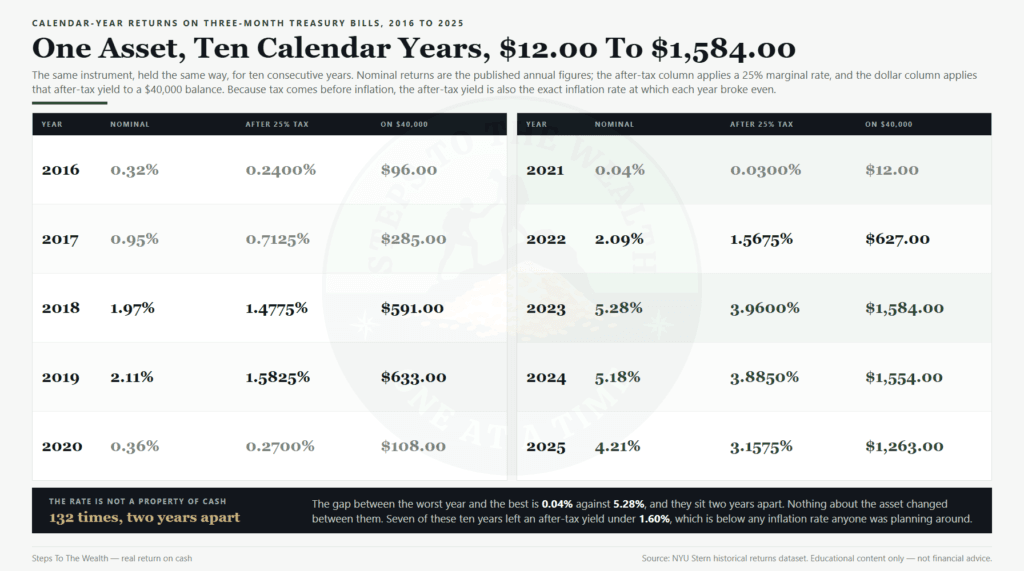
Across 2016 to 2025 the same instrument paid 0.32%, 0.95%, 1.97%, 2.11%, 0.36%, 0.04%, 2.09%, 5.28%, 5.18% and 4.21%. Ten consecutive years, one asset, and a spread from four basis points to five hundred and twenty-eight.
Run each of those through a 25% marginal rate and you get the after-tax yield for that year. In 2021 that is 0.03%. In 2023 it is 3.96%. And because the real return is the after-tax yield deflated by inflation, the after-tax yield is also the exact inflation rate at which that year broke even. Anything above it and the holding lost purchasing power.
This is the part that gets missed. The question is never whether the rate is high. The question is whether the rate cleared its own hurdle in the year it was paid, and the two highest-paying years on that list arrived in the company of the highest inflation of the decade. A 5.28% yield against 4% inflation and a 25% tax rate is not a windfall. It is a small real loss wearing a large nominal number.
The hurdle: inflation divided by one minus your tax rate
There is one formula worth carrying, and it fits on a line. To stand still — to end the year with exactly the purchasing power you started with — a cash yield has to be at least:
required nominal yield = inflation rate ÷ (1 − marginal tax rate)
At 3% inflation and a 25% marginal rate, that is 3% ÷ 0.75 = 4.00%. Below 4.00%, cash is losing ground. At exactly 4.00%, it is doing nothing at all. The 4.21% in the worked example clears the hurdle by 21 basis points, and 21 basis points on $40,000 is the $61.17.
Push the marginal rate to 40% and the same 3% inflation demands 5.00%. Drop the tax to zero, as it may be inside a tax-sheltered account, and the hurdle falls straight back to the inflation rate itself. The tax rate is doing most of the work in this formula, which is why two people looking at the identical advertised rate can be in genuinely opposite situations.
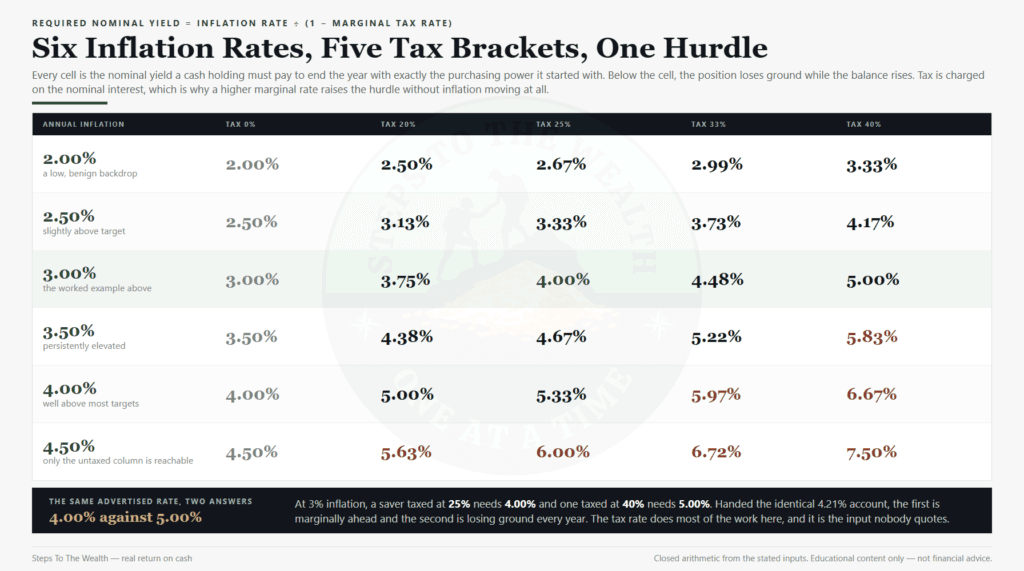
Read the grid once and a lot of noise disappears. At 2% inflation and no tax, 2.00% is enough. At 4% inflation and a 40% rate, you need 6.67% before the holding has done anything, and there are long stretches of history in which no cash instrument offered that. The hurdle is not a rare event. For most of the decade above, cash could not clear it.
Nothing in this formula requires you to know where rates are going, which is what makes it usable. It is a description of the position you are in right now, priced off numbers you already have: the rate on your account, your own marginal rate, and whatever inflation assumption you are prepared to defend.
Ten years of standing still
One year of 0.1529% sounds like a rounding error, and over one year it is. The reason it matters is that people do not hold cash for a year. They hold it for the length of an indecision, which can run much longer than they intended.
Take the same $40,000 at the same 4.21%, 25% and 3%, and leave it alone for a decade. The nominal balance compounds at the after-tax rate of 3.1575% and reaches $54,584.34. Over those ten years the account throws off $19,445.79 of gross interest, of which $4,861.45 goes in tax.
Now deflate it. In today’s purchasing power, the $54,584.34 is worth $40,615.88. Ten years, nearly twenty thousand dollars of interest, and the balance buys $615.88 more than it did at the start. That is a real total return of 1.54% over a decade.
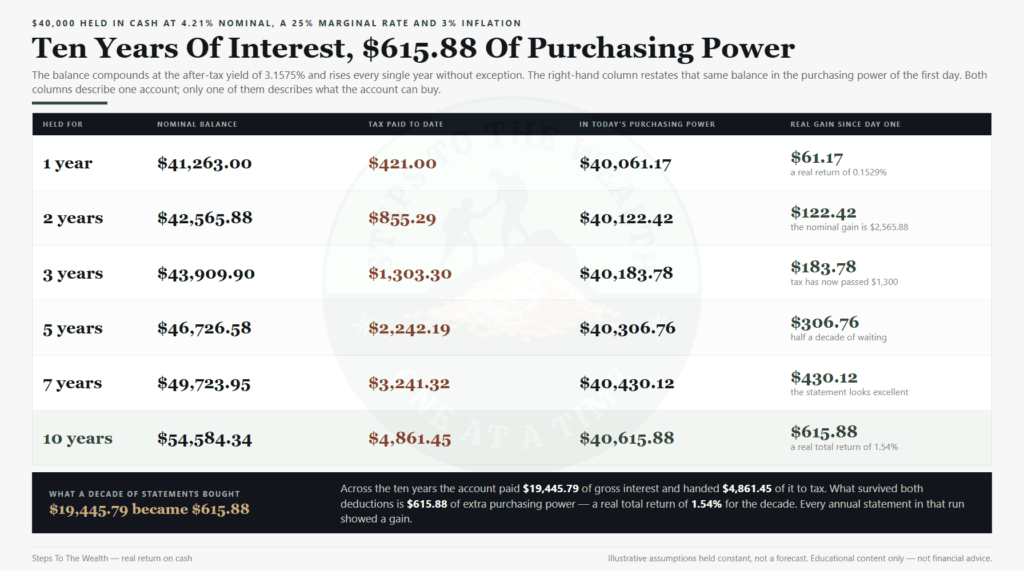
The two columns diverge in a way that is genuinely hard to see from inside the account. The nominal line goes up every single year, without exception, and every statement confirms it. The real line is almost flat. Somebody watching only the balance has ten years of continuous evidence that the position is working.
This is the honest case against cash as a default, and it has nothing to do with missing a rally. It is that a positive nominal number is emotionally indistinguishable from progress, and cash is the one asset that reliably supplies the first without the second.
Why the long-run real return on cash is close to zero
Over 98 calendar years from 1928 to 2025, three-month Treasury bills compounded at 3.37% a year in nominal terms. A hundred dollars became $2,579.18. Over the same 98 years, the S&P 500 with dividends reinvested compounded at 10.02%, and a hundred dollars became $1,157,590.84. Ten-year Treasury bonds landed at 4.53% and Baa corporate bonds at 6.63%.
The 3.37% is a nominal figure and inflation over that period consumed most of it. That is not a coincidence and it is not bad luck. Short-term rates are set, directly or indirectly, in response to inflation. When inflation rises, policy rates follow it up; when inflation falls, they follow it down. An instrument whose yield is continuously repriced against inflation is, by construction, an instrument whose real return hovers near zero over long periods.
Which means the long-run answer was never in doubt. Cash is not a growth asset and it is not trying to be one. Anyone expecting a cash yield to build wealth has mistaken the tool for a different tool, and this is the same conclusion reached from the other direction in cash is a position.
The useful question is therefore not whether cash beats equities. It does not, and no serious framework claims otherwise. The useful question is what a live cash yield does to the cost of a decision you were going to make anyway.
What a cash yield changes in a risk-first framework
In a risk-first system, capital that is not deployed is not idle by accident. It is waiting on a reading, and the reason it waits is that the framework says expected risk-adjusted returns on new capital are currently poor. That logic is set out in when not to invest more, and it does not reference the interest rate at all.
A cash yield does not change the reading. It does not make a stretched market less stretched, and it does not shorten or lengthen the wait. What it changes is the price of waiting. At 0.04%, holding dry powder cost you essentially the entire opportunity cost of the capital. At 4.21% with a 25% rate, that cost is reduced by 3.1575 points a year in nominal terms — real, useful, and still not a reason to wait longer than the framework says.
The failure mode is specific and worth naming. A high cash yield makes waiting comfortable, and comfortable waiting is how a temporary position becomes a permanent one. The investor who was going to deploy at the next low reading finds the 5% strangely persuasive, and stays. Three years later the balance is up, the purchasing power is flat, and the deployment never happened.
The discipline that prevents it is unchanged: the yield is an offset against the cost of a wait the framework has already justified, never a justification for the wait itself. If you want to price what a delay actually costs against the alternative, the opportunity cost calculator does that arithmetic directly.
When holding cash at a high yield is the right call
None of this argues for holding less cash. It argues for knowing what the cash is doing, and there are several situations in which the answer is straightforwardly good.
The emergency buffer. This money is not an investment and its real return is not the point. It is bought insurance, and the premium is the real return you give up. A yield of 4.21% simply means the insurance got cheaper, and the sizing question is handled separately in emergency fund vs investing.
Money with a date on it. Capital needed inside roughly five years has no business carrying equity risk, and a real return near zero is a perfectly acceptable outcome for it. That case is made in full in investing for short term goals.
Dry powder under a framework that actually deploys. The trade-off is explicit: you accept a near-zero real return in exchange for the option to deploy heavily when the reading turns. The option is only worth something if you exercise it.
Debt that costs more than the hurdle. Paying down a debt is a guaranteed, tax-free return equal to its rate. Against a cash yield that nets to 3.1575%, most consumer debt wins outright, and the comparison is worked through in pay off debt or invest.
What these have in common is that none of them are justified by the yield. The yield changes how much each one costs. It never changes which one is correct.
What this framing does not fix
Three limits, stated plainly, because a formula that is oversold becomes another false certainty.
It does not tell you your actual inflation rate. Published inflation is a basket average and your basket is not the average one. If your spending is concentrated in categories rising faster than the index, your personal hurdle is higher than the grid says and nothing here will detect that.
It does not handle tax treatment that varies by wrapper, instrument or jurisdiction. Interest inside a sheltered account may be untaxed until withdrawal or entirely; some instruments are taxed differently from deposits; rates and rules differ everywhere. The formula takes your marginal rate as an input and asks no questions about where it came from.
It does not price the risk you are avoiding. A near-zero real return with no drawdown is a different product from a higher expected return with a 50% drawdown attached, and the arithmetic here says nothing about which one belongs in a given plan. That comparison lives in the framework, not in the yield. And it does not predict rates: the whole point of the ten-year series is that nobody saw 0.04% or 5.28% coming.
Frequently asked questions
What is the real return on cash?
It is what a cash holding earns after both tax and inflation. Take the nominal yield, subtract tax at your marginal rate on the interest, then deflate the result by the inflation rate. At 4.21% nominal, a 25% marginal rate and 3% inflation, the real return on cash is 0.1529% a year.
How do I calculate the real return on cash?
Multiply the nominal yield by one minus your marginal tax rate to get the after-tax yield. Then divide 1 plus that figure by 1 plus the inflation rate and subtract 1. Do not simply subtract inflation from the yield — that shortcut overstates the answer, and the size of the error grows with the rate.
What yield does cash need just to break even?
Divide the inflation rate by one minus your marginal tax rate. At 3% inflation and a 25% rate, cash must pay 4.00% to hold purchasing power flat. At a 40% rate the same inflation demands 5.00%.
Does a high interest rate make holding cash a good idea?
It makes holding cash cheaper, not better. The decision about whether to hold cash comes from the plan — an emergency buffer, a dated goal, a risk reading — and the yield only prices what that decision costs. A high yield that arrives alongside high inflation may clear no hurdle at all.
Is a real return on cash of nearly zero normal?
Over long periods, yes. Short-term rates are repriced continuously against inflation, so the real return on cash tends toward zero by construction. Cash is a liquidity and stability instrument, not a growth one.
Should I compare a cash yield to my mortgage or debt rate?
Comparing like for like is the right instinct, and the comparison usually favours the debt, because paying it down is a guaranteed, untaxed return at its full rate while cash interest is taxed. Compare the debt rate against the after-tax cash yield, not the headline one.
Does this change if I hold cash inside a tax-sheltered account?
It removes the first deduction entirely, so the hurdle drops to the inflation rate itself. Inflation still applies, so the real return can still be negative — but the yield has one fewer obstacle to clear.
The one number to check first
Before deciding anything about how much cash to hold, work out the hurdle. Inflation divided by one minus your marginal rate. Compare it to the rate you are actually being paid. That single comparison tells you whether the position is gaining ground, standing still or quietly losing, and it takes about twenty seconds.
Then leave the answer where it belongs. The hurdle does not decide how much cash you should hold — your buffer, your dated goals and your risk reading decide that. It only tells you what the decision is costing, so that a comfortable nominal number never gets mistaken for progress.
If you want that reading arriving weekly rather than being reconstructed from memory, the Steps To The Wealth Weekly sends the risk readings and the action steps every Sunday.
Educational content only — not financial advice. Rates, tax treatment and inflation differ by jurisdiction and by person; every figure above is an illustration closed from the assumptions stated beside it, not a forecast or a recommendation.