
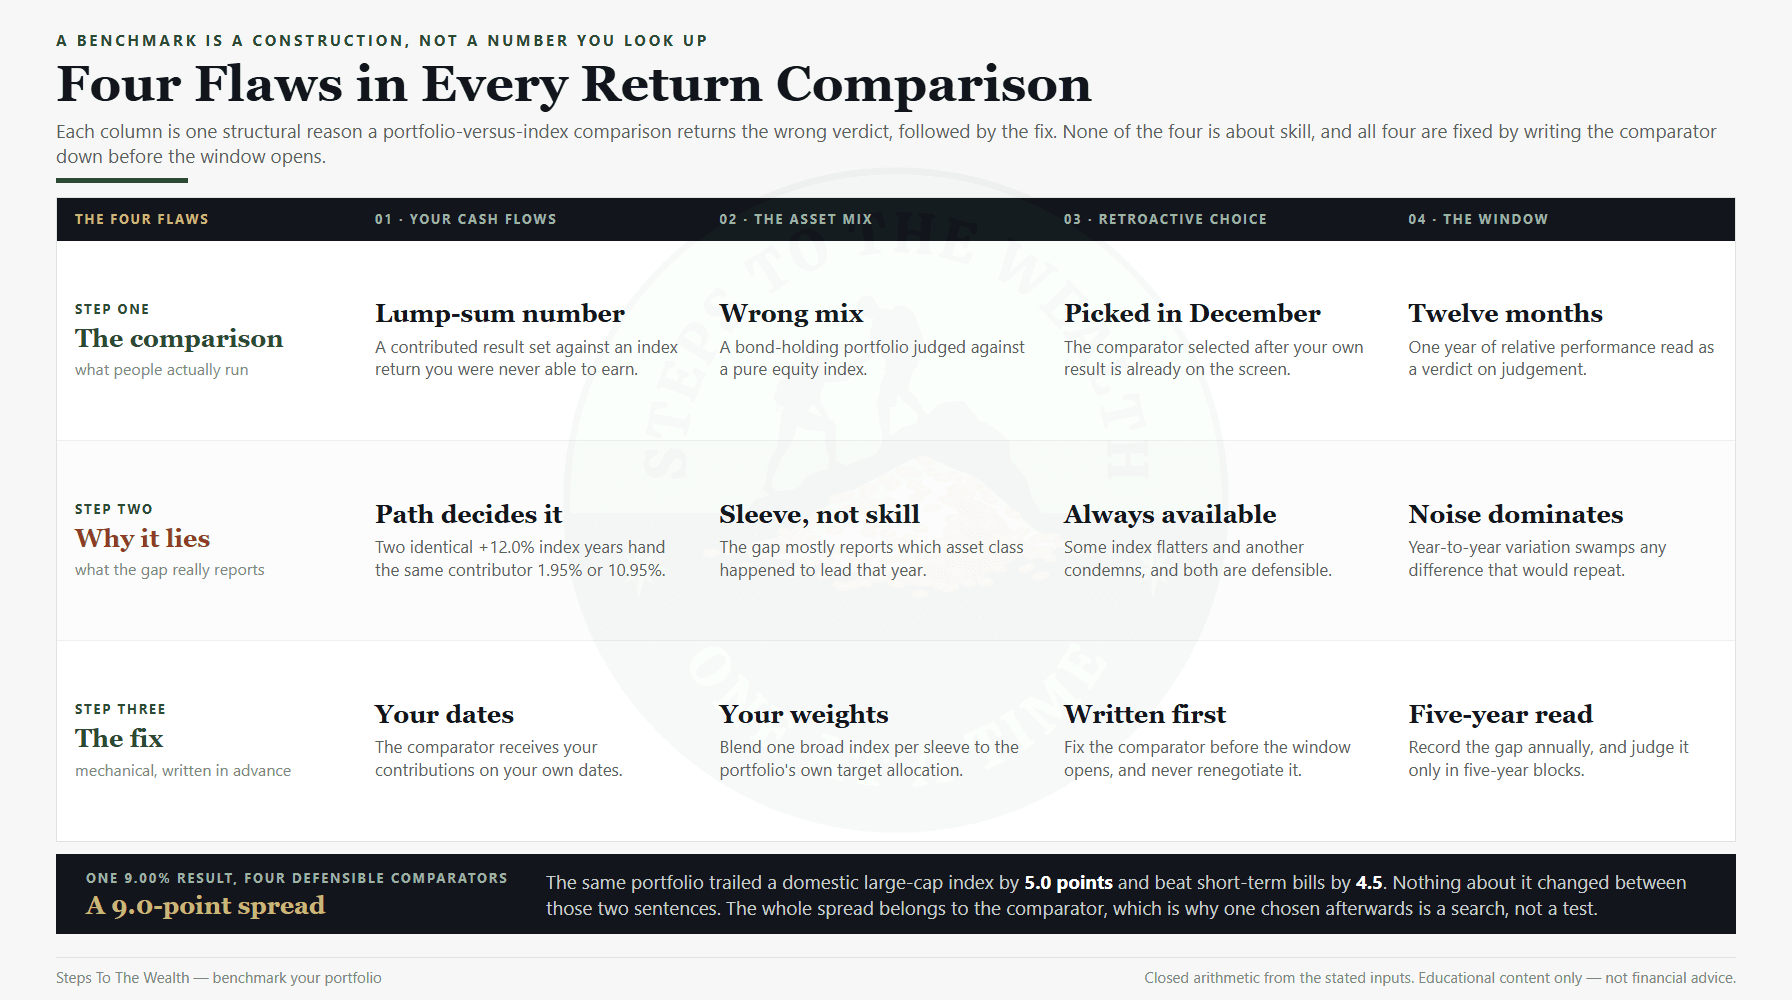
Your statement says the portfolio returned 9% last year. Somebody asks whether that is good. The honest answer is that the number, on its own, does not contain enough information to answer the question — and neither does the index return you are about to compare it to.
This is where most self-directed investors quietly go wrong. They produce a personal return, find a headline index number for the same twelve months, subtract one from the other, and treat the difference as a verdict on their own judgement. The arithmetic is trivial. The comparison is invalid, and it is invalid for reasons that have nothing to do with skill.
To benchmark your portfolio honestly you have to build the comparator, not look it up. A benchmark is a control experiment: the same money, arriving on the same days, in the same kind of assets, judged over a window long enough for the answer to mean something. Change any one of those four and the verdict changes with it, which is exactly why an unbuilt benchmark can be made to say whatever you want.
What follows is the structure of the problem, in four flaws, each priced with closed arithmetic from assumptions stated on the page. The figures use round illustrative numbers chosen so the mechanism is visible; they are not a market forecast and not a record of any particular year.
What a benchmark is actually for
A benchmark answers one narrow question: would a simple, rules-free alternative have done the same thing with your money? That is all. It is not a scoreboard, not a grade, and not a measure of whether your plan is working.
Those are separate jobs, and the site treats them separately. Whether your process held up is what the annual investing review is for, and it deliberately grades the readings rather than the results. Whether your total is on track for anything is what the savings-by-age benchmarks speak to, and those compare you to other households, not your portfolio to an alternative. Neither of those is the question here.
The benchmark question is narrower and more useful: given the money you actually had, on the days you actually had it, was the effort worth anything? A well-built comparator answers that. A badly built one produces a number that feels like an answer and is not one.
Start from the number itself. Producing an honest personal return on a portfolio you keep adding to is its own piece of work, and it is worked through in XIRR vs CAGR. Everything below assumes you already have that number. The four flaws are about what you compare it to.
Flaw 1: the benchmark never received your cash flows
An index return is a lump-sum number. It describes what happened to money that was fully invested on the first day of the window and left alone. If you contributed monthly, you were never that investor, and the index number was never available to you.
Here is the part that makes it structural rather than nitpicking. Two different years can deliver the identical index return and hand a monthly contributor two completely different outcomes, because a contributor’s result depends on when inside the window the movement happened. The index does not care. Your contribution schedule cares enormously.
Take an index that starts the year at 100 and ends it at 112. That is a 12.0% year, and it is a 12.0% year in both scenarios below. In the first, the whole gain arrives in the opening quarter and the index sits flat for nine months. In the second, the index sits flat for nine months and the gain arrives at the end.
Investor A puts $12,000 in on day one. In both scenarios A ends with $13,440.00, up 12.00%, because A is the investor the index describes. Investor B contributes $1,000 on the first of each month for twelve months. Same total, same index, same year.
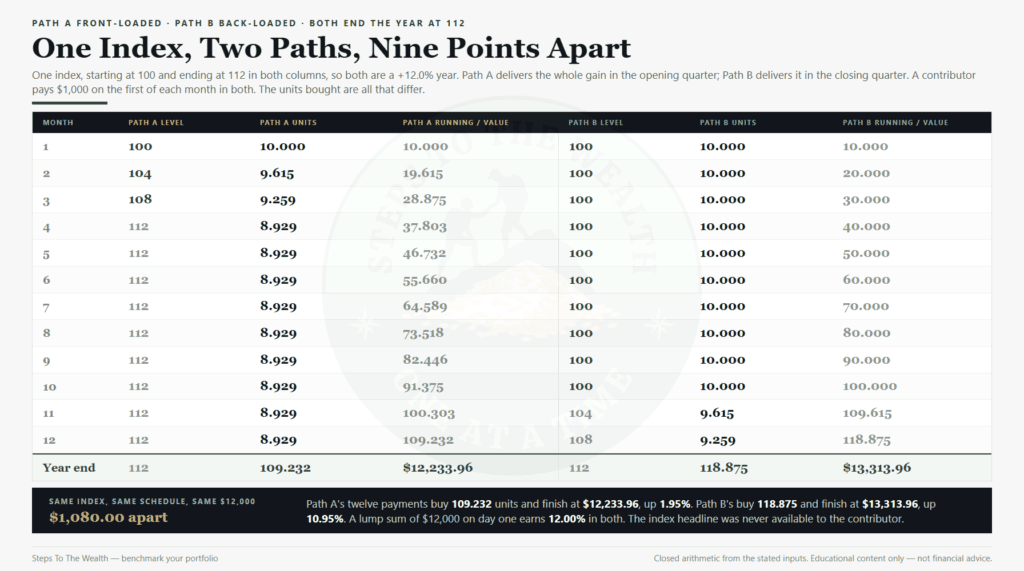
In the front-loaded year, B’s twelve payments buy 109.232 units and finish at $12,233.96, up 1.95%. In the back-loaded year the same twelve payments buy 118.875 units and finish at $13,313.96, up 10.95%. Same money, same schedule, same headline index return, and a gap of $1,080.00 between the two.
Now put that beside the usual comparison. In the front-loaded year, B looks like an investor who trailed a 12% index by ten points. B did nothing wrong. B could not have earned 12% without owning all the money on day one, which was not true. The comparison measured the shape of the year, not the investor.
The fix is mechanical: run the benchmark through your exact contribution dates. Buy the comparator on the days you bought, in the amounts you bought, and let it compound from there. What you get is a benchmark that had the same handicap you did, and the difference between the two is finally attributable to something you chose. This is the same cash-flow-shape problem that sits underneath lump sum vs DCA, seen from the measurement side rather than the deployment side.
Flaw 2: the comparator does not hold what you hold
The second flaw is simpler and more common. People compare a diversified portfolio to a concentrated index and read the gap as performance.
If your money sits in global equity, small caps, bonds and a cash buffer, then a domestic large-cap index is not your alternative. It is a different asset mix with a different risk profile, and the difference between you and it in any given year is mostly a statement about which sleeve happened to lead. In a strong year for domestic large caps you will trail it and conclude you are bad at this. In a bad one you will beat it and conclude you are good at this. Both conclusions are the same error with opposite signs.
This is not a small effect. The bond and cash portion of a portfolio does not merely dilute the equity return — it is there to do a different job, and it is doing that job in exactly the years it drags the comparison. Deciding what mix you want in the first place is a separate exercise; the regulator’s own plain-English guide to asset allocation is a reasonable place to see the tradeoff stated without a product attached.
A comparator that does not match your mix also quietly punishes the thing diversification is for. Diversification reduces risk by holding assets that do not all move together, which guarantees that something in the portfolio is always underperforming the leader. Benchmarking against the leader turns a working portfolio into a permanent disappointment.
The fix is a blended comparator built from your own weights. That construction is worked through in full further down.
Flaw 3: the comparator was chosen after you knew the answer
This is the flaw with the least arithmetic and the most consequences, because it is the one that operates on you rather than on the numbers.
If you pick the comparator in January, it is a test. If you pick it in December, after you already know your own result, it is a search. And a search always succeeds, because there is always some index that makes the year look like a win and some other index that makes it look like a failure.
Consider a portfolio that produced 9.00% for the year. Four comparators, all of them defensible, all of them things a reasonable person might reach for.
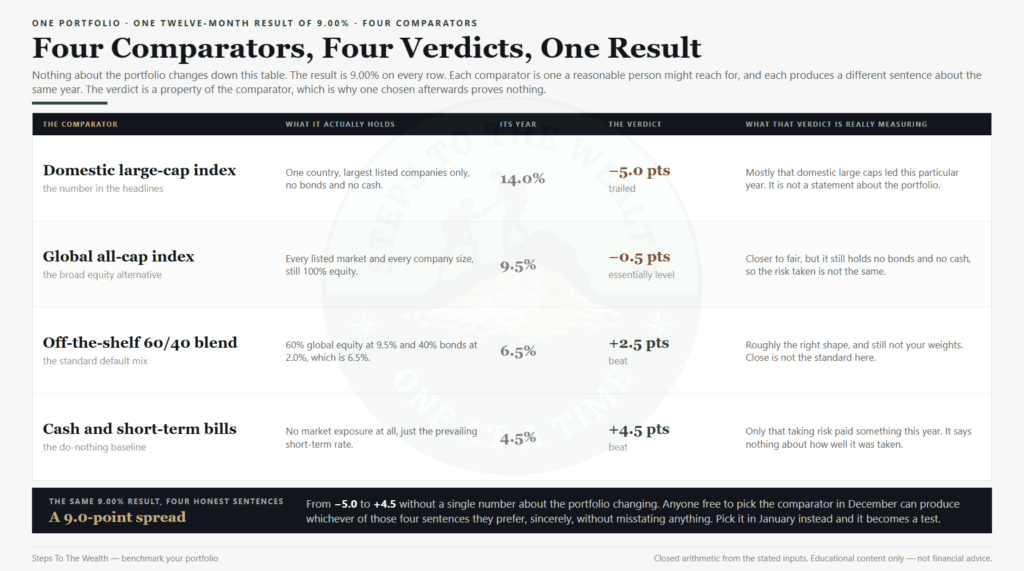
Against a domestic large-cap index at 14.0%, the portfolio trailed by 5.0 points. Against a global all-cap index at 9.5%, it essentially matched, trailing by 0.5. Against an off-the-shelf 60/40 blend, which works out at 6.5% from those same component returns, it beat by 2.5 points. Against short-term bills at 4.5%, it beat by 4.5 points.
Nothing about the portfolio changed across those four lines. The result was 9.00% in every one of them. The spread in the verdict is nine percentage points wide, and it is entirely a property of the comparator, not of the investor. Anyone free to choose the comparator afterwards can produce whichever of those four sentences they prefer, sincerely, without lying about a single number.
Which is worth remembering when you read someone else’s performance claim. The people selling results have the same freedom you do, and they exercise it. The related trap of quietly swapping strategies once the comparison stops flattering you is the subject of rebalancing vs chasing.
The fix costs nothing and takes a minute. Write the comparator down before the year starts, with its weights, and do not change it because the year went a particular way. A benchmark you are allowed to revise is not a benchmark. It is a mood.
Flaw 4: one year is noise, and you already know it
The fourth flaw is about the window. A single year of relative performance carries almost no information about whether an approach works, and everybody accepts this in the abstract and ignores it in practice.
The reason is straightforward. The year-to-year variation in the gap between any two reasonable portfolios is large compared with any difference in their long-run behaviour. In a single year the gap is dominated by which sleeve happened to lead, which is not repeatable and not a decision you made. Over long windows those swings partially cancel, and whatever structural difference exists starts to show.
This is precisely why the long-running scorecards on professional managers are quoted over ten- and fifteen-year windows rather than annual ones, a point that comes up in dollar cost averaging myths. A single strong year is not evidence of anything about a manager, and it is not evidence of anything about you either.
The practical consequence is a rule about what you are permitted to do with the answer. A one-year comparison is a data point to file. It is not grounds to change an allocation, abandon a framework, or conclude anything about your judgement. If a one-year gap can move your plan, then your plan was never a plan — it was a position you were holding until something upset you, which is the mechanism behind several of the small investing mistakes that compound quietly.
Record the number annually. Read it in five-year blocks. Act on neither in isolation.
How to benchmark your portfolio in four fields
All four flaws are fixed by the same artifact: a comparator specified in writing before the window opens. It has four fields, and it fits on one line of a notes file.
Field one, the weights. Take your target allocation, not last week’s balances. If the plan says 50% global equity, 10% domestic small cap, 30% investment-grade bonds and 10% cash, the comparator holds those weights.
Field two, the component proxies. One broad, cheap, public index per sleeve. Broad rather than clever — the comparator is supposed to represent the easy alternative, so anything requiring a selection decision defeats the purpose.
Field three, the cash-flow rule. The comparator receives your contributions on your dates. If you add $1,000 on the first of the month, so does it.
Field four, the window. Measured annually, judged over five years. Written down so that the December version of you cannot renegotiate it.
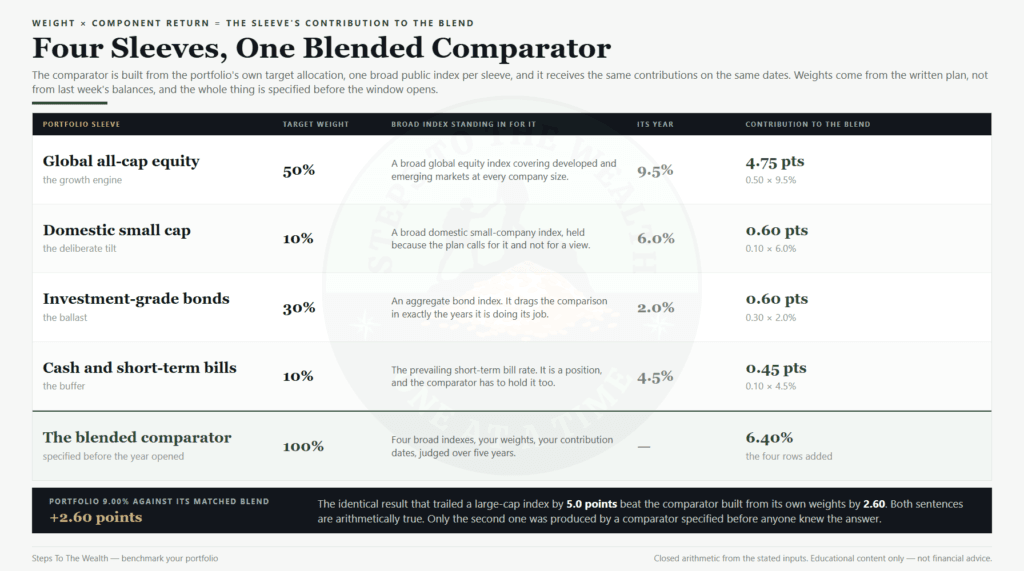
With those weights and the component returns used above, the blend arrives by simple multiplication. Global equity contributes 50% of 9.5%, which is 4.75 points. Small cap contributes 10% of 6.0%, or 0.60. Bonds contribute 30% of 2.0%, another 0.60. Cash contributes 10% of 4.5%, or 0.45. The four add to 6.40%.
Against that comparator, a 9.00% result beat its own matched alternative by 2.60 points. That is a very different sentence from “trailed the market by five points”, and it is the only one of the five sentences in this article that was produced by a comparator built before the answer was known.
Note what happens to the 60/40 line from the previous section under this treatment. At 6.5% it was not a bad approximation of the matched blend at 6.40% — off-the-shelf blends are usually in the right area. But “usually in the right area” is not the standard when the whole point of the exercise is to isolate the effect of your own decisions.
One more refinement, once the basic comparison is honest. Two portfolios that produced the same return did not necessarily earn it the same way, and the one that got there with less violence is the better piece of engineering. Comparing the volatility taken to reach a return is a different measurement, and its limits are covered in the Sharpe ratio explained.
What a benchmark cannot tell you
Three honest limits, because a well-built comparator can still be over-applied.
It cannot tell you whether you are on track. Beating a matched comparator by 2.60 points while contributing far too little is a good relative result attached to a failing plan. The comparator says nothing about the size of the pot, the horizon, or the goal, and a portfolio can beat its benchmark all the way to an underfunded retirement.
It cannot separate skill from luck in any window you will personally live through. Even five years is short. The comparison tells you what happened; attributing it to judgement requires far more data than a private investor will ever accumulate, and the honest posture is to treat a persistent gap as a hypothesis rather than a finding.
It cannot price the decisions that never showed up in the return — the sale you did not make in a drawdown, the position you did not size at twice the level, the year you kept contributing when it felt stupid. Those are the decisions the framework exists to make automatic, and they are worth more than a couple of points of relative return. They just do not appear anywhere in this arithmetic.
Frequently asked questions
What does it mean to benchmark your portfolio?
It means comparing your actual result to what a simple, rules-free alternative would have done with the same money, arriving on the same dates, in the same kind of assets. The comparator has to be constructed to match those conditions. Looking up a headline index return and subtracting is not benchmarking, because that number describes an investor who was fully invested on day one.
Which index should I use as my benchmark?
Not a single index, unless your portfolio genuinely holds a single asset class. Use a blend whose weights match your target allocation, with one broad public index standing in for each sleeve. A 50/10/30/10 portfolio needs a 50/10/30/10 comparator, or the gap you measure is mostly a statement about asset mix.
Why does my return look so much worse than the index?
Usually one of two structural reasons rather than anything you did. Either you were contributing through the window while the index number assumes a lump sum on day one, or your portfolio holds bonds and cash while the index does not. Both effects can easily exceed ten percentage points in a single year without any decision of yours being involved.
How often should I benchmark my portfolio?
Measure it once a year, at the same point each year, and read it in five-year blocks. Measuring more often produces noise you will be tempted to act on. Acting on a single year’s gap is the most common way a workable long-horizon plan gets abandoned at exactly the wrong moment.
Is beating the benchmark the goal?
No. The goal is funding whatever the money is for. The benchmark answers a narrower question — whether the effort of running a portfolio produced anything the easy alternative would not have — and a plan can clear that bar comfortably while still failing on contribution rate or horizon.
Does the benchmark need to include fees?
Yes, if you want the comparison to be honest. The easy alternative is not free either, so the comparator should carry a realistic cost for its own funds. Your side of the comparison should carry every cost you actually paid, including the ones that never appear on a statement as a line item.
Can I change my benchmark?
Only when the portfolio’s target allocation genuinely changes, and only prospectively, with the date recorded. Changing the comparator because the current one is producing an unflattering answer is the single easiest way to make years of measurement worthless.
The comparison worth running
The reason to build this properly is not that a number is satisfying. It is that an unbuilt benchmark is the most reliable source of bad portfolio decisions available to a private investor. It produces false failure in years when a concentrated index leads, false confidence in years when it does not, and a steady low-grade pressure to abandon a working allocation for whatever led last.
Four fields fix all of it. Your weights. Broad proxies. Your contribution dates. A five-year window, written down in advance. Ten minutes once, and then the comparison actually means what you thought it meant when you started running it.
And when the honest comparator says you trailed by a point, that is genuinely fine. A point of relative return over one year is inside the noise, and the plan was never built on winning it.
If you would rather have the weekly risk readings arriving on a schedule than reconstruct all of this from memory once a year, the Steps To The Wealth Weekly sends the readings and the action steps every Sunday.
Educational content only — not financial advice. Every figure above is an illustration closed from the assumptions stated beside it, using round numbers chosen to make the mechanism visible. They are not a record of any particular market period, not a forecast, and not a recommendation to buy or sell anything.