
Every month you have a little money left over, you make this decision whether you notice it or not. Send it to the balance, or send it to the market. Most of the advice you will find answers it with a temperament: the cautious answer is debt, the ambitious answer is investing, and you are invited to pick the one that sounds like you.
It is not a temperament question. Whether to pay off debt or invest is a hurdle-rate question, and a hurdle rate is arithmetic. A dollar sent to a balance earns exactly the rate that balance is charged. A dollar sent to the market earns whatever the market happens to do. One of those numbers is certain and one is a distribution, and the whole decision is a comparison between them, plus a gate that comes before both.
What follows is the comparison done properly, with the units matched, the arithmetic closed, and the parts that cannot be answered from arithmetic named as such.
Pay off debt or invest: the question is a hurdle, not a preference
Here is the structure of the decision, in the order it actually resolves.
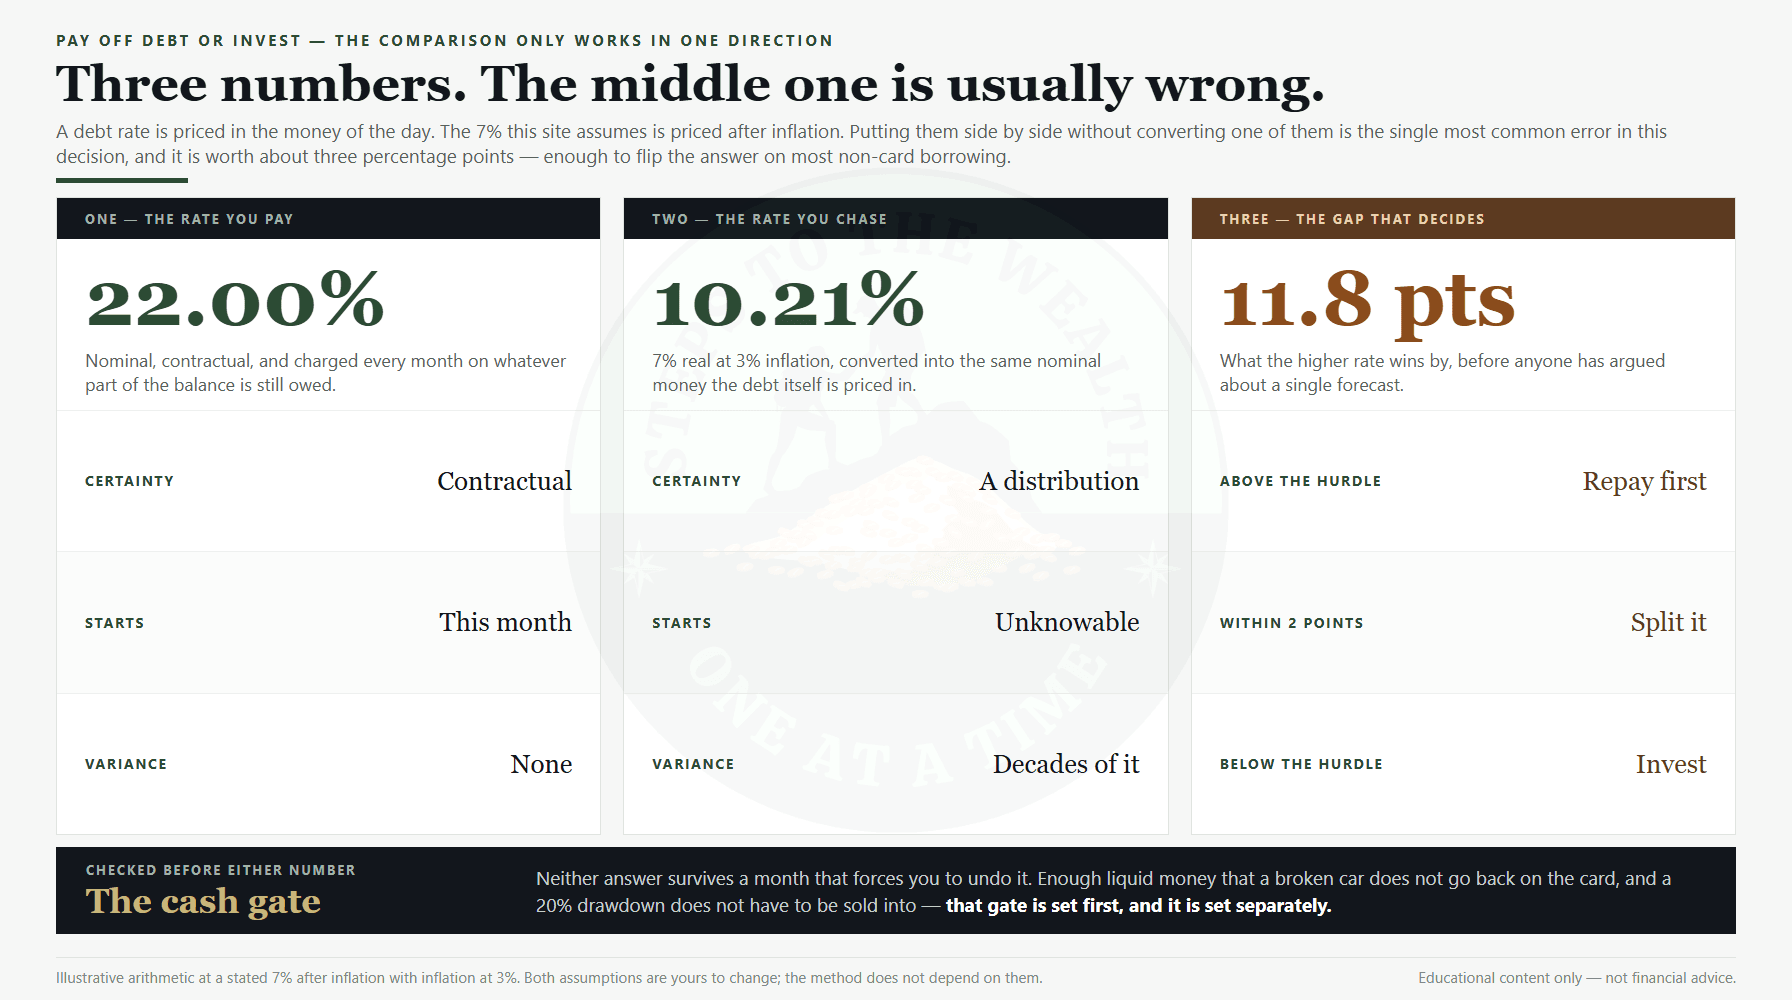
For the market to be the better home for a spare dollar, the return you get from the market has to beat the return you get from repaying. For that comparison to mean anything, both numbers have to be expressed in the same money. And for either number to matter at all, you have to be in a position where a bad month does not force you to undo the decision. So the question is not really “debt or market”. It is three numbers, checked in order.
The first is the rate on the debt. That is printed on your statement and it is not negotiable by argument.
The second is the return you are giving up by not investing. This is where almost every version of this discussion goes wrong, and the error is not a small one.
The third is the cash you hold. Not because cash earns anything, but because without it the other two numbers describe a decision you cannot actually keep.
Get those three in the right units and the answer usually falls out without any judgement at all. Where it does not fall out, the honest response is to say the band is too narrow to call, and to act accordingly.
The first number: what repaying a debt actually returns
A debt is an investment you already own, held short. If you carry a balance at 22%, the balance grows at 22% a year, charged monthly on whatever is outstanding. Every dollar you hand it stops that growth on that dollar permanently.
That makes repayment a return, and an unusually clean one. It is certain — the rate is contractual, not expected. It is immediate — there is no holding period before it starts. It has no variance — there is no version of the next decade in which paying down a 22% balance returns 4% instead. And it is uncorrelated with everything, which is a property no asset in your portfolio can offer.
Investors who would never describe themselves as risk-tolerant routinely leave a guaranteed double-digit return on the table because it does not feel like investing. It feels like admin. That is mental accounting doing its usual work: the same dollar is treated differently depending on which column it sits in, when the arithmetic does not care about columns at all.
One clarification, because it matters for the comparison in a moment. The rate on a debt is a nominal rate. It is charged in the money of the day, on a balance stated in the money of the day. That is not a detail. It is the reason so many of these comparisons are run against the wrong benchmark.
The second number: the hurdle, stated in the same money
The standing assumption across this site is 7% after inflation, with inflation at 3%. That is a real return — purchasing power, stated in today’s money, with the erosion already removed. It is the right number for almost every long-horizon question, and the reasoning behind it is set out in full in the difference between real and nominal returns.
It is the wrong number to put next to an interest rate.
Compare a 22% nominal APR against a 7% real return and you are comparing a rate that includes inflation against a rate that has had inflation stripped out of it. The two sides are priced in different money. To make them comparable you convert the return to nominal, and you do it by multiplying rather than adding: 1.07 × 1.03 = 1.1021. The hurdle is 10.21% nominal, not 7%, and not the 10% you would get by adding the two figures together.
Three and a bit percentage points does not sound like much until you notice where it sits. It sits directly on top of the range where most non-card debt lives. Personal loans, vehicle finance, the middle band of student borrowing, the tail end of a mortgage — a great many of these price between 6% and 10%. Under the naive test they all look like debts worth clearing. Under the like-for-like test, most of them are below the hurdle and should be paid on schedule while the spare dollar goes to the market.
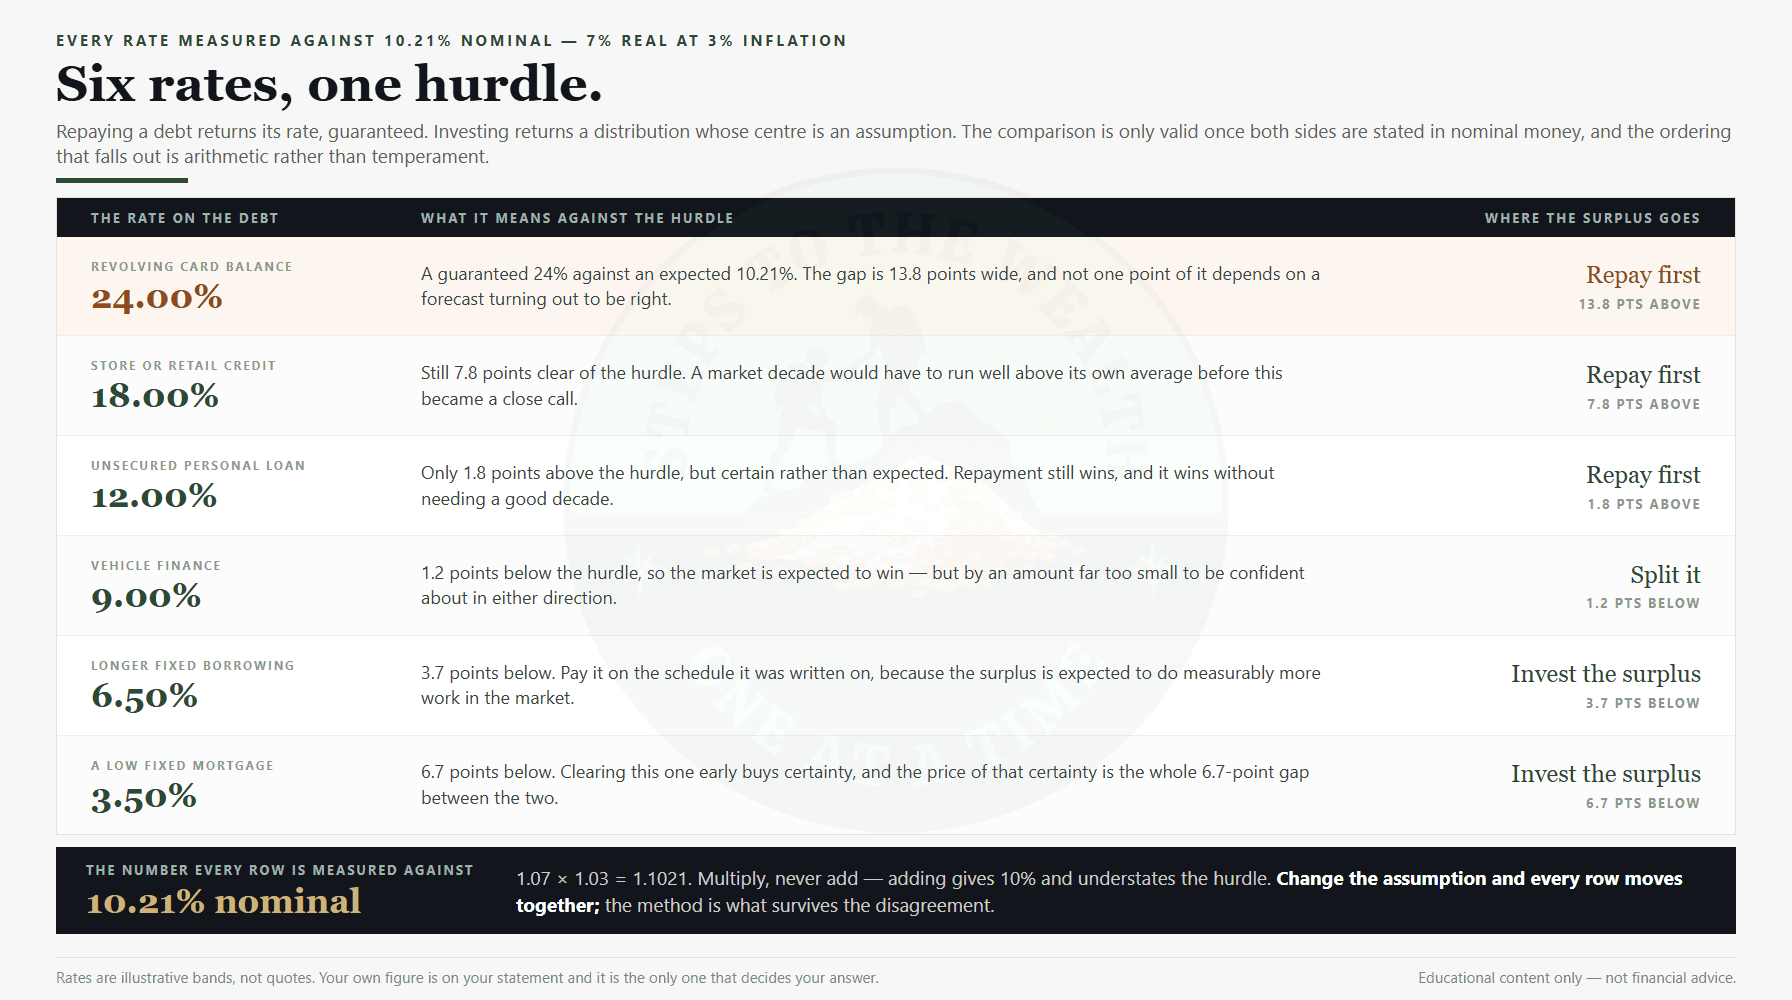
Note what the ladder does not do. It does not tell you the market will return 10.21%. It tells you that if you hold the site’s standing assumption, that is the number the debt has to beat, and a debt above it wins on arithmetic before anyone argues about forecasts. If you hold a different assumption, change the number and the ladder shifts — the method survives the disagreement.
And the two sides are not equally solid. The left column is contractual. The right column is an average of a distribution that has produced decades of nothing and decades of plenty, which is the entire subject of sequence-of-returns risk. A tie on paper is not a tie in practice.
The third number: the cash that comes before either answer
There is a version of this decision where the arithmetic is done perfectly and the outcome is still bad, and it is the most common one.
You run the numbers, the card rate wins, and you send every spare dollar to the balance for eight months. In month nine something breaks — the car, the boiler, a gap between contracts. There is no cash. So the balance goes back up, at the same rate you just spent eight months fighting, and you have converted your progress into a round trip plus interest.
The same failure runs the other way. Spare dollars go to the market, the market is down 20% when the bill lands, and you sell to cover it. That is not an investment decision with a poor outcome. That is forced selling, and it is what turns a paper drawdown into a permanent one.
Cash is what prevents both. Not because it earns anything — it does not, and after inflation it loses — but because it is the only thing that lets a plan survive the month that tests it. How large that buffer should be is its own question, and the honest answer is that it scales with how variable your income is and how much volatility you are carrying, not with a number somebody rounded off. It is settled separately, and it is settled first.
One exception is worth stating plainly, because it is where a rule mechanically applied does harm. If a debt is compounding faster than you can fill a buffer, filling the buffer first is not caution, it is a slower loss. In that case the buffer target drops to something small and functional, the debt gets attacked, and the buffer gets rebuilt afterwards. That is a judgement, and it is one of the few places in this framework where a judgement is unavoidable.
What the minimum payment does while you decide
There is a third path that nobody chooses on purpose and a great many people are on: pay the minimum, invest a little, and let the balance take care of itself. It deserves its own arithmetic, because it does something most people have never seen written down.
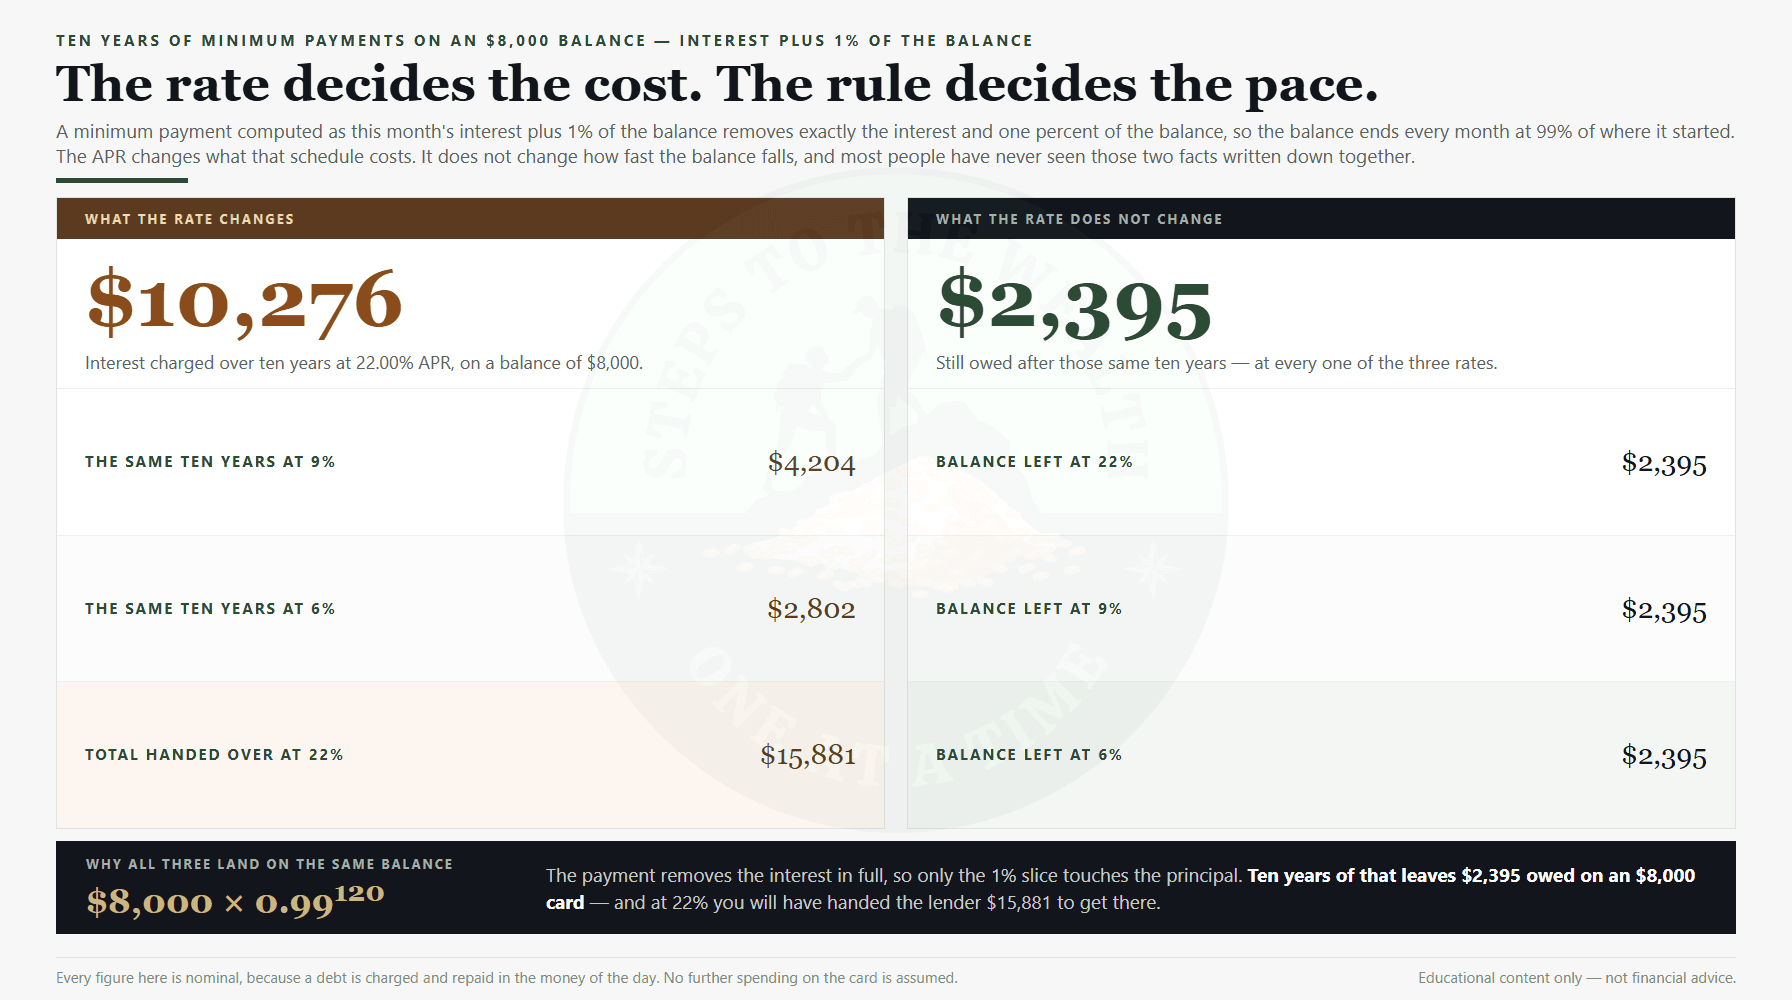
The common minimum-payment rule is this month’s interest plus roughly 1% of the balance. Work through what that does. Interest is added, then the payment removes exactly that interest plus 1% of the balance, so the balance ends the month at 99% of where it started. Every month. That is the entire schedule.
The consequence is strange and worth sitting with. The interest rate does not change how fast a minimum-payment balance falls. It changes how much you pay to get the same fall. On an $8,000 balance, after ten years of minimum payments you owe $2,395 — at 22%, at 9%, and at 6% alike. What changes is the cost: $10,276 in interest at 22%, $4,204 at 9%, and $2,802 at 6%. At 22% you will have handed the lender $15,881 across those ten years, on a balance of $8,000, and still owe $2,395 of it.
The rule is doing exactly what it was designed to do. A payment that shrinks as the balance shrinks keeps the relationship alive rather than ending it, and it is why the older flat-percentage rule can leave a balance that never clears at all — if the percentage is at or below the monthly interest rate and the dollar floor does not cover the interest either, the balance stalls or grows forever. That is not an error state. It is an outcome.
You do not have to take the arithmetic on trust. The minimum payment calculator runs this schedule month by month on your own figures. Put in the balance and the APR from your statement, choose which of the two minimum-payment rules your agreement actually uses, and it returns the payoff time, the interest total, and how much of what you hand over is interest rather than the thing you bought.
It also races that schedule against one fixed payment you name, which is the comparison that matters here: a fixed payment does not shrink, so every month more of it lands on the balance instead of the interest. That comparison is free and it is not clamped. The full walkthrough of what the tool is showing you lives in the article on what the minimum payment hides.
Ten years, one budget, four debts
Framework arguments are easy to agree with and easy to ignore. So here is the same decision run as arithmetic, with every assumption stated and both paths spending the identical amount of money.
The setup: an $8,000 balance, $500 a month of total capacity, ten years, and nothing further added to the card. The minimum is interest plus 1% of the balance with a $25 floor. The market compounds at 10.21% nominal, which is the site’s 7% real at 3% inflation. Contributions are fixed nominal amounts, which is why the nominal rate is the correct one to compound them at — using a real rate on nominal contributions overstates the result badly.
Path A sends the whole $500 to the balance until it is gone, then sends the whole $500 to the market for whatever months remain. Path B pays only the minimum and invests the difference from day one. Both spend $60,000 over 120 months. The score is what you own at the end, minus what you still owe.
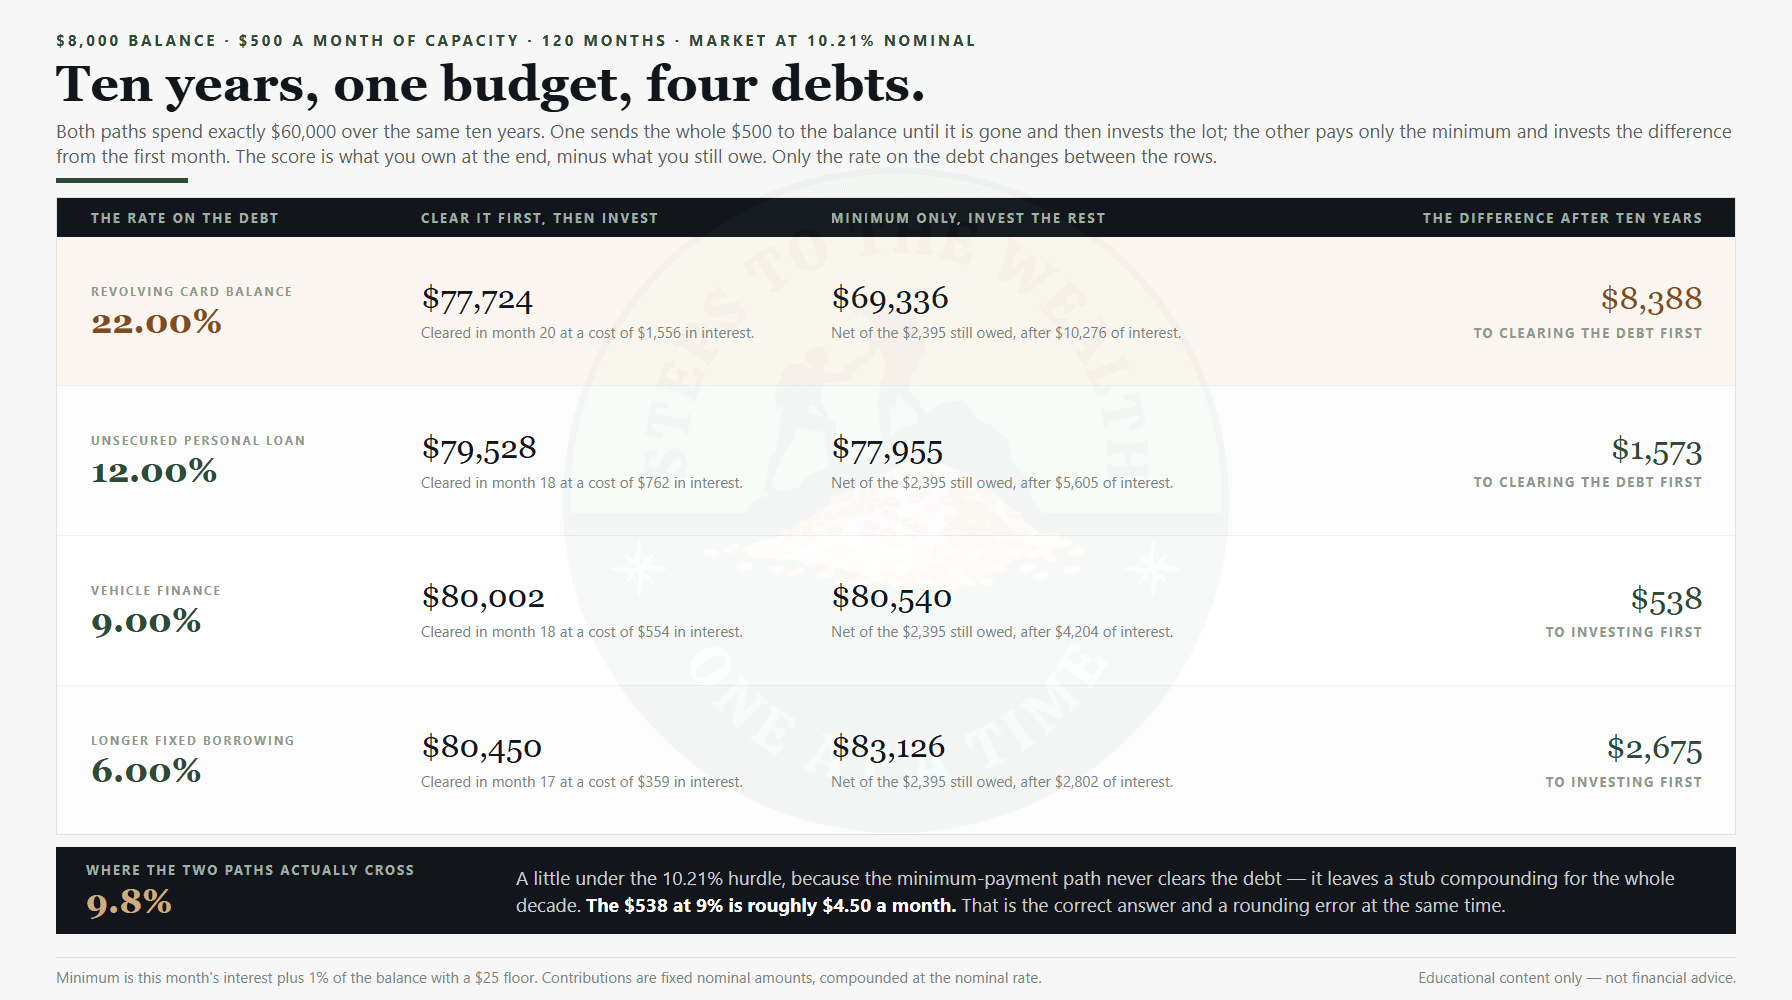
At 22%, Path A finishes with $77,724 and Path B with $69,336 net of the $2,395 still owed. Clearing first wins by $8,388. It is not close, and it should not be: a guaranteed 22% against an expected 10.21% is not a contest.
At 12%, still above the hurdle, Path A finishes at $79,528 and Path B at $77,955. Clearing first wins by $1,573 — a smaller edge than the card, and exactly what a 1.8-point advantage over ten years should look like.
At 9%, the order reverses. Path A finishes at $80,002 and Path B at $80,540. Investing first wins — by $538 over ten years, which is roughly $4.50 a month. That is the correct answer and it is also a rounding error. Anyone who tells you confidently which side of that line to be on is describing a preference, not a calculation.
At 6%, investing first wins by $2,675, and the gap is wide enough to act on.
Notice what the three rows have in common. Nothing about willpower, temperament, or how much you hate debt. One variable moved, and it moved the answer. That is the argument for deciding this from a rule rather than from how you feel about the balance on a given Sunday.
Where the crossover actually sits
The hurdle says 10.21%. The ten-year test flipped somewhere between 9% and 22%. Run it properly and the crossover in this exact setup sits at 9.8%, a little below the hurdle rather than exactly on it.
That gap is not an error, and it is worth explaining rather than smoothing over. Path B does not clear the debt. It leaves a $2,395 stub compounding at the debt’s rate for the entire ten years, and that stub drags the investing path down slightly. The bigger the leftover balance and the higher the rate, the further below the hurdle the true crossover sits. Change the horizon, the balance, or the minimum-payment rule and the crossover moves again.
Which is the honest conclusion here: the crossover is not a constant, and anyone quoting one as though it were is quoting the output of assumptions they have not shown you. What is stable is the method. Price both sides in nominal money, compare, and treat the band around the crossover as genuinely undecided rather than as a place to be confident.
For debts sitting in that band — call it a couple of points either side — splitting the spare capacity is not indecision. It is the correct response to a calculation whose inputs you do not know precisely enough to act on. You cannot know your realised return in advance. You can know that a 50/50 split is never badly wrong when the two options are within a rounding error of each other.
The order of operations
Put together, the sequence is short enough to hold in your head.
First, the cash gate. Enough liquid money that a normal bad month does not put anything on a card or force a sale. If a debt is compounding faster than you can build that, take the buffer down to something minimal, deal with the debt, then rebuild.
Second, anything priced above the hurdle. Above roughly 10% nominal, repayment is a guaranteed return larger than the uncertain one, and the argument is over. Highest rate first, because that is where the guaranteed return is largest.
Third, the band around the crossover. Roughly 8% to 12%. Split it. Not because splitting is optimal — it is optimal only by accident — but because the inputs are not precise enough to justify a corner solution.
Fourth, anything below the band. Pay it on schedule and invest the surplus. A low-rate debt on a fixed schedule is not an emergency, and treating it as one costs you the gap between its rate and the hurdle, compounded for as long as you spend clearing it early.
Two things stay true at every step. The minimum on every debt gets paid, always — the ordering is about where surplus goes, never about skipping an obligation. And the contribution keeps going in either way. What changes is where it lands, not whether it happens, which is the same discipline that makes a plan and a goal line up in the first place.
What this framework refuses to tell you
Four things, named rather than hidden in a footnote.
It ignores tax entirely. Whether interest is deductible, and how investment returns are treated, are jurisdiction-specific and they can move the hurdle in either direction by a meaningful amount. This site does not know where you live and will not guess. Take the method, apply your own rates, and the arithmetic still works — it just works on different inputs.
It ignores employer contributions. Where matched contributions exist, a match is an immediate return on the matched portion that no debt rate is likely to beat. That sits above everything in the ordering above, including the cash gate, up to the matched amount. The details are jurisdiction-specific; the shape is not.
It uses one return assumption for a range of outcomes. 10.21% nominal is the centre of a distribution, not a forecast. The distribution matters more than the centre when a decision is near the crossover, which is exactly why the band exists. Volatility is not the same thing as risk, but a decision that only works at the average return is fragile in a way a guaranteed repayment is not.
It cannot see variable rates. A rate that can reprice is not a fixed hurdle, and a debt currently just below the band can be above it by next year. Re-check anything variable when it moves, not on a schedule.
What the framework does do is remove the part of the decision that was never yours to argue about. Two numbers in the same units, one gate in front of them, and a stated band where the answer is genuinely unclear.
Frequently asked questions
Should I pay off debt or invest first?
Compare the debt’s rate to a like-for-like nominal return assumption. Above roughly 10% nominal, repayment returns more than the market is expected to and it returns it with certainty, so clear it first. Below roughly 8%, pay on schedule and invest the surplus. Between the two, split. Before any of that, hold enough cash that a bad month does not undo the decision.
Why compare against 10.21% and not 7%?
Because 7% is a real return and a debt rate is a nominal one. Comparing them directly compares two different currencies. Converting the real assumption to nominal at 3% inflation gives 1.07 × 1.03 = 1.1021. Adding the two figures instead of multiplying them gives 10%, which is close enough to be tempting and wrong enough to matter over a decade.
Does paying the minimum ever clear a balance?
Under the interest-plus-1% rule, yes — eventually, because the balance falls by 1% every month regardless of the rate. Under the older flat-percentage rule it may not clear at all: if the percentage is at or below the monthly interest rate and the dollar floor does not cover the interest either, the balance stalls or grows indefinitely. Which rule applies to you is written in your credit agreement, and it changes the answer substantially.
What if I have several debts at different rates?
The ordering is by rate, highest first, because that is where each repaid dollar earns the most. Every debt still receives its minimum every month; only the surplus is ordered. Debts below the band do not get accelerated at all — they get paid on schedule while the surplus goes to the market.
Is a mortgage treated the same way?
Structurally, yes: it is a rate to compare against the hurdle like any other. Practically, the differences are that it is usually the lowest rate you hold, that repaying it is difficult to reverse if you need the money back, and that the interaction with local tax rules is larger than for unsecured debt. The comparison between property and equities covers the asset side of that question separately.
Does this change if my income is unstable?
The gate gets larger and the band gets treated more conservatively. Unstable income raises the probability of the scenario where you are forced to undo the decision, and a guaranteed repayment cannot be forced-sold at the wrong moment. That is a real advantage of repayment that does not show up anywhere in the rate comparison.
Where this goes next
The reason to settle this once, in arithmetic, is that it stops being a monthly negotiation with yourself. The rate is on the statement. The hurdle is a stated assumption you can change. The gate is a number you set in advance. After that, the spare dollar has a destination and you are not deciding anything each month — which is the whole point of running money from a system rather than from a mood.
The same logic runs the rest of the way up. Once the surplus is going to the market, the next question is when it goes in and at what size, and that is a risk question rather than an arithmetic one. If you want the weekly version — a risk reading on five major assets and what it implies for a systematic contribution — the Steps To The Wealth Weekly is free, sent on Sundays, and comes with the Dynamic DCA Blueprint.
For the broader groundwork on how a portfolio gets built once the debt question is closed, the regulator’s primer on asset allocation is a reasonable place to start, and the stages of wealth building covers what changes as the numbers get larger.
Educational content only — not financial advice. All figures are illustrative arithmetic at a stated 7% after inflation with inflation at 3%, restated as 10.21% nominal, and both assumptions are yours to change. Interest rates, minimum-payment rules and tax treatment vary by lender and by jurisdiction.