
Here is a question that sounds simple and is not: what return has your DCA plan actually made?
You have been putting $500 a month into an index fund for four years. The account is up. You would like one percentage that says “this plan returned X% a year.” So you do the obvious thing — divide the gain by what you put in, or look up the fund’s annualized return — and the number you get back is wrong. Not slightly wrong. Wrong in a way that can flatter a mediocre plan or condemn a good one.
The reason is that XIRR vs CAGR is not a matter of preference. They are two different measurements answering two different questions, and on a stream of contributions they can land tens of percentage points apart. Pick the wrong one and you are not measuring your plan at all. You are measuring something else and putting your name on it.
Educational content only. Not financial advice.
Why one number cannot describe a stream of contributions
If you make one investment and never touch it again, return is easy. Put in $10,000, end with $16,000 four years later, and there is exactly one compound annual growth rate that connects the two. Nothing else happened. There is nothing to weight.
Dollar-cost averaging breaks that cleanly. Your money did not arrive all at once. It arrived in 48 separate instalments, and every one of them has been invested for a different length of time. The dollars you contributed four years ago have had four years to compound. The dollars you contributed last month have had one. A single annual return has to reconcile all of those holding periods at once.
There are two honest ways to do that, and they are honest about different things. One measures the investment. The other measures you. Most of the confusion in personal finance about what someone actually earned comes from people reading the first number and believing it is the second.
This is not a rounding problem. In a case worked through in full below, two funds whose headline returns were 41 percentage points apart delivered the identical result to the same contribution schedule. Judged on the fund’s number, you would have drawn the opposite conclusion in each case, and been wrong both times.
CAGR measures the asset, not you
CAGR — compound annual growth rate — answers one question: how did the investment itself perform?
It is the smooth annual rate that takes a starting value to an ending value and ignores everything in between, including everything you did. If a fund stood at 100 four years ago and stands at 160 today, its CAGR is about 12.5% a year. That is true whether you bought once, bought monthly, bought nothing, or had never heard of the fund.
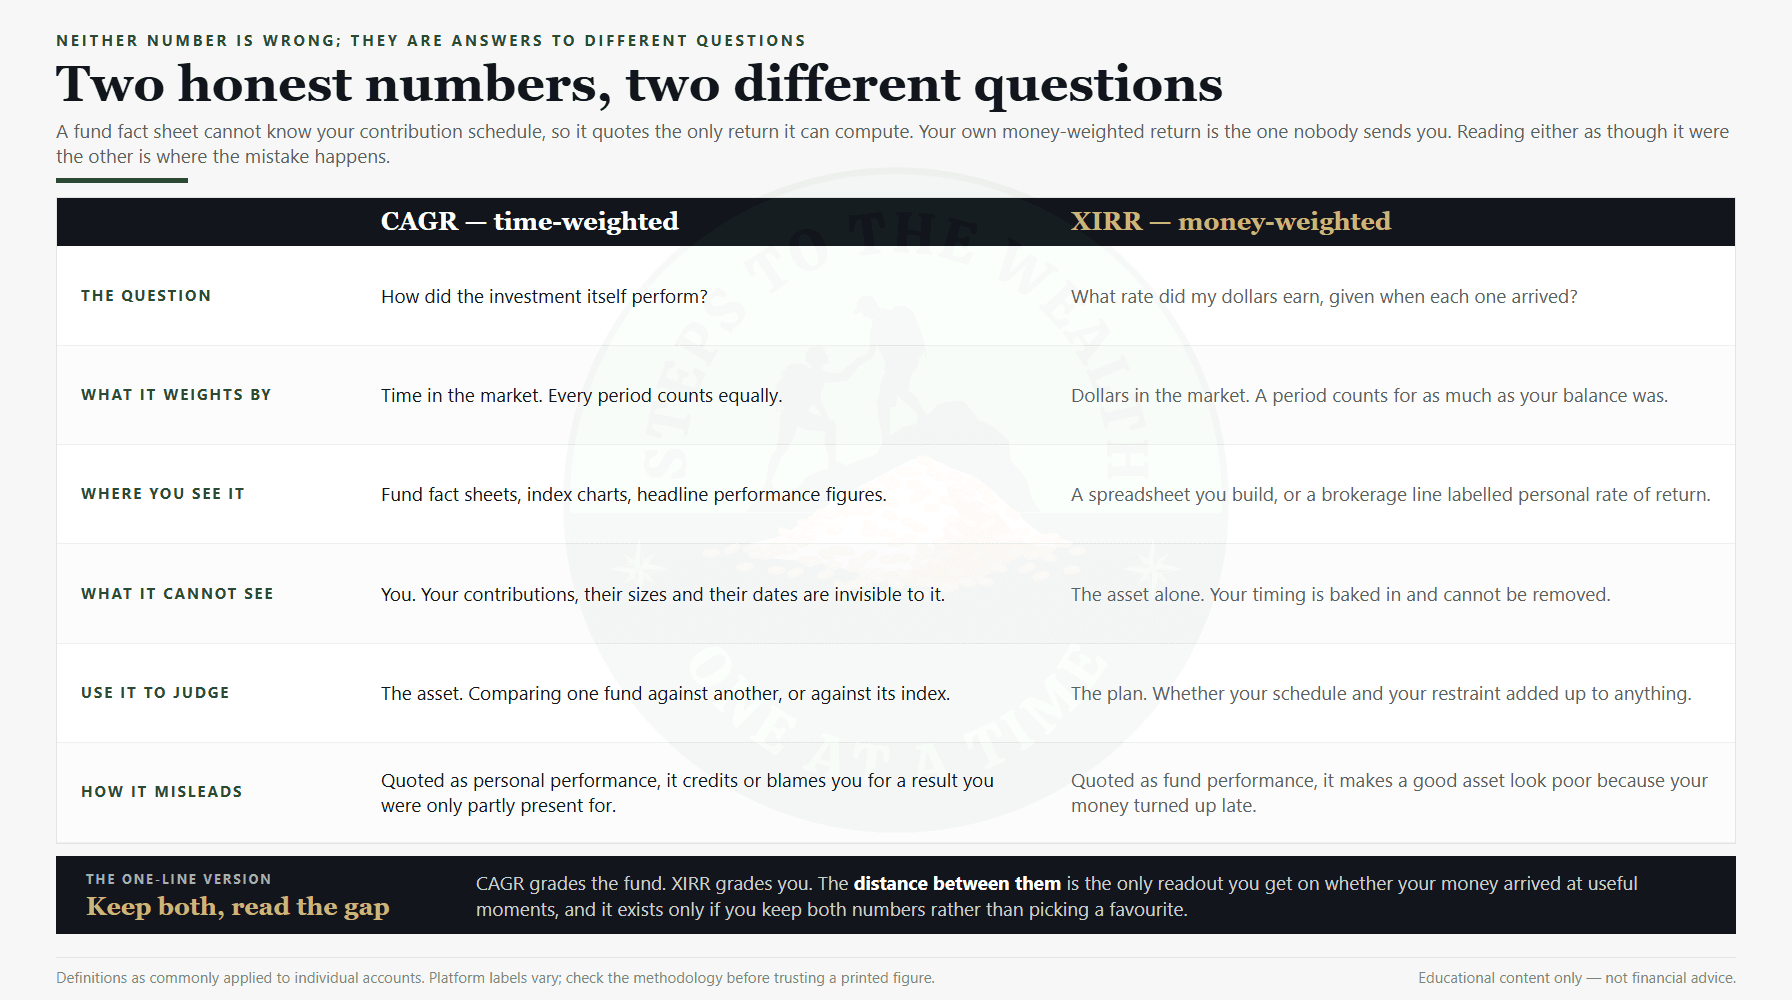
This makes CAGR the right tool for comparison. It is what fund fact sheets quote, and it has to be, because a fact sheet cannot know your contribution schedule. It is often called a time-weighted return: it weights by time in the market rather than by how many of your dollars were exposed at each point.
That last clause is the whole problem. CAGR has no idea when your money showed up, so it cannot tell you what your money earned. It describes the vehicle. You are asking about the journey.
Here is the failure in one sentence. Two people can hold the identical fund over the identical window, see the identical CAGR quoted at them, and have earned very different amounts relative to what they put in, purely because of when their contributions landed. CAGR is structurally blind to the one variable a DCA investor actually controls.
XIRR measures your dollars, not the asset
XIRR, and the money-weighted return it represents, answers the other question: what rate did my actual dollars earn, given exactly when each one went in?
It accounts for the size and the date of every contribution. A dollar invested at the start is credited with compounding the whole way. A dollar invested last month is credited with a month. XIRR finds the single annual rate at which all of your dated cash flows, compounded forward, reconcile to your current balance.
Mechanically it is a root-finding exercise rather than a formula you can rearrange on paper, which is why it lives in a spreadsheet function rather than in your head. The XIRR function in Google Sheets and the identically named function in Excel do the same job: hand them a list of dated cash flows and they solve for the rate.
This is the number that describes your plan. If the question is whether the habit has worked, and at what rate, XIRR answers it and CAGR does not. The distinction is usually written as time-weighted versus money-weighted, and the shorthand worth keeping is simpler than that. CAGR grades the fund. XIRR grades you.
XIRR vs CAGR: the same two years, two different verdicts
Abstractions do not settle this. Arithmetic does. Here are two funds and one investor, and the numbers are exact rather than illustrative.
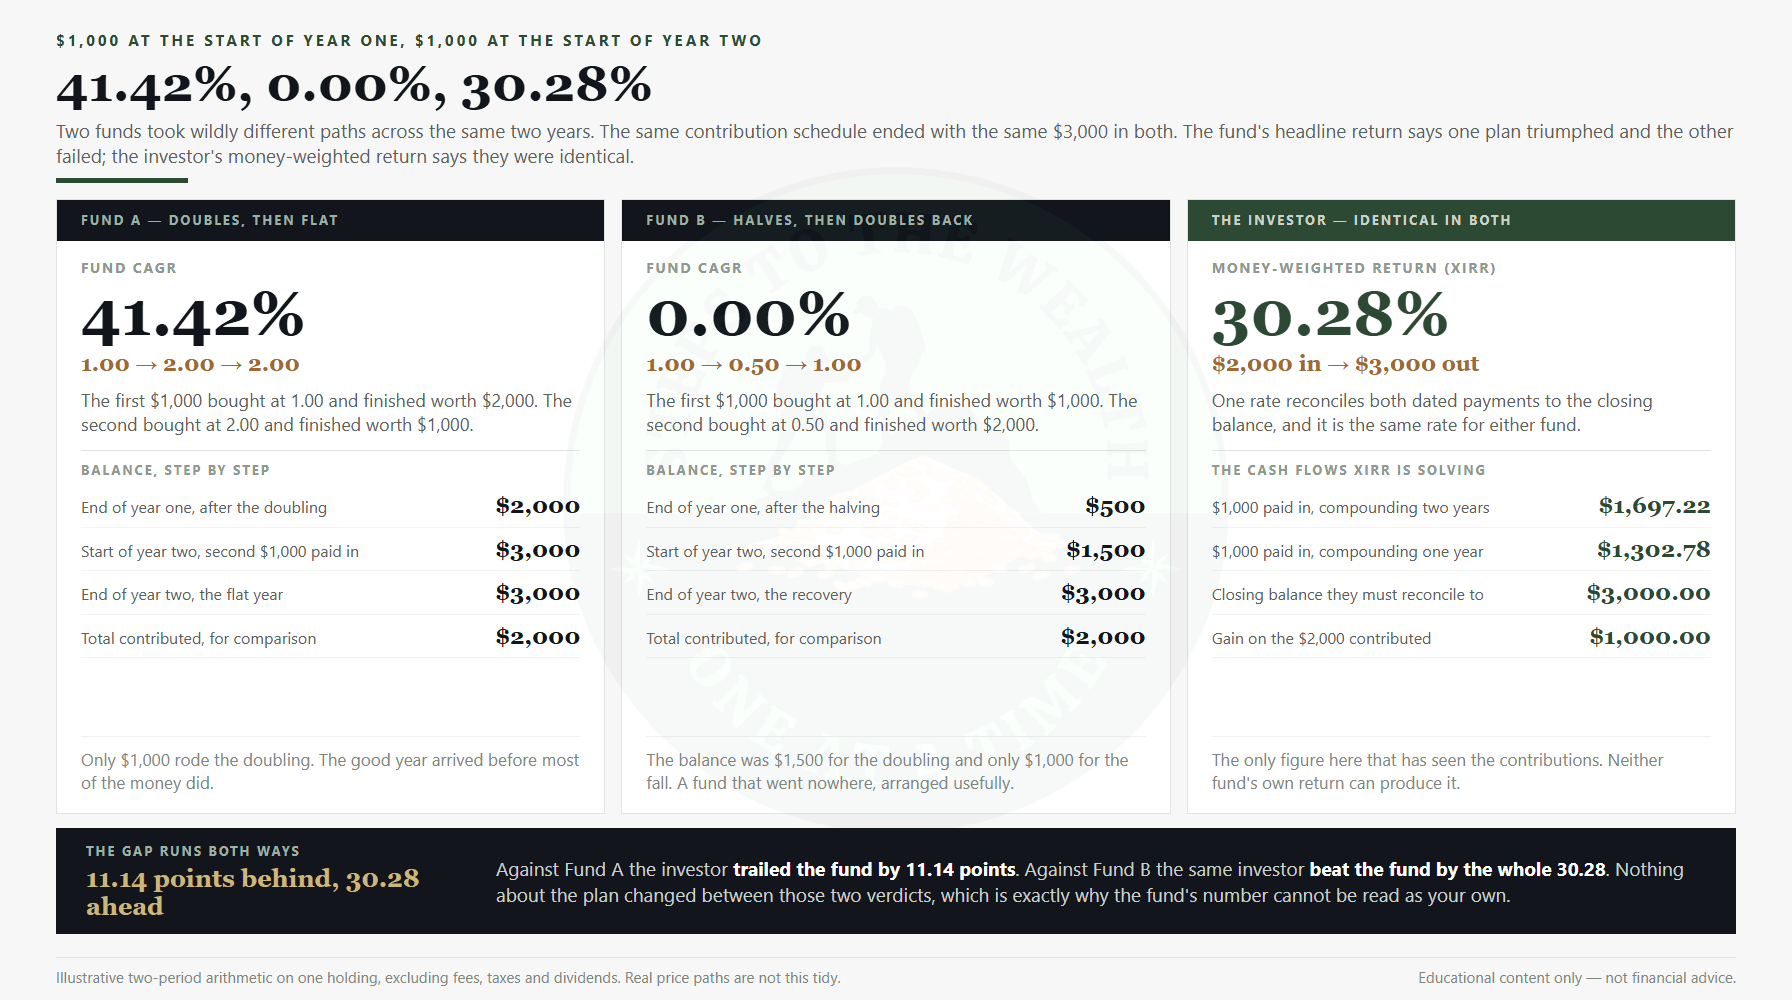
The investor contributes $1,000 at the start of year one and $1,000 at the start of year two. Total contributed: $2,000. Same schedule in both cases.
Fund A doubles in year one, then goes nowhere in year two. Its price path is 1.00, then 2.00, then 2.00. The first $1,000 buys at 1.00 and finishes at 2.00, so it is worth $2,000. The second $1,000 buys at 2.00 and finishes at 2.00, so it is still worth $1,000. Final balance: $3,000.
Fund B halves in year one, then doubles back in year two. Its price path is 1.00, then 0.50, then 1.00. The first $1,000 buys at 1.00 and finishes at 1.00, so it is worth $1,000. The second $1,000 buys at 0.50 and finishes at 1.00, so it is worth $2,000. Final balance: $3,000.
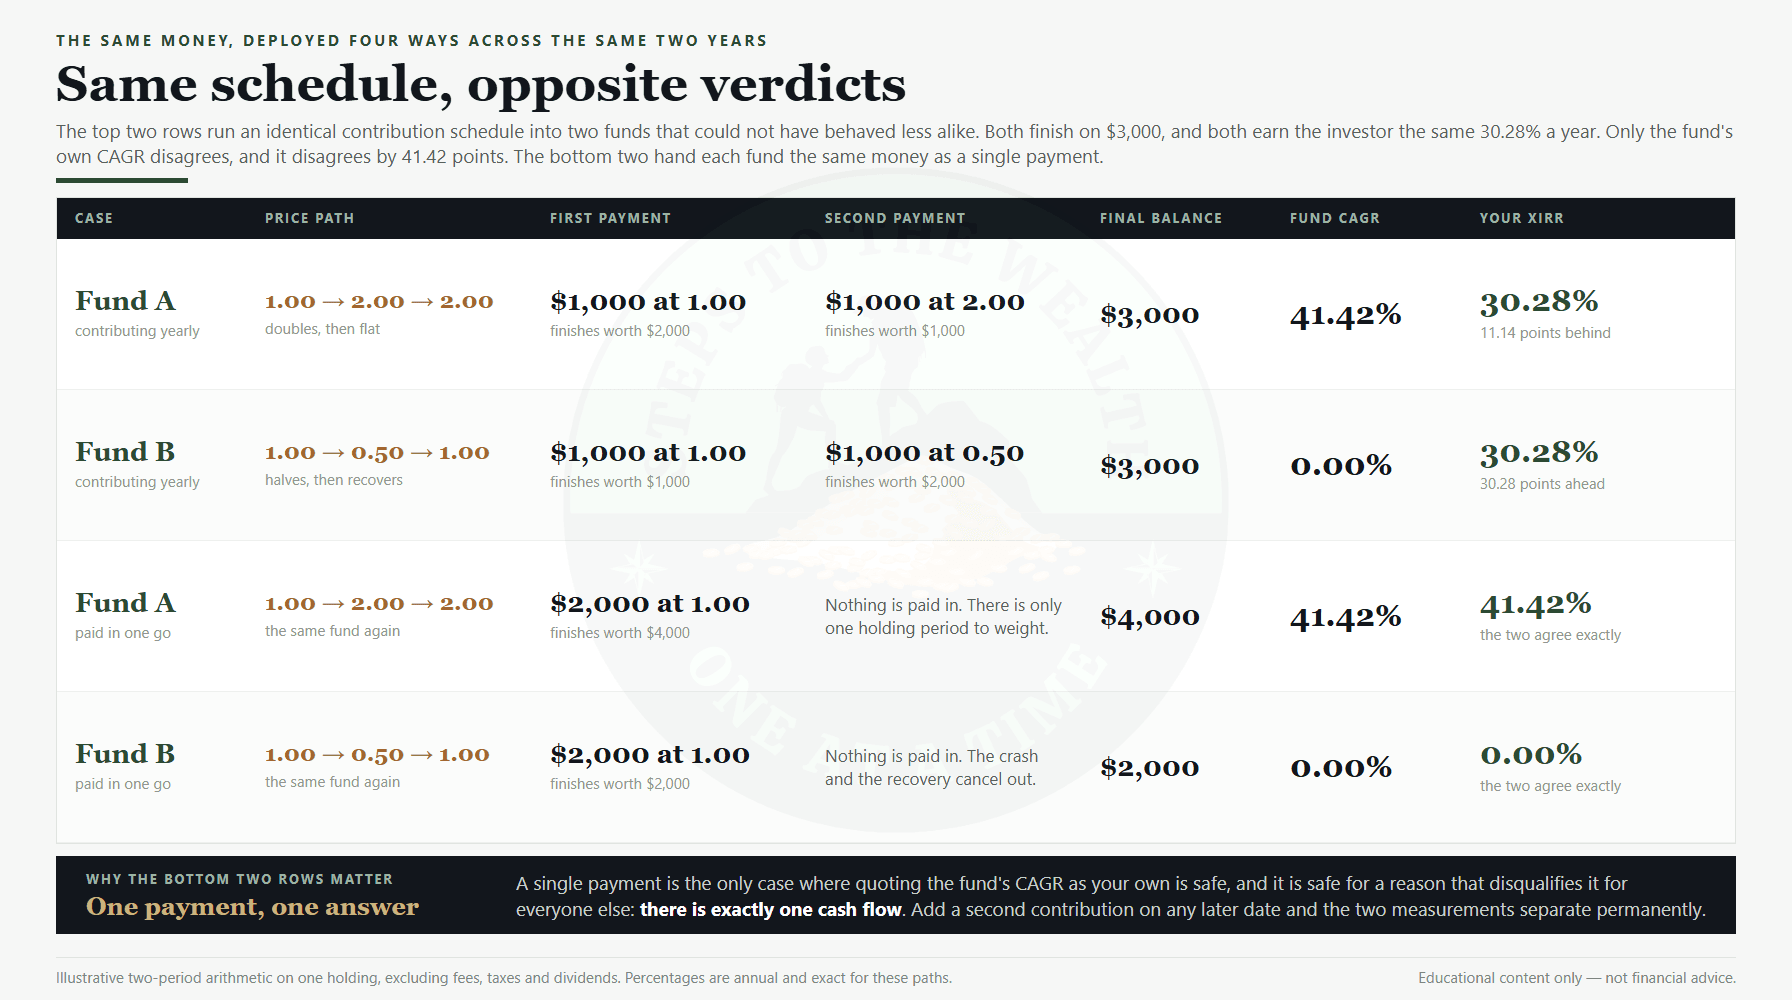
Now measure them. Fund A went from 1.00 to 2.00 over two years, so its CAGR is the square root of 2, or 41.42% a year. Fund B went from 1.00 back to 1.00, so its CAGR is 0.00% a year. On the headline number these two funds sit 41.42 percentage points apart, and one of them looks like a write-off.
The investor’s money-weighted return is the same in both. Solving $1,000 compounded for two years plus $1,000 compounded for one year against a $3,000 balance gives a rate of 30.28% a year either way. Checking it: the first $1,000 grows to $1,697.22 across the two years, the second grows to $1,302.78 across the one, and those two figures come to exactly $3,000.00.
Read that back. Against Fund A the investor’s XIRR of 30.28% trails the fund’s 41.42% by 11.14 points. Against Fund B the identical 30.28% beats the fund’s 0.00% outright. Same contributions, same final balance, same money-weighted return — and two headline numbers that would have you believe one plan worked brilliantly and the other did not work at all.
The one case where the two agree is the case with nothing to weight. Hand Fund A the same $2,000 as a single payment on day one and it finishes at $4,000, a money-weighted return of 41.42% a year, identical to the fund’s own CAGR. Do the same with Fund B and both numbers read 0.00%. One cash flow, one holding period, no timing to account for. Add a second contribution on any later date and the two part company for good.
Which way the gap runs, and what it tells you
The direction of the gap is not noise. It is a readout on when your money arrived relative to when the asset moved.
When the asset rises early and flattens late, your XIRR comes in below the CAGR. That is Fund A. The strong years happened while your balance was small, and the larger balance you eventually built sat through the flat part. The fund earned its number. You were not there for most of it.
When the asset falls early and recovers late, your XIRR can come in above the CAGR, sometimes by a wide margin. That is Fund B. Your later and larger contributions bought cheap, and the recovery then lifted a bigger pile than the drawdown ever hurt.
This is why “the fund returned 12%, so I made 12%” is close to meaningless for anyone contributing over time. You almost never made the fund’s number. You made your own, and the distance between them is a report card on timing you did not necessarily choose.
The real-world version of Fund B is not a thought experiment. In the 2008 financial crisis the S&P 500 fell 56.78% from its peak and needed a 131.35% gain to get back, which it did not complete until 28 March 2013. Anyone contributing steadily across that window watched a time-weighted return of roughly nothing for more than five years while their money-weighted return was doing something else entirely. That period is walked through contribution by contribution in the S&P 500 through the 2008 crash.
The measurement most investors never run on themselves
There is a reason this distinction stays buried. Almost nobody computes their own money-weighted return, so almost nobody discovers the gap exists.
The best-known study of what retail investors actually earn makes the point without needing any commentary. Barber and Odean tracked 66,465 households at a large discount brokerage from 1991 to 1996. The market returned 17.9% a year over that stretch. The average household in the sample returned 16.4%. The fifth that traded most returned 11.4%.
That is 1.5 points of shortfall for the average household and 6.5 points for the busiest fifth — against the same market, over the same six years. The households in that bottom group were not holding worse assets. They were doing more, and the doing cost them.
The relevant part for this discussion is that not one of those households would have seen that shortfall on a fund fact sheet. The fact sheet said 17.9%. Only a return measured against their own dated cash flows could have told them what they were actually getting, and by extension that the activity was expensive.
This is the practical case for running the number at all. A plan that is quietly underperforming looks identical to a plan that is working, right up until you measure the thing that has actually seen your behaviour. Nobody sends you that figure. You have to go and get it.
Three ways to get your actual number
There are three realistic routes, and they trade accuracy against effort in predictable ways.
A spreadsheet. Excel and Google Sheets both ship an XIRR function. List every contribution as a negative amount against its date, add today’s balance as a final positive amount dated today, and call =XIRR(values, dates). This is the gold standard and it costs nothing. The catch is that it needs an accurate, dated list of every contribution you have made, which is exactly the record most people do not keep.
Your brokerage’s personal rate of return. Many brokerages now publish a money-weighted figure under a label like “personal rate of return” or “internal rate of return.” Where it exists it is usually computing something XIRR-shaped, and it is free. Read the fine print before trusting it, because plenty of platforms still show a time-weighted return by default — the fund’s number, wearing your account’s name.
A simulator. If you are modelling a plan rather than auditing a live account, the DCA Simulator reports the money-weighted return on every run, alongside ROI, gain or loss, maximum drawdown, Sharpe ratio and win rate. Change the asset, change the window, change the contribution schedule, and watch the money-weighted number move against the asset’s own performance. That is the fastest way to build intuition for when timing helps and when it quietly does not.
For the plain compounding arithmetic underneath all of this, the SEC’s compound interest calculator on Investor.gov is a neutral reference with nothing to sell.

Where each method quietly lies to you
Every route above has a failure mode worth naming, because each one produces a confident number whether or not it has earned the confidence.
The spreadsheet is only as good as your cash flow list. Miss a contribution and XIRR still returns a clean percentage — a wrong one, silently. Dividends reinvested inside the account are not cash flows and must not be listed; money transferred in from another account is a cash flow and must be. Getting this wrong is the most common way a hand-built XIRR ends up meaningless.
The brokerage figure is only as good as its label. Two platforms can print “your return” against genuinely different calculations, and neither will tell you which one you are looking at unless you go and read the methodology page. If the number tracks the fund’s published return suspiciously closely, you are probably looking at a time-weighted figure.
The simulator is a model, not your account. It reports what the schedule you specified would have produced on the asset you selected. It does not know about the month you skipped, the fees your platform charges, or the tax treatment where you live.
None of these are reasons to skip the measurement. They are reasons to know which of the three you are quoting when you tell yourself what your plan earned.
What the number still will not tell you
A money-weighted return is a better answer to the right question. It is not a complete picture, and treating it as one is its own mistake. It is also only half of a comparison, because the number means nothing until you benchmark your portfolio against a comparator that received the same cash flows on the same dates.
It is a nominal figure. A 30% money-weighted return during a period of high inflation is not 30% of purchasing power, and the gap between those two readings is larger than most people carry in their heads. That gap is taken apart in inflation versus nominal returns.
It says nothing about risk. Two plans can post the same XIRR with completely different drawdowns along the way, and the one that put you through a 55% decline is not the same plan as the one that did not, however identical the endpoints look. A return without a drawdown figure beside it is half a sentence.
It is also backward-looking by construction. XIRR describes cash flows that have already happened against a balance that exists today. It is a measurement, not a forecast, and it carries no information about what the next four years will do.
And it is sensitive to the window. Ending your measurement at a market peak, or six weeks after one, can produce visibly different numbers from identical contributions. That is an argument for measuring on a fixed schedule rather than whenever the balance looks encouraging.
How to use both numbers without fooling yourself
The practical answer is not to choose. It is to keep both and read them as a pair, because the pair carries information neither number holds alone.
Use CAGR to judge the asset. When you are deciding between two funds, or asking whether the thing you own is doing what you bought it to do, the time-weighted number is the correct one, and your contribution timing has no business contaminating that comparison.
Use XIRR to judge the plan. When you are asking whether your contribution schedule, your top-ups and your restraint added up to anything, the money-weighted number is the only one that has seen your behaviour.
Then read the gap. A persistently negative gap, with your XIRR below the asset’s CAGR year after year, usually means your balance grew fastest during the asset’s quietest stretches. That is often just arithmetic rather than a mistake, since a contribution plan is smallest at the beginning by definition. A persistently positive gap usually means your money was weighted toward drawdowns. Neither reading is a verdict on its own, and both are worth a look once a year rather than once a week.
Once a year is the right cadence, alongside everything else worth reviewing on a schedule; the process is laid out in the annual investing review. If you want the effect isolated rather than inferred, backtesting a DCA plan lets you hold the asset constant and vary only the schedule, which is the cleanest way to watch a money-weighted return respond to timing alone.
This measurement is also what makes a deployment strategy checkable rather than merely believable. The case for a risk-first, dynamic DCA approach, deploying harder when conditions favour the buyer, shows up in the money-weighted number and nowhere else. Two investors in the same fund over the same window can post an identical CAGR and a wide XIRR spread, purely from when they put money to work. That spread is the strategy. If you cannot see it, you cannot tell whether the system is doing anything at all, and a system you cannot audit is a belief.
The takeaway
CAGR tells you how the investment performed. XIRR tells you what you earned. For a single lump sum they are the same number; for a stream of contributions they can be tens of points apart, and the gap between them is a direct readout on whether your money arrived at good moments or poor ones.
Use CAGR to compare assets. Use XIRR to judge your own plan. And when a platform, a fact sheet or a screenshot shows you exactly one of them, find out which question it is answering before concluding anything about whether your system is working.
Most people never run this calculation, and then spend years arguing with a number that was never about them. Building the cash flow list takes an afternoon once, and about a minute a year after that. That is a cheap price for finally knowing.
See both numbers on your own plan
Open the DCA Simulator and run any asset against any schedule. It reports the money-weighted return next to ROI, drawdown and volatility, so you can see how much of your result came from the asset and how much came from your timing.
Want the deployment framework behind better timing? The free Dynamic DCA Blueprint lays it out on one page.
Related reads
- Lump sum versus dollar-cost averaging
- Value averaging versus DCA
- The most common myths about dollar-cost averaging
Educational content only — not financial advice. Examples use simplified two-period scenarios for illustration and exclude fees, taxes and dividends. Return calculations describe historical or hypothetical results and do not predict future performance. Past performance does not predict future results.