
Most investing content treats bonds the way most people treat a dentist appointment. Necessary, probably. Boring, definitely. Something to deal with when forced to.
That framing produces two failure modes, and working professionals hit both. The first is ignoring bonds entirely until some birthday triggers a panic shift into a heavy fixed-income allocation. The second is the opposite: treating bonds as the part of the portfolio that cannot lose money, and then being genuinely shocked when it does.
Both mistakes come from the same gap. Bonds for working professionals are almost never explained as a mechanism — only as a vibe, either “safe” or “boring.” So here is the mechanism, with the arithmetic worked out rather than asserted, and no recommendation about how much you should hold.
Educational content only. Not financial advice.
Why “bonds are the safe part” is the wrong sentence
A bond is a loan with a schedule. You hand over money, you are owed a defined stream of payments on defined dates, and at the end you are owed the face value back. That is the whole product, and the regulator’s own plain-language summary of bonds describes it the same way.
What makes it feel safe is that the schedule is fixed. Unlike a share, nothing about what you are owed depends on how a business performs. If the borrower pays, you get exactly what the contract says.
What makes “safe” the wrong word is that the schedule being fixed does not make the bond’s price fixed. Between the day you buy and the day it matures, that contract trades. Its price moves, sometimes sharply, and it moves for a reason that has nothing to do with whether the borrower is in trouble.
The word doing the damage is “safe,” because it collapses two different risks into one. Credit risk is the chance you are not paid. Price risk is the chance the contract is worth less than you paid if you need to sell before it matures. A government bond can carry almost no credit risk and still deliver a double-digit loss to someone who sells at the wrong moment.
What actually moves a bond’s price
Prevailing interest rates. That is essentially the whole story for a high-quality bond.
Think about why. You own a contract paying a fixed rate. New bonds start being issued at a higher rate. Nobody will pay you full price for the old, lower-paying contract when they can buy the new one instead. Your contract’s price has to fall until its return from here matches what the new one offers.
That is the entire mechanic, and it runs in both directions. When prevailing rates fall, your older, higher-paying contract becomes more valuable and its price rises. Nothing about the borrower changed in either case. The contract is worth what it is worth relative to the alternatives available today.
How violently the price moves depends on how long the contract runs. A bond maturing next year barely moves, because you get your money back almost immediately and can reinvest at the new rate. A bond maturing in twenty years moves a lot, because you are locked into the old rate for twenty years. That sensitivity has a name, duration, and it is roughly how many percent the price moves for each one-point move in yields.
Bonds for working professionals: the 9.21% nobody mentions
Numbers make this concrete in a way that no amount of explanation does. Here is the simplest possible bond, so nothing is hidden in the coupons.
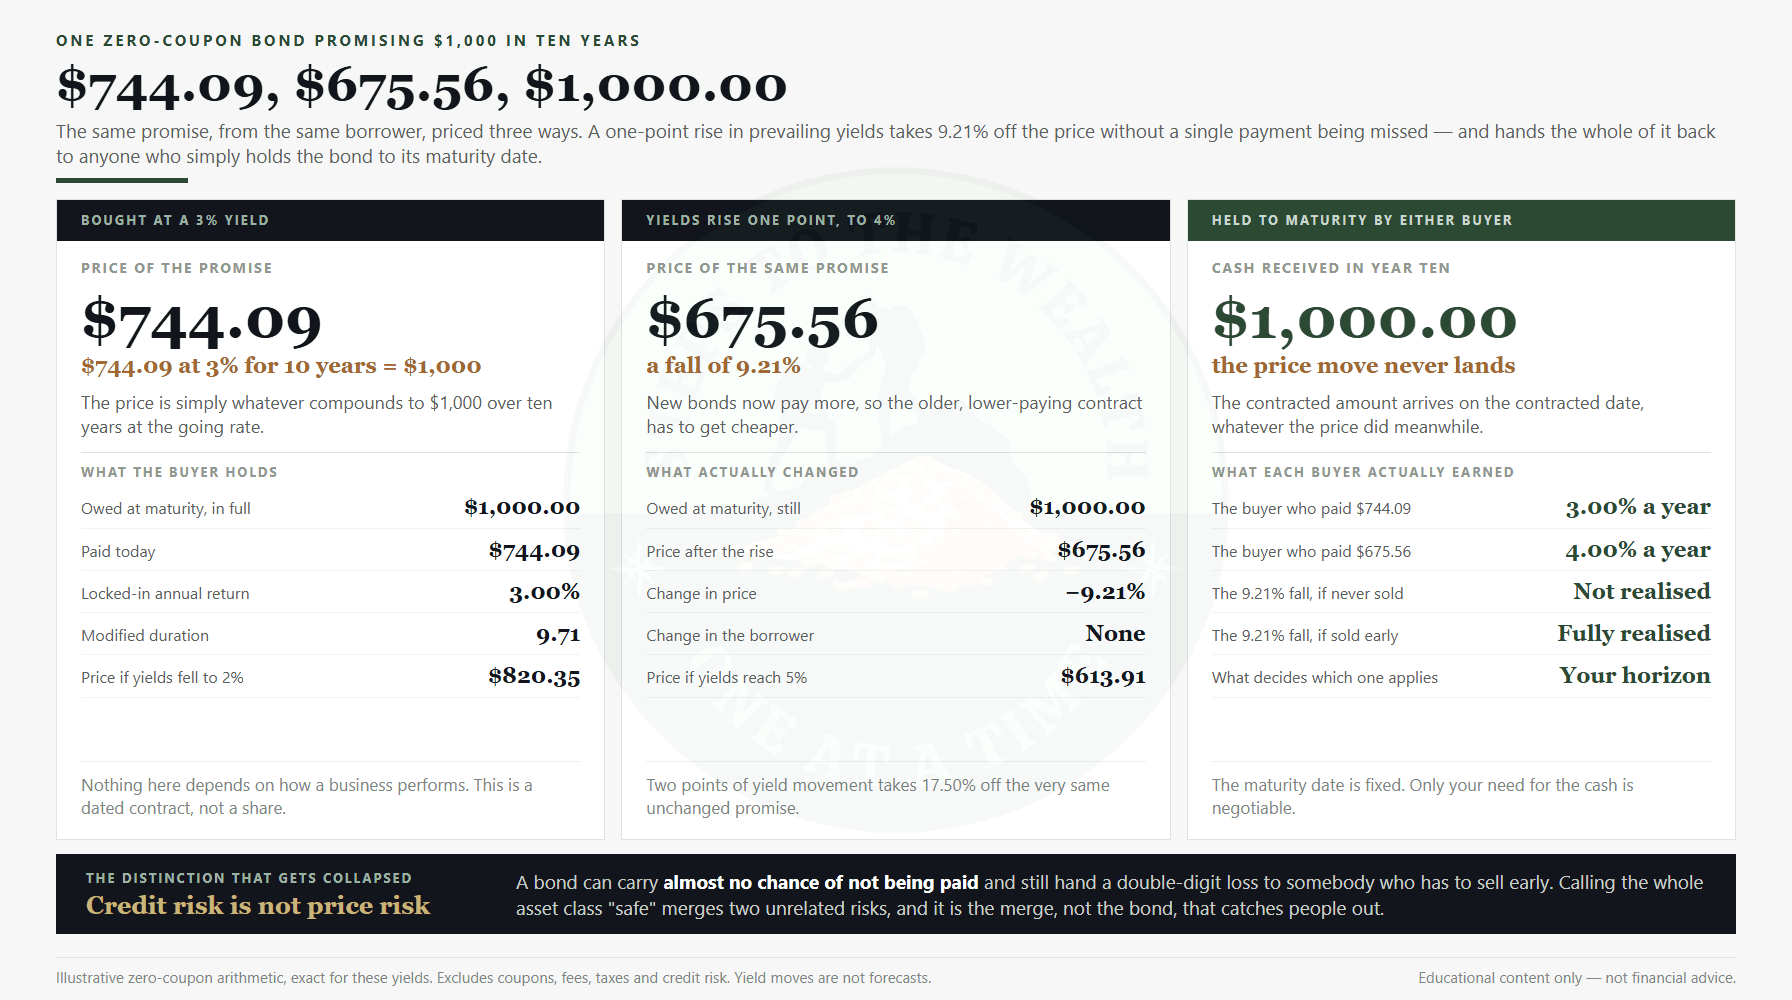
Take a zero-coupon bond: no interest payments at all, just a promise of $1,000 in ten years. Its price today is whatever makes that promise worth the going rate. At a 3% yield the price is $744.09, because $744.09 compounding at 3% for ten years is exactly $1,000.
Now prevailing yields rise by one percentage point, to 4%. Nothing about the borrower has changed. The same promise of $1,000 in ten years is now worth $675.56, because that is what compounds to $1,000 at 4%.
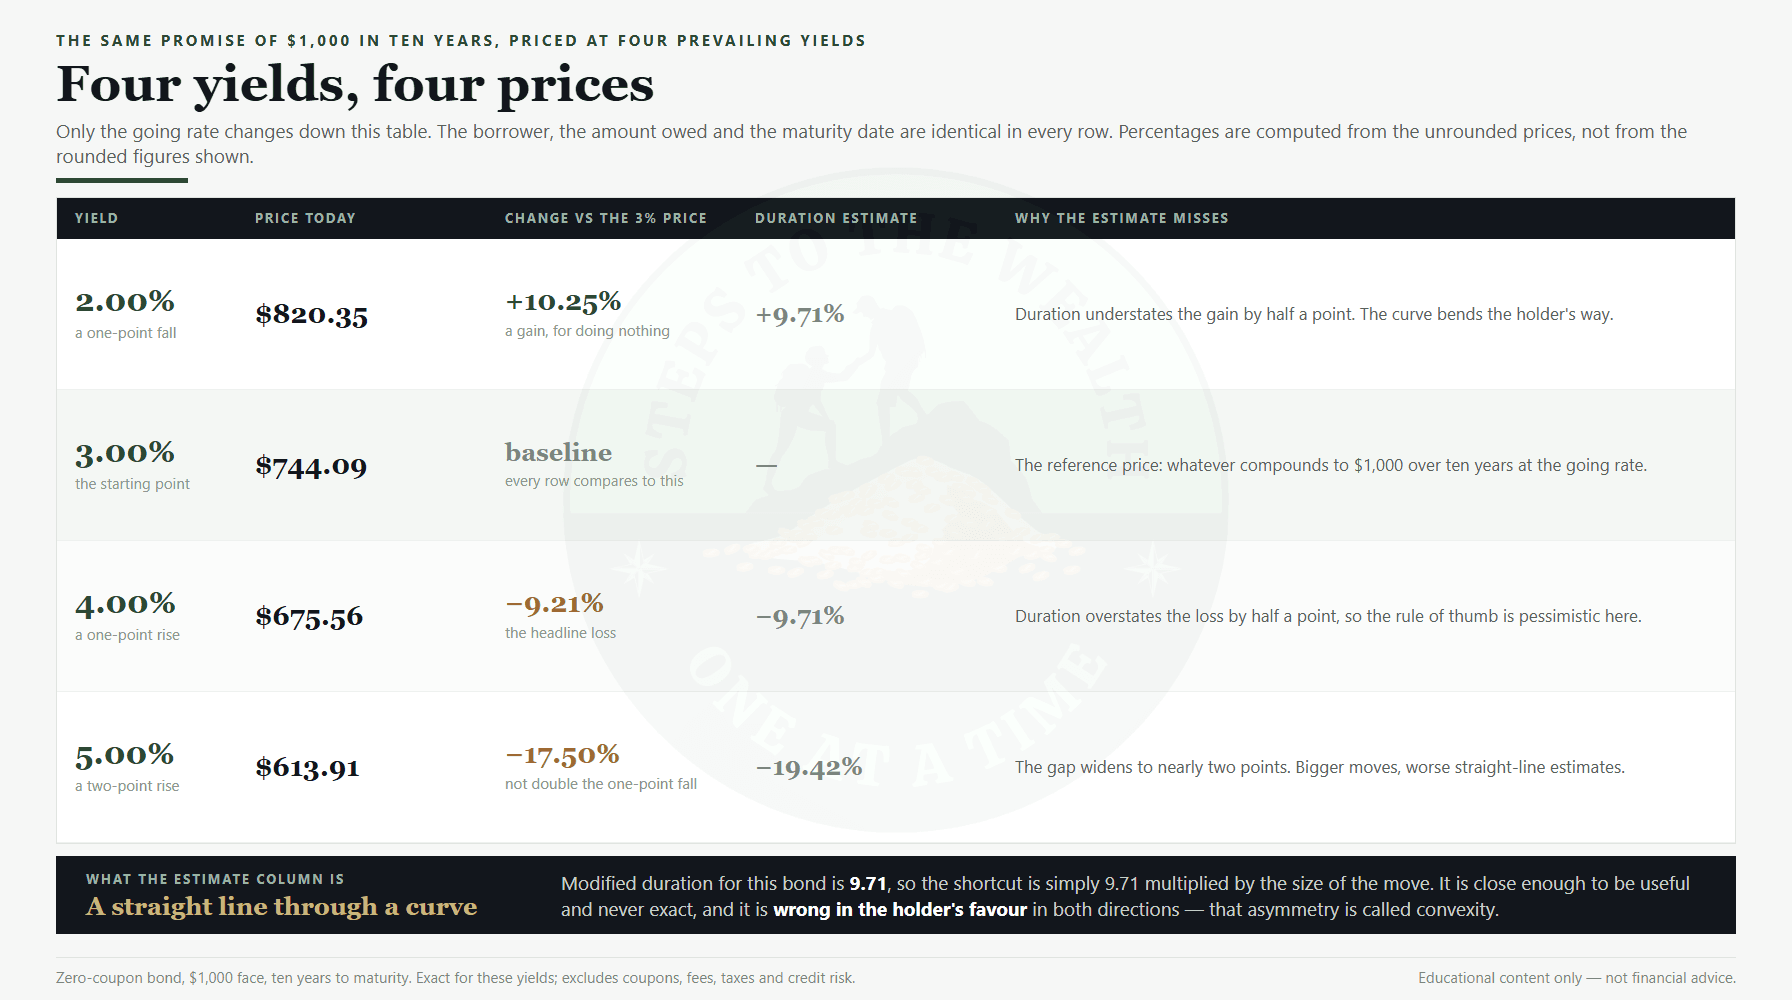
That is a 9.21% loss, from a one-point move, on an instrument widely described as the safe part of a portfolio. Push the move to two points and the price falls to $613.91, a 17.50% loss. Nobody defaulted. No payment was missed. The contract is exactly as sound as it was.
It runs the other way too. Had yields fallen a point to 2%, the price would be $820.35 — a 10.25% gain for doing nothing at all. Bonds are not the part of the portfolio where nothing happens. They are the part where what happens is driven by a different variable.
Worth noting how well the duration shortcut holds up here. This bond’s modified duration is 9.71, so the rule of thumb predicts a 9.71% fall for a one-point rise. The actual fall is 9.21%. The half-point difference is convexity: the rule of thumb is a straight line through a curve, and it slightly overstates losses and understates gains. Useful, not exact.
The one thing that decides whether that loss is real
Here is the part that most coverage of the “bonds can lose money” story leaves out, and it changes the meaning of every number above.
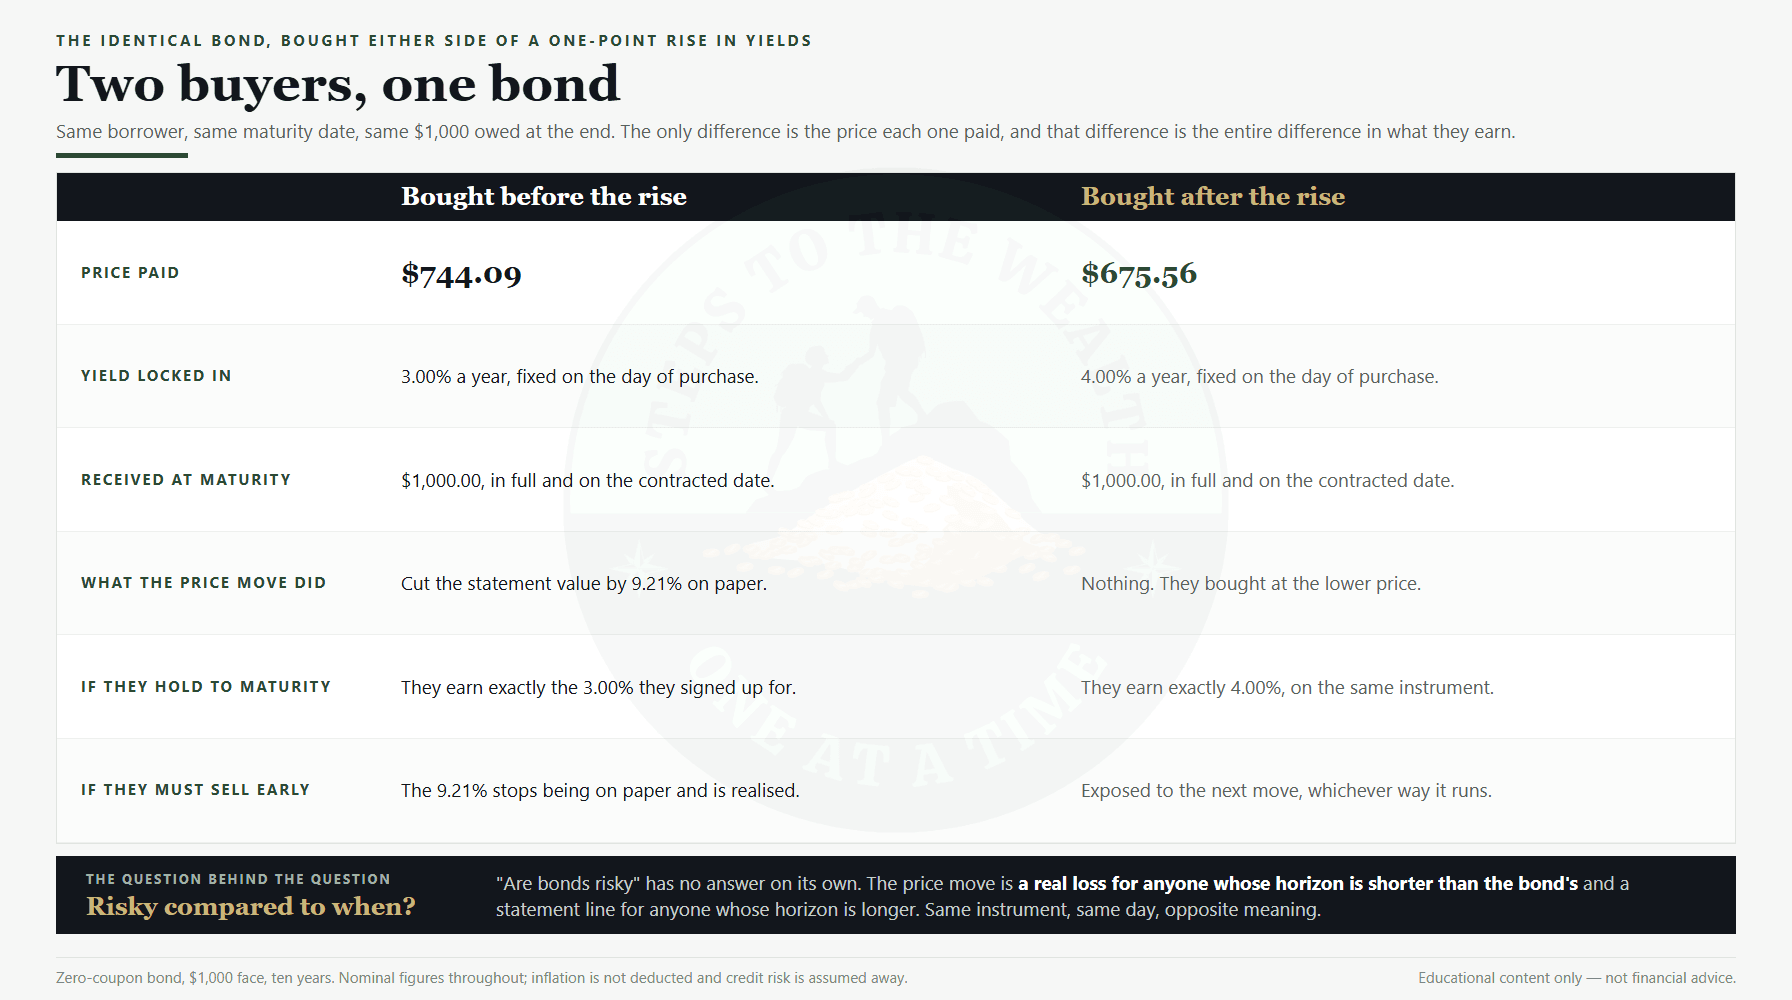
The person who bought at $744.09 and watched yields go to 4% has lost 9.21% if they sell. If they hold the bond to maturity, they receive $1,000 in ten years, exactly as contracted. Their return is exactly 3.00% a year — the rate they signed up for. The price drop was real on a statement and entirely irrelevant to the outcome.
Meanwhile the person who bought after the rise, at $675.56, holds the same bond to maturity and earns exactly 4.00% a year. Same instrument, same maturity date, two different returns, decided entirely by the price each one paid.
So the loss is not a fiction, but it is conditional. It is real for anyone whose horizon is shorter than the bond’s, and it is noise for anyone whose horizon is longer. This is why the question “are bonds risky?” has no answer without a second question attached: risky relative to when you need the money?
Two practical consequences follow. A bond held individually to maturity gives you a known outcome in nominal terms. A bond fund does not, because it never matures — it continuously sells and rebuys, so its price genuinely is your outcome. Those are different products wearing similar labels, and the distinction matters most in exactly the moment people stop reading.
What a bond sleeve actually does to a drawdown
The usual case for holding any bonds at all is that they cushion the fall when equities drop. That case is worth stating arithmetically rather than as a feeling.
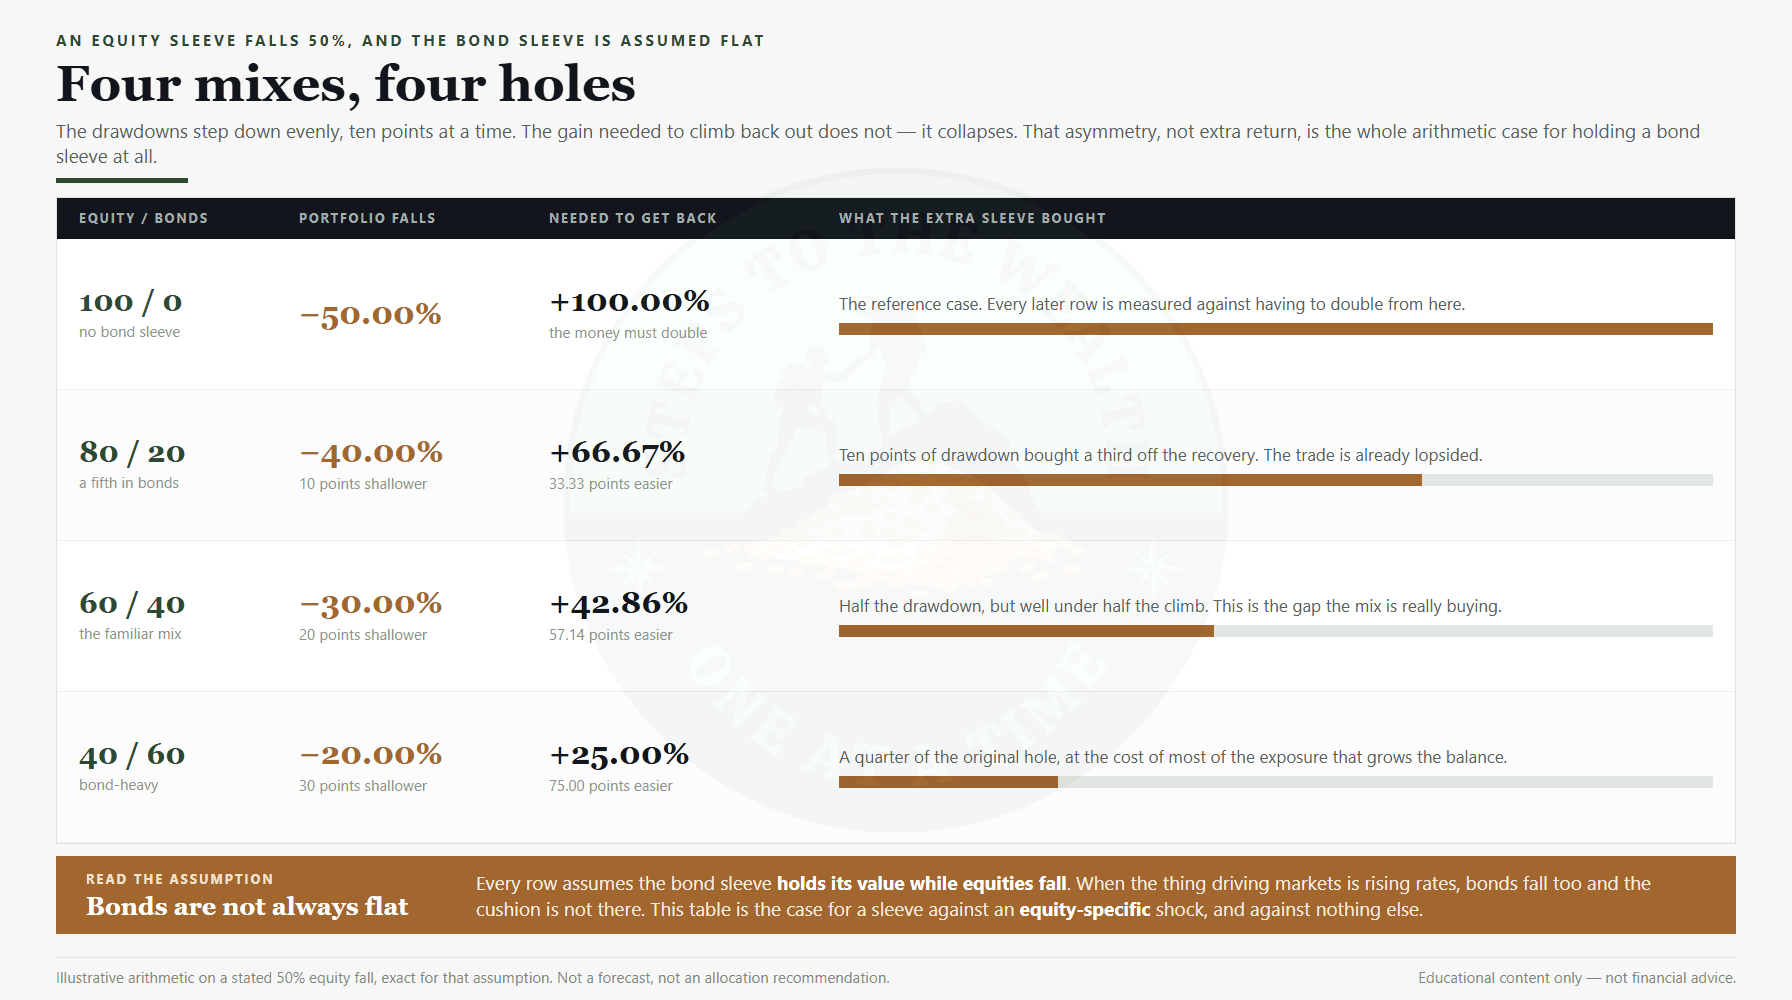
Assume an equity sleeve falls 50% and a bond sleeve is flat over the same stretch. Hold that assumption loosely for a moment; it is doing a lot of work and we will come back to it. The general framing of splitting a portfolio across asset classes is covered neutrally in the SEC’s guide to asset allocation.
An all-equity portfolio falls the full 50% and needs a 100.00% gain to get back to where it started. Add a fifth in bonds, and an 80/20 portfolio falls 40.00% and needs 66.67%. A 60/40 falls 30.00% and needs 42.86%. A 40/60 falls 20.00% and needs 25.00%.
Look at the shape of that. The drawdowns fall in even steps, ten points at a time. The recovery figures do not — they collapse from 100.00% to 66.67% to 42.86% to 25.00%. That asymmetry is the actual argument for a bond sleeve, and it is not about return. It is that the hole you have to climb out of gets disproportionately shallower, and a shallower hole is one you are more likely to still be standing in when it fills.
The same asymmetry is why drawdown deserves attention that headline returns usually monopolise — a point taken apart in volatility is not risk and in how diversification actually reduces risk.
Now take that assumption back
The arithmetic above assumed the bond sleeve stays flat while equities fall. That assumption has been wrong, badly, within living memory.
Bonds and equities can fall together, and they do it precisely when the thing driving markets is rising interest rates rather than a growth scare. In that environment the mechanism from earlier in this article is working exactly as described — rates up, bond prices down — at the same moment equities are repricing for the same reason. The cushion is not there when the cause of the fall is the cause of the cushion’s fall.
This is the honest limitation of every static allocation rule you will read. They are calibrated on a correlation that is not a law of nature. A bond sleeve is a hedge against an equity-specific shock, not a hedge against everything, and treating it as general-purpose insurance is how people end up surprised twice in one year.
Nothing here says do not hold bonds. It says know which risk the sleeve is actually covering, because a hedge you have misidentified is worse than no hedge — you will size other positions as though you are protected.
The variable that quietly outranks all of this
There is a bigger factor than the allocation debate, and it is unglamorous enough that almost nobody leads with it.
For most working professionals in the accumulation phase, the size of the contribution dominates the mix of the portfolio. A few percentage points of allocation difference on a small balance is a rounding error against the effect of contributing more, or contributing consistently. The allocation question becomes genuinely load-bearing later, when the balance is large enough that a 30% fall is a number that changes your life rather than a number that annoys you.
Which is to say the right answer changes with the stage you are at, not with your age — the distinction is the whole subject of the stages of wealth building. Age is a proxy for balance and horizon, and it is a poor one. Two people the same age with a tenfold difference in balance and different income stability do not have the same problem.
The related trap is treating a bond sleeve as an emergency fund. They are not the same instrument and they do not do the same job; one is a horizon-matched allocation and the other is liquidity you can reach without selling anything at a bad moment. That distinction is worked through in emergency fund versus investing, and in why cash is a position.
Matching maturity to horizon, which is the actual mechanism
If the price move only matters when your horizon is shorter than the bond’s, then the obvious move is to stop leaving that to chance. Match what you hold to when you need it.
That is all a maturity ladder is. Instead of putting everything into one maturity, you hold several with staggered end dates, so something is maturing at intervals. Each rung, held to its own maturity, delivers its contracted outcome regardless of what prices did in between. You are never forced to sell into a bad market to raise cash, because cash arrives on a schedule you set.
Notice what that does to the 9.21% from earlier. It does not hedge it or offset it. It makes it structurally irrelevant to the rungs you hold to maturity, because a paper loss you are never required to realise is not a loss. The rungs maturing soonest barely move on price anyway, and the ones that move most are the ones furthest from needing to be sold.
There is a real cost, and it should be stated rather than glossed. A ladder gives up the chance of the large price gain you would get from holding long maturities into a falling-rate environment. The $820.35 outcome from earlier — a 10.25% gain for doing nothing — is exactly what you are declining. You are trading the upside of being right about rates for not having to be right about rates at all.
That trade is the same one running underneath every risk-first decision on this site: give up an uncertain edge in exchange for removing a way to be forced into a bad move. It is the bond-market version of the argument in margin of safety in investing.
The mechanism also explains the fund-versus-individual-bond distinction from earlier without needing a rule. A fund has no maturity date, so it has no rung you can hold to. It has an average duration instead, which tells you how it reacts to rates but never hands you a date on which a known amount arrives. Neither is better. They answer different questions, and only one of them can be horizon-matched.
What the arithmetic here does not tell you
Everything above is nominal. A bond promising $1,000 in ten years promises $1,000 of then money, and inflation decides what that is worth. Fixed income is the asset class where this bites hardest, precisely because the payment is fixed and cannot adjust. The gap between a nominal and a real return is larger than most people carry in their heads, which is the subject of inflation versus nominal returns.
It also says nothing about credit. Every figure here assumes the borrower pays. Move down the quality scale and you are adding a second, different risk on top of the price mechanics, and the extra yield you are offered is the market’s price for that risk rather than free money.
And it deliberately says nothing about tax treatment or specific products, because those are set by the jurisdiction in which you live and vary enormously. Any article that tells you which wrapper or which instrument to use without knowing where you are is guessing.
Finally, none of it is a forecast. The examples move yields by a point or two to show a mechanism. That is not a prediction about rates, and anyone confidently telling you where rates go next is selling something — a point that generalises well beyond bonds, as the macro indicators I ignore gets into.
How to think about it without a rule of thumb
The rules of thumb are appealing because they replace a hard question with an easy one. “Your age in bonds” is the famous example. It uses a number that correlates loosely with the thing that actually matters and ignores the thing itself.
The mechanical questions underneath are more useful, and none of them need a guru. When do you actually need this money, and does the maturity of what you hold match that? If the sleeve fell 15% next year while equities also fell, would you still be able to leave the rest alone? Are you holding individual bonds to maturity, where the price move is noise, or a fund, where the price move is the outcome?
Those questions have answers specific to you. A percentage from a chart does not. If you want to see how a mix behaves before you commit to it rather than after, stress-testing the portfolio is the cheaper order to do it in, and rebalancing versus chasing covers what to do when the mix drifts.
None of this makes bonds interesting. It makes them legible, which is more useful. An asset class you understand mechanically is one you can size deliberately, and deliberate sizing is the whole game — the same logic that drives the dynamic DCA approach on the equity side.
The takeaway
Bonds are not the safe part of a portfolio. They are the part whose risk is driven by interest rates instead of earnings, and that is a genuinely different risk, not an absent one. A one-point move in yields took our ten-year example from $744.09 to $675.56, a 9.21% loss, with the borrower’s position completely unchanged.
Whether that loss means anything to you depends on one thing: whether you need the money before the bond matures. Shorter horizon than the bond, and the price move is your problem. Longer, and it is a line on a statement that resolves itself.
And the cushion argument is real but conditional. A bond sleeve turns a 100.00% recovery problem into a 66.67% or 42.86% one, which is a large favour — as long as the sleeve holds up in the specific crisis you get, and there are crises where it does not.
Know which risk you are buying and which one you are not. That is the entire skill here, and it takes an afternoon to learn rather than a career.
Model a mix before you commit to it
Open the DCA Simulator and run a schedule against different assets and windows. It reports maximum drawdown and volatility next to the money-weighted return, so you can see what a fall actually looks like on your numbers rather than on a chart in an article.
Want the deployment framework behind sizing decisions? The free Dynamic DCA Blueprint lays it out on one page.
Related reads
Educational content only — not financial advice. Bond examples use a simplified zero-coupon instrument to isolate the price mechanism and exclude coupons, fees, taxes and credit risk. Yield movements are illustrative and are not forecasts. Past performance does not predict future results.