
Educational content only. Not financial advice.
A goal plan mismatch is arithmetic, not a discipline problem
If you have been saving and investing for a few years and it feels like nothing is moving, the explanation is usually not effort, discipline or asset selection. It is that the goal you carry in your head and the plan you actually run belong to two different futures.
That is a goal plan mismatch. The number you want and the machine you built to produce it do not agree, and consistency never reconciles them. A plan can run flawlessly for fifteen years and still miss by an order of magnitude, because the arithmetic underneath it was never capable of the outcome in the first place.
This sits upstream of portfolio construction, which is why it is worth settling first. Choosing a better fund inside a plan that is nine times too small moves the final number by a rounding error. Choosing a plan that can actually reach the goal changes everything downstream of it.
The useful part is that this is a measurable problem. A goal is a number and a date. A plan is a contribution, a horizon and a return assumption. Both sides resolve to a figure, and the two figures either match or they do not. Nothing here requires a forecast, an opinion or a market view.
What follows is that comparison, run once with real numbers, and then the three moves available when the two sides disagree.
The $3,000,000 goal and the $316,962 plan
Take the version of this that shows up most often among working professionals.
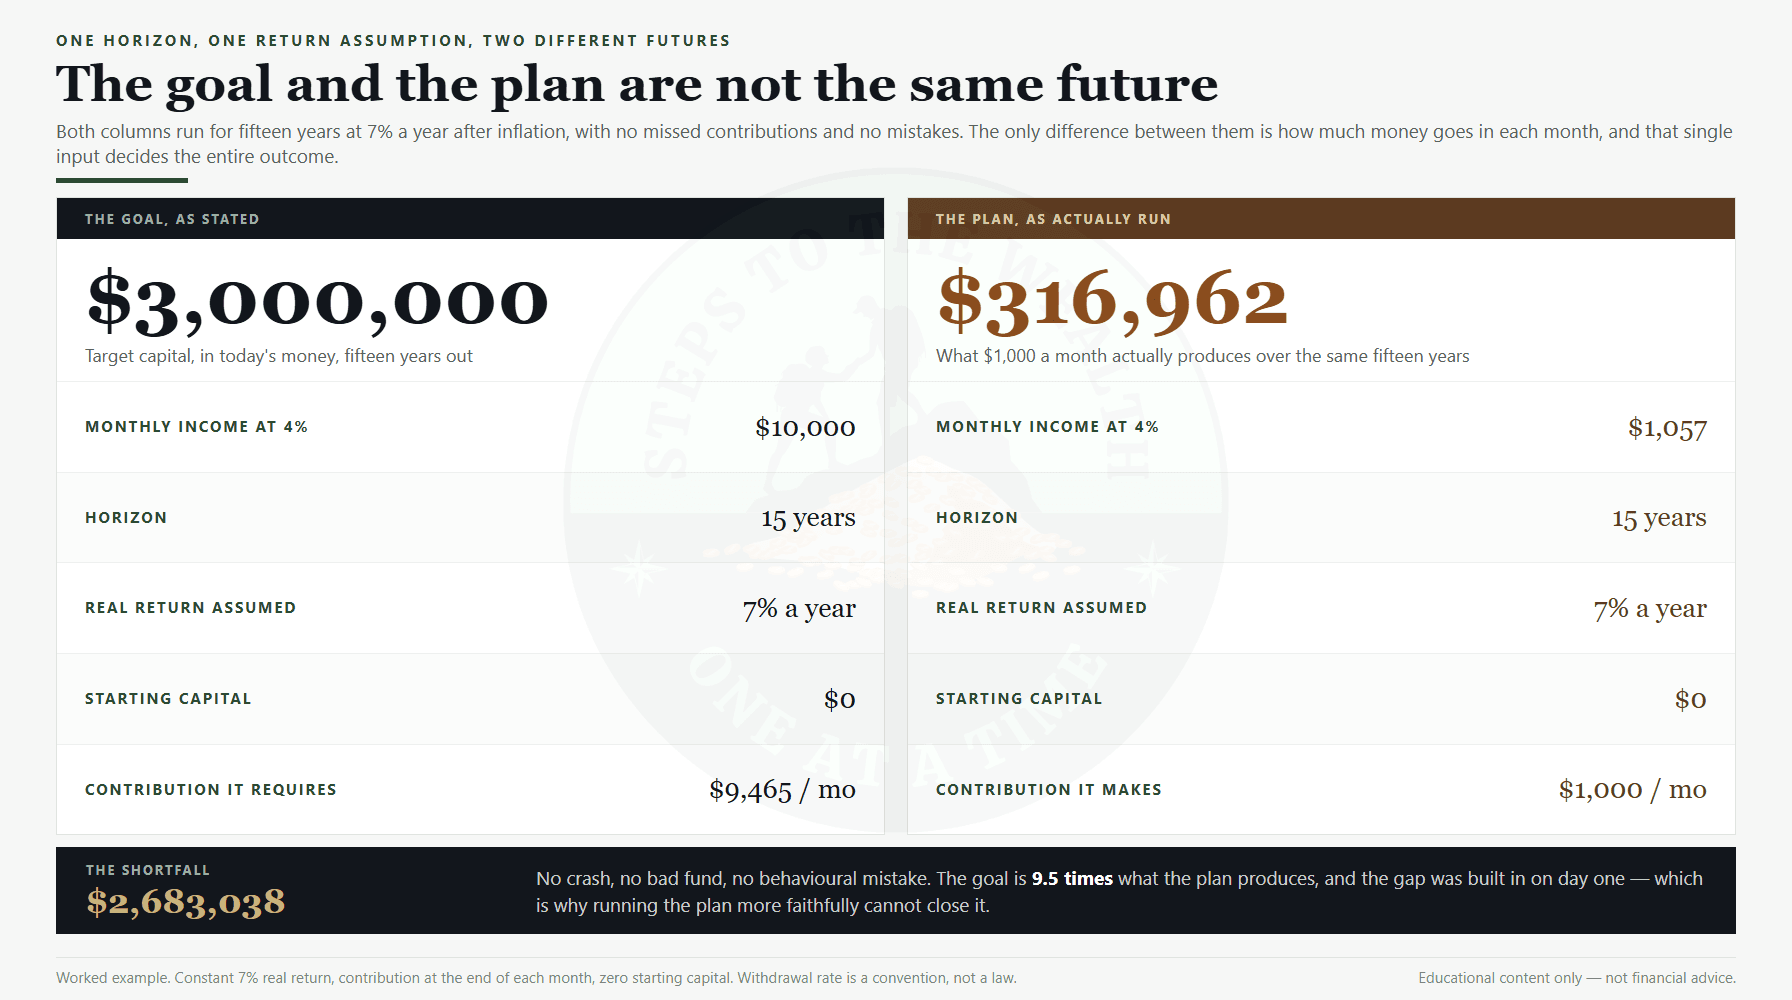
The goal is stated as financial independence in fifteen years, which on inspection means roughly $10,000 a month in income without working. At a 4% withdrawal rate, that is $3,000,000 of invested capital in today’s money. Specific number, specific date.
Now the plan. $1,000 a month into a diversified portfolio, assumed to earn 7% a year after inflation, for the full fifteen years. No missed months, no panic selling, no drift. The plan runs perfectly.
Fifteen years of $1,000 a month, compounding monthly at 7%, produces $316,962.
The goal is $3,000,000. The plan delivers $316,962. The shortfall is $2,683,038, and the goal is 9.5 times what the plan produces.
Translated back into the thing that was actually wanted: $316,962 at the same 4% withdrawal rate supports about $1,057 a month, against the $10,000 a month the goal described. The plan is not a slightly weaker version of the goal. It is a different plan for a different life.
Notice what is absent from that paragraph. No market crash. No bad fund. No behavioural mistake. The person in this example did everything they said they would do, and the gap is still there at the end, because it was built in on day one.
That is what structural means. The math underneath the plan cannot produce the outcome the goal demands, so effort cannot close it. You can check the compounding side of this yourself against the regulator’s own compound interest calculator, which runs the same arithmetic with nothing to sell you.
Why the gap stays invisible for years
The reason almost nobody spots this is that every individual decision inside the plan passes inspection on its own.
Saving 10% of your income into a broad index fund feels disciplined. Holding cash because you are waiting for a better entry feels prudent. Spreading across asset classes feels safe. Buying property for the long term feels mature. Each one survives the smell test in isolation.
The plan only fails when its mathematical output is compared against the goal, and that comparison is almost never run. Goals live in the part of the mind that makes January resolutions. Plans live in a brokerage statement. The two rarely meet in the same conversation, let alone the same calculation.
So the $3,000,000 sits in your head and the $316,962 sits in your account, and the distance between them goes unexamined for a decade.
There is a second reason, and it is less comfortable. The comparison is unpleasant to run. Most people doing it honestly for the first time find their projection lands somewhere between two and ten times short. That is a bad afternoon. Avoiding it for another year costs a year of compounding, which is the most expensive item on the list.
The exercise is also easy to fake without noticing. Using a more optimistic return on the goal side than on the plan side hides the gap without changing anything real. Use one assumption on both sides. The gap should come from structure, not from a friendlier number.
One plan, three prices: income, time and risk
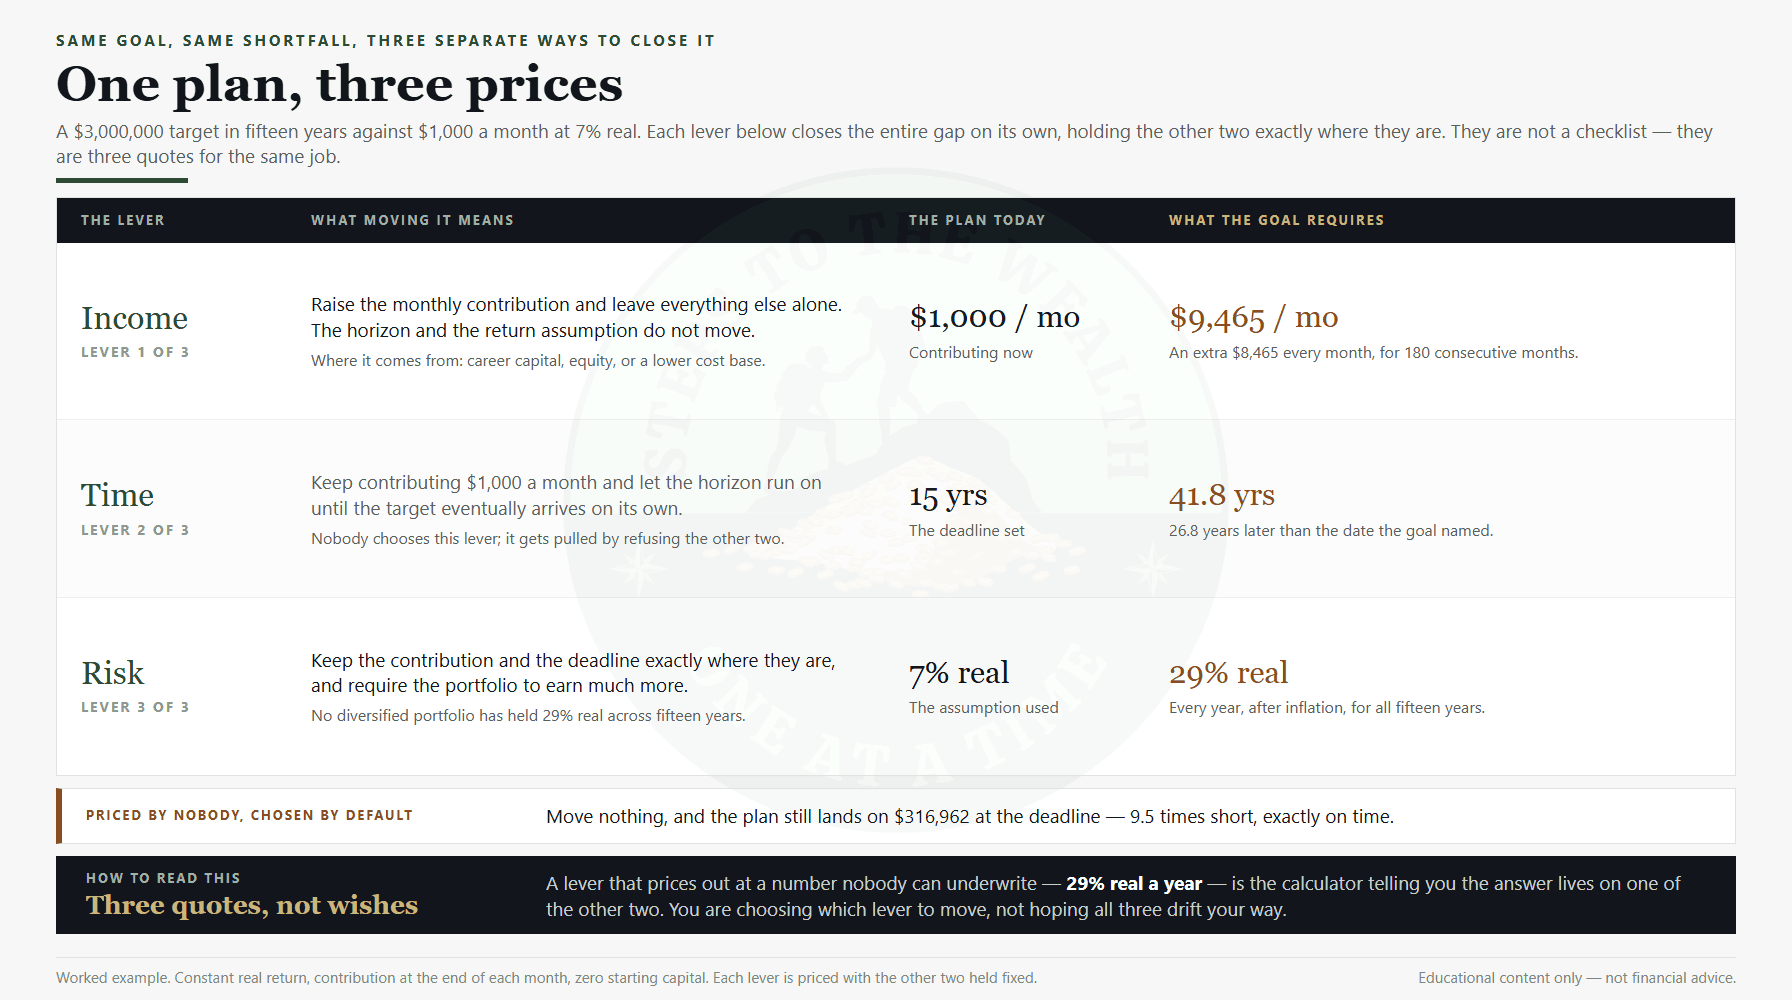
When a goal and a plan disagree, exactly three variables can close the distance. Each one closes the entire gap on its own, holding the other two where you set them. That is what makes them useful. They are not a wish list, they are three prices for the same outcome, and you choose which one you are willing to pay.
Run the example above through the Plan Gap calculator and it prices all three.
The income lever
To reach $3,000,000 in fifteen years at 7% real, the required contribution is $9,465 a month. The plan contributes $1,000. The move is an extra $8,465 every month, for one hundred and eighty consecutive months.
This is the lever most people quietly assume the market will pull on their behalf. It will not. A perfect investing system running on $500 a month is mathematically smaller than a mediocre one running on $5,000 a month, because returns multiply contributions rather than replace them.
For most working professionals in the first decade of serious accumulation, the highest-leverage work is not portfolio optimisation. It is what the income engine pays, and what share of it survives the gap between a raise and a higher savings rate. If the goal is ambitious and income has been flat for three years, that is an income problem wearing an investing problem’s clothes.
The time lever
Keep the $1,000 a month and keep the 7%, and the same target arrives in 41.8 years instead of fifteen. That is 26.8 years later than planned.
Time is the lever that gets pulled by default when the other two are refused, and it gets pulled silently. Nobody decides to retire twenty-seven years late. They decline to raise the contribution, decline to restructure the risk, and the horizon absorbs the difference without anyone writing it down.
It is also the lever where how the hours get spent matters more than most people admit. Driving across town to save $20 while a marketable skill goes unpracticed is a decision about the plan, even when it never feels like one.
The risk lever
Keep the $1,000 a month and keep the fifteen years, and the plan needs 29% real a year, every year, instead of 7%.
That figure is the useful one, precisely because it is unambiguous. No diversified portfolio has produced 29% real annually across fifteen years, and a plan that requires it is not aggressive, it is arithmetically closed. When the risk lever prices out at a number nobody can underwrite, that is the calculator telling you the answer lives on one of the other two.
The honest version of the risk lever is narrower than it sounds. It is not permission to concentrate into whatever moved last quarter. It is the recognition that a portfolio built for preservation cannot fund a goal that requires growth, and that an oversized cash position is itself a decision with a cost attached. Structure it deliberately, using something like the regulator’s plain-language framing of asset allocation, rather than by accident.
What the three levers share is that they are mutually exclusive answers to one question. You are choosing which one to move, not hoping all three drift your way at once.
The smaller gap is the more dangerous one
A 9.5-times gap is easy to write about because it is impossible to argue with. It is also not the common case. The mismatch that quietly costs people the most is the one that looks nearly fine.
Second example, same method. The goal is $1,000,000 in twenty years. The contribution is $1,500 a month, same 7% real. That plan produces $781,390, so the shortfall is $218,610 and the goal is 1.28 times the plan.
Nobody looks at that and panics. It reads as close enough, and close enough is exactly why it survives for two decades. Now price the levers on it.
Income: the required contribution is $1,920 a month, which is an extra $420. Time: the target arrives in 22.7 years, which is 2.7 years late. Risk: the plan needs 9.0% real instead of 7%.
Every one of those is payable. An extra $420 a month is a real commitment but a recognisable one. Working an extra two and a half years is an option rather than a fantasy. Even the return lever, at 9% real, sits inside the range a more growth-weighted allocation has historically occupied, which is a different sentence from the 29% the first example demanded.
That is the point. The severe gap tells you the plan is dead and forces a decision. The mild gap tells you nothing, so it never forces one, and the cheapest fix in the whole exercise goes unmade for twenty years because $1,500 felt close enough to $1,920.
Run the comparison on the mild case specifically. It is the one where measuring pays for itself.
What the calculator assumes, and where it stops
Any number this clean is carrying assumptions, and they are worth stating plainly rather than burying.
The 7% is a real return, meaning after inflation, which is what allows the $3,000,000 target to be read in today’s money. Mixing a nominal return with a target in today’s dollars is the most common way these projections come out flattering, and it is worth knowing where the nominal and real figures separate before trusting any of them.
The contribution is treated as constant in real terms, which means it is assumed to rise with inflation. If you literally contribute $1,000 a month for fifteen years and never raise it, each payment buys less than the last and the projection above overstates the result.
The return is treated as constant. Real markets do not deliver a constant return, and the order in which returns arrive matters enormously near the end of an accumulation. This models the structure of a plan, not a forecast of one.
The 4% withdrawal rate used to convert $3,000,000 into $10,000 a month is a convention, not a law. Tax treatment, account wrappers and what a safe withdrawal rate even means are set by the jurisdiction in which you live, and no calculator can guess yours.
The examples also start from zero invested capital, which almost nobody does. Existing capital compounds for the whole horizon and it moves the answer more than people expect. Put $100,000 into the first example and it grows to $284,895 on its own over the fifteen years, cutting the required contribution from $9,465 to $8,566 a month. Still a very large number, but $899 a month of it was already handled by capital that was sitting there anyway.
The larger limitation is structural, and it is worth understanding before you act on any single figure. Each lever is priced while the other two are held exactly where you set them. Real plans do not move one at a time. Raise the contribution by $500 and take a slightly more growth-weighted allocation, and neither the income figure nor the return figure applies any more, because the true requirement now sits somewhere between them.
Read the three prices as the boundaries of the problem rather than as three quotes to choose from. They tell you the outer cost of solving it with one lever, which is the fastest way to see which combination is realistic.
None of that weakens the conclusion, because the conclusion does not depend on the precision of the assumptions. A gap of 9.5 times does not become a gap of zero if the real return is 6% or 8%. Being wrong by a point or two moves the shortfall. It does not remove it. That is the difference between a plan that is slightly off and a plan that is structurally misaligned.
The priority order most people invert
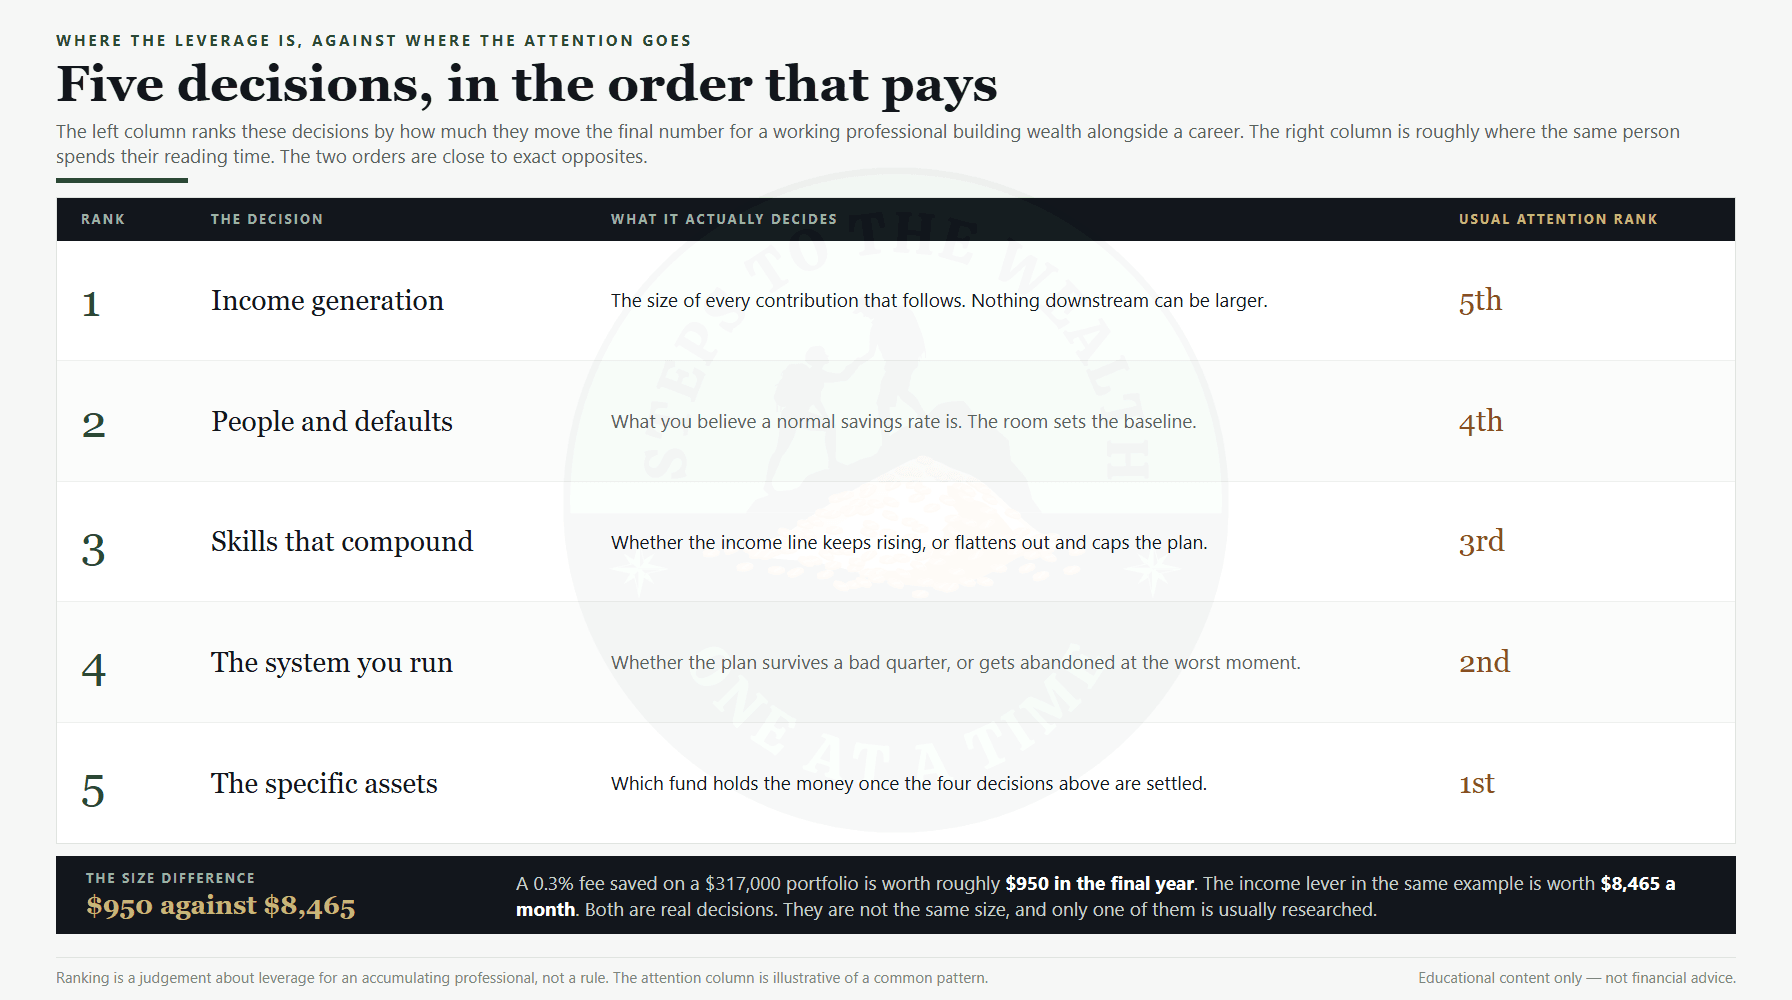
Once the gap is priced, the next question is where the work actually goes. For a working professional building wealth alongside a career, the order that produces results is close to the reverse of where attention usually lands.
Income generation comes first, because it sets the size of everything downstream of it. Then the people around you, because defaults are contagious and your sense of what is normal is set by the room. Then skills, specifically the ones that produce income or compound returns. Then the system: a set of rules you actually run, so the plan survives contact with a bad quarter. Only then the specific assets.
Most people invert this completely. They spend months choosing between two broadly similar funds and no time at all on whether their income, skills and system can support the goal. Asset selection is the last variable to optimise, because the four decisions above determine whether the assets ever matter.
This is not an argument that asset choice is irrelevant. It is an argument about sequence. A 0.3% expense ratio saved on a $317,000 portfolio is worth roughly $950 in the final year. The income lever in the same example is worth $8,465 a month. Both are real. They are not the same size.
The three responses available to you
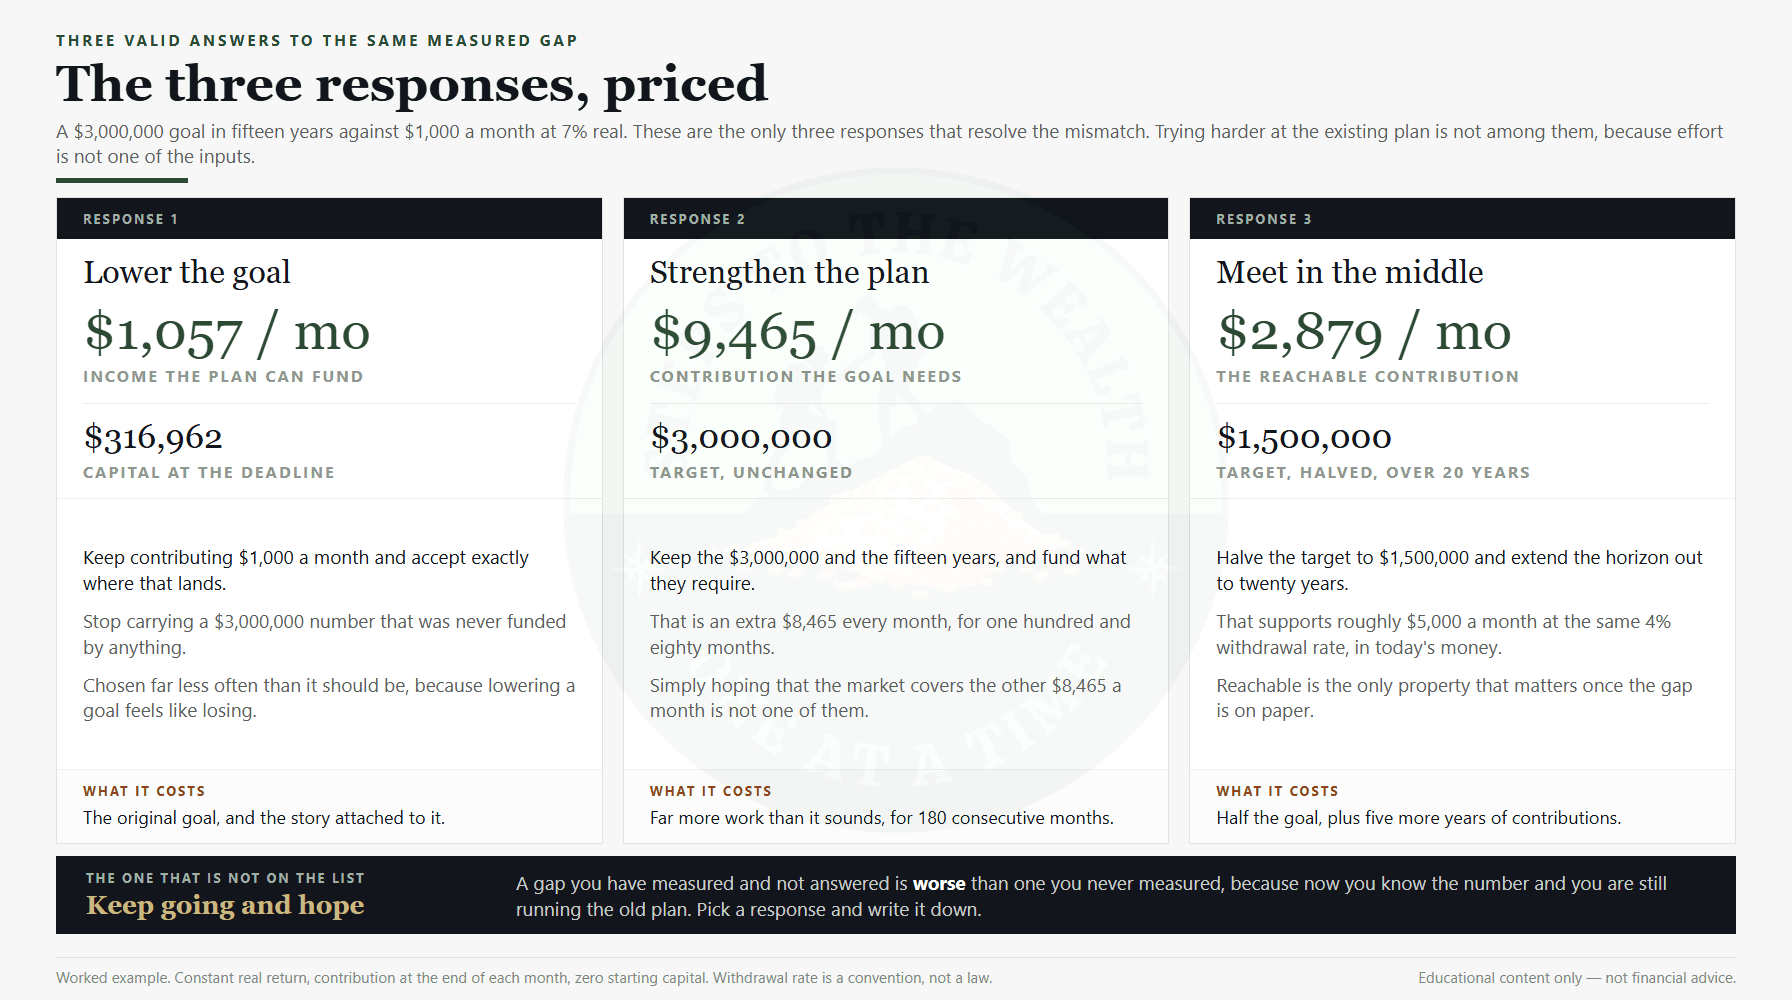
Once the gap is in front of you, there are exactly three valid responses. Not four, and none of them is trying harder at the current plan.
Lower the goal until the plan can deliver it. This is a legitimate answer and it gets chosen far less often than it should. If the honest contribution is $1,000 a month, the honest outcome is $316,962, and about $1,057 a month of income from it. Accept that, stop carrying a $3,000,000 number that was never funded, and run the plan in peace. A plan you will actually keep beats an ambition you will abandon.
Strengthen the plan until it delivers the goal. Also legitimate, and considerably more work than it sounds. It means the income lever at $9,465 a month, or a horizon running to 41.8 years, or some combination that prices out honestly. What it does not mean is keeping the $1,000 and hoping the market covers the other $8,465.
Both, meeting somewhere in the middle. Usually the realistic answer. Halve the target to $1,500,000 and extend the horizon to twenty years, and the required contribution falls to $2,879 a month, supporting about $5,000 a month at the same 4%. Still a real commitment, and a reachable one, which is the only property that matters.
The response is a decision, so write it down. A gap you have measured and not answered is worse than one you never measured, because now you know, and you are still running the old plan.
Run the exercise this week
Reading this changes nothing. The comparison does.
Step one. Write the goal down. A specific number, a specific date, in today’s money. If you cannot name the number, that is the finding, because a goal you cannot state is one you cannot fund.
Step two. Write down what you genuinely contribute now, not what you intend to contribute after the next raise. Use the last three statements, not the plan in your head.
Step three. Project what that actually produces. Use one return assumption on both sides. 7% real for a diversified equity portfolio is a reasonable working figure. Adjust it down if you are heavy in cash or bonds, and do not adjust it up without a reason you could defend to someone else.
Step four. Read the gap, then read the price of all three levers before choosing one. The point of pricing them together is that the expensive-looking lever is often the cheapest one actually available to you.
Step five. Pick a response, write it down, and put it where you will re-read it in eighteen months, when the market is doing something dramatic and the plan feels wrong.
If the answer comes back as response two or three, then the constraint stops being the plan and becomes the person running it, which is what The Operator’s Mindset is built for. If you want the deployment framework that turns contributions into positions through a full cycle, start with the Dynamic DCA Strategy.
A goal plan mismatch is the cheapest expensive problem in wealth-building. It costs an afternoon to measure and years to ignore.
Related reads
- The first $10k, $100k and $1m are different games
- What an average year in the framework looks like
- Retirement savings by age, and why the benchmark misleads
- How to invest while working full time
Educational content only — not financial advice. All figures are worked examples using a constant real return and a contribution made at the end of each month; real markets do not deliver constant returns. Withdrawal rates, tax treatment and account wrappers vary by the jurisdiction in which you live. Past performance does not predict future results.