
Your first market cycle is the one piece of investing education you cannot buy, borrow or read your way into. You can study every drawdown in history and still not know what it does to your decision-making when it is your own money, your own screen, and no known end date. That gap between understanding a cycle and having survived one is the single largest difference between a new investor and an operator.
A cycle, for the purposes of this article, means the round trip: a peak, a meaningful drawdown, a grinding recovery, and a return to a new high. Not a bad quarter. Not a scary week. The full loop, with the part in the middle where nobody can tell you how long it will last, because nobody knows.
What follows is what actually changes on the other side of that loop. Not the mechanics, which are easy to teach and were never the problem. The operator underneath, which is the part that no article can install in advance.
Educational content only. Not financial advice.
What counts as a first market cycle, in practice
The word “cycle” gets used loosely enough to be useless. A 6% pullback is not a cycle. Neither is a flat year. The test is whether you were forced to hold a position through a drawdown deep enough that you seriously considered abandoning your plan, and then held it long enough to see the position recover.
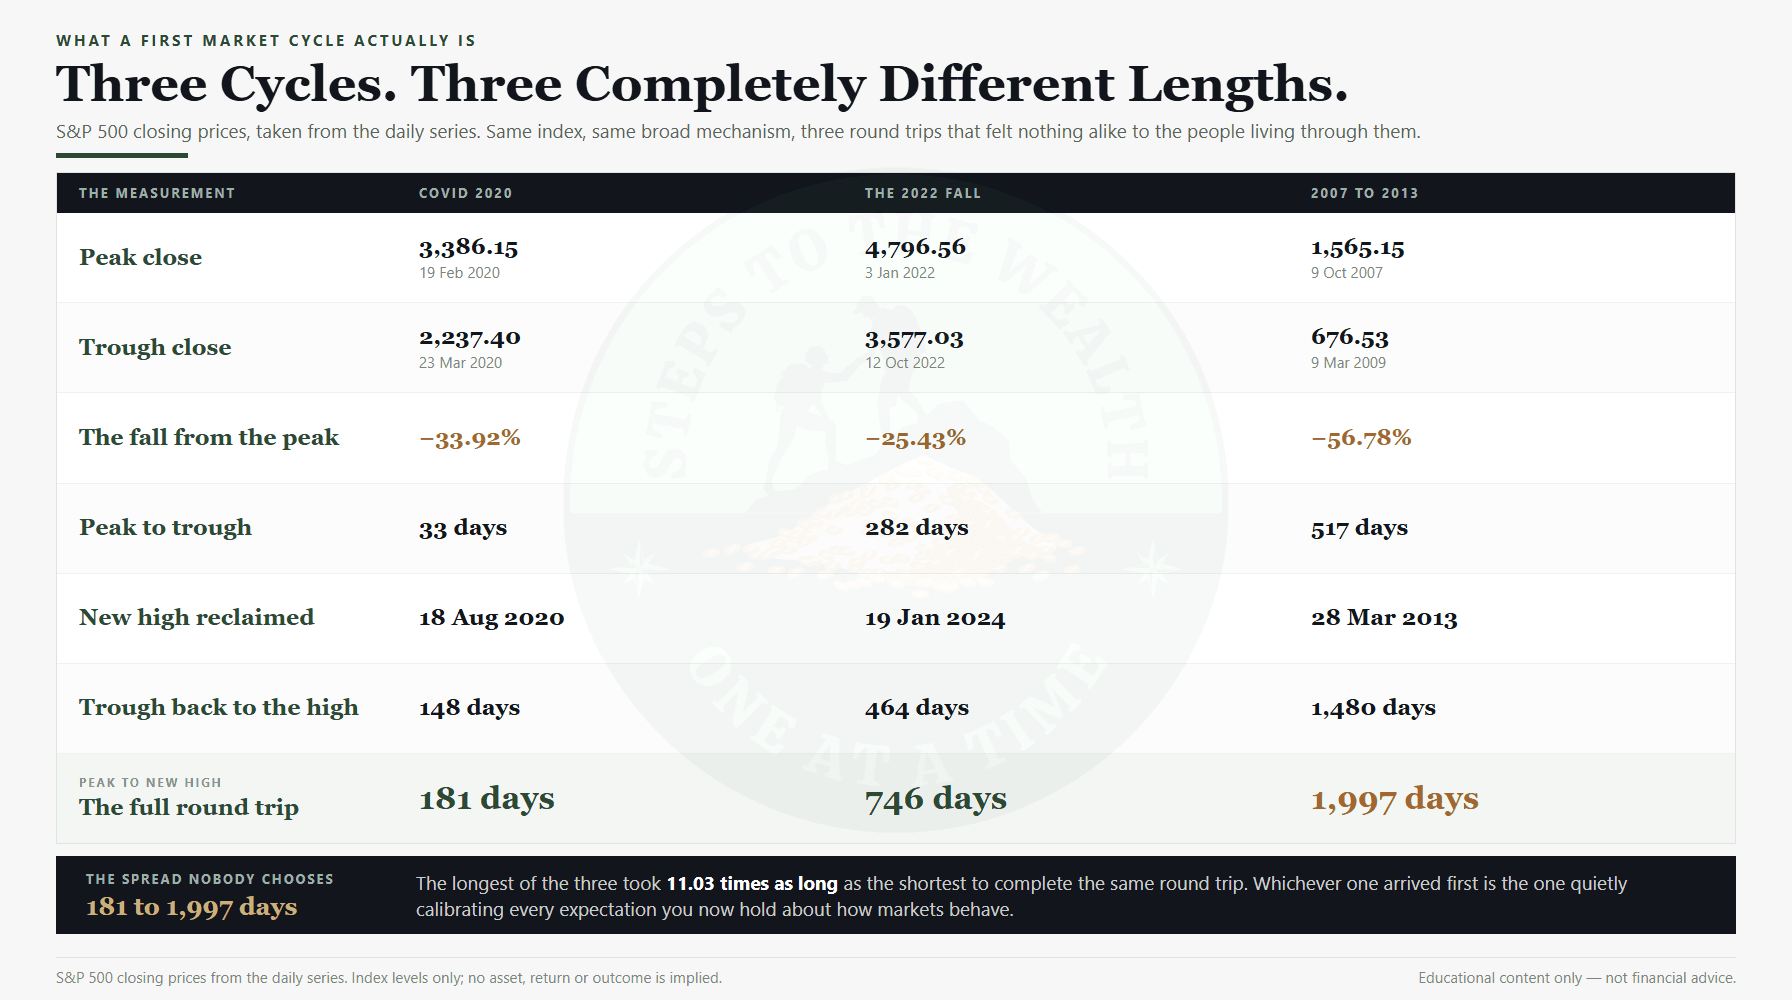
Three completed round trips on the S&P 500 make the point, and they are worth stating precisely because the differences between them are the whole lesson. All figures below are closing prices, pulled from the daily series rather than read off a rounded table.
The 2022 cycle ran from a peak close of 4,796.56 on 3 January 2022 to a trough of 3,577.03 on 12 October 2022 — a fall of 25.43% — and reclaimed the old high on 19 January 2024. Total elapsed time: 746 days, a little over two years.
The COVID cycle was far deeper and far shorter. The index peaked at 3,386.15 on 19 February 2020, fell 33.92% to 2,237.40 by 23 March 2020, and was back at a new high on 18 August 2020. Peak to trough took 33 days. The whole cycle took 181 days. There is a full breakdown of how a systematic buyer experienced that specific window in the COVID crash case study.
The global financial crisis was a different animal entirely. The peak close was 1,565.15 on 9 October 2007. The trough was 676.53 on 9 March 2009, a fall of 56.78%. The index did not reclaim that level until 28 March 2013. Peak to new high: 1,997 days, or roughly five and a half years. The 2008 case study walks through what steady buying looked like across that stretch.
Put those three next to each other and one number matters more than any other: 181 days against 1,997 days. The longest of the three took just over eleven times as long as the shortest. Same index, same country, same broad mechanism, radically different experience.
Which cycle you got was luck, and it shaped you anyway
This is the part that rarely gets said, and it is the most important caveat in the article.
If your first market cycle was COVID, you learned that drawdowns are violent, brief, and rewarded almost immediately. Six months from peak to new high. Anyone who bought the fear was vindicated inside a single calendar year. That is a real lesson, and it is also a dangerously incomplete one.
If your first market cycle was 2007 to 2013, you learned something close to the opposite. You learned that a recovery can take longer than most people stay employed at one job, that the bottom does not announce itself, and that “it always comes back” is a statement about eventual outcomes, not about the next four years of your life.
Both investors will tell you their cycle taught them how markets work. Both are describing one draw from a distribution. The honest position is that you have a sample size of one, and the confidence a first cycle gives you is only partly earned. Knowing that is itself part of the maturation. Crypto compresses the same lesson into a shorter window with deeper falls, which is why a 2021 to 2022 bitcoin drawdown functions as an accelerated version of the same schooling.
If you want to see how your own allocation would have behaved across cycles you did not personally live through, that is precisely what a portfolio stress test and the historical shock replay exist to do. Neither forecasts anything. Both replay what actually happened to a mix like yours, which is the closest thing to borrowed experience available.
Change 1: you stop confusing a high price with a good asset
The most common new-investor error is treating a rising price as confirmation that the asset is sound. The price goes up, the narrative gets louder, and the position gets added to because “it is working.”
After a full cycle, that reflex largely dies. You have now watched something rise for eighteen months, lose the majority of its value in six, and take another two years to get back. Direction stopped being evidence.
What replaces it is more accurate and much less exciting. A rising price means the asset is currently in a favourable phase of a cycle that will eventually rotate. It is not permanently good or permanently broken. It is currently expensive or currently cheap relative to its own range, and where it traded last year tells you very little about next year. Most of the myths that cluster around dollar-cost averaging trace back to this one confusion.
Change 2: you stop trying to find the bottom
First-cycle investors burn an enormous amount of energy trying to identify the exact bottom of a drawdown. They read bear-market commentary obsessively, watch for capitulation signals, and hold cash waiting for the moment.
Most of them miss most of the recovery. The bottom is not identifiable in real time, and by the point it is confirmed in retrospect, prices have already moved well away from it. On the GFC numbers above, waiting for confirmation of the 9 March 2009 low meant waiting while the index put in a large part of its recovery.
What the cycle teaches is what the arithmetic always said: you do not need the bottom. You need to deploy across a range of favourable readings, so that the ladder catches a meaningful part of the low by construction. It will not catch the exact bottom, and that is acceptable, because trying to catch it is the behaviour with the largest expected cost. That cost is not abstract; it is measurable, and what waiting actually costs puts a number on it.
The move from “find the bottom” to “run the ladder” is the most durable single change a first cycle produces.
Change 3: you stop being impressed by whoever called the last move
During any downturn, every feed fills with people who called it. They posted the warning. They were positioned. They are now telling you what happens next.
After a cycle you notice something specific about that population. Most of them called one move correctly out of a long series of attempts. The accounts that called the 2021 top had been calling tops for years. One of the calls eventually landed, and that is the one that gets screenshotted.
The reverse pattern is just as visible. Someone calls a bottom, is right, then calls the bottom of every subsequent dip — most of which are not bottoms, just steps on the way down.
The conclusion is uncomfortable but clean. Predicting the next move is close to a coin flip wearing the costume of expertise. The people whose flip came up heads write the think-pieces. The people whose flip came up tails go quiet, so the survivors look prescient in aggregate. Once you have watched a full cycle of this, you stop shopping for the next prediction and start asking a better question: what does the framework say to do right now? That question, and the risk-first framework behind it, is the whole substitute for forecasting.
Change 4: you can hold cash without it feeling like a loss
This one is badly underrated.
First-cycle investors struggle to hold cash while risk readings are elevated. The cash feels like missed opportunity. Every day the market rises while they are partially in cash registers as a personal error.
After a cycle, the frame changes, because the arithmetic has played out in front of you. The cash held through the expensive stretch was the same cash that deployed into the cheap one, at rung sizes a constantly-fully-invested plan could never have managed. The drag from holding it was real. It was also smaller than what it bought.
Cash stops being missed opportunity and becomes ammunition for the next entry window. That is not a motivational reframe; it is a description of where the return came from. The trade-off between deploying everything at once and deploying across time is set out in the lump sum versus dollar-cost averaging comparison, and the broader question of how much to hold across asset classes is covered well by the SEC’s investor education material on asset allocation.
Change 5: you stop waiting for the favourable window to feel safe
The newer investor expects the bottom to be recognisable. They expect the good entry to arrive with confirmation, and to feel like a decision they can make comfortably.
Every bottom in market history has felt terrifying. The narrative at the March 2009 low was that the financial system itself was failing. The narrative at the March 2020 low was that ordinary economic life was over. In both cases, credible people were on record saying it would get worse, and in both cases the reading that mattered was a price, not a mood.
After a cycle, the operator internalises the rule: the favourable window always feels wrong, and by the time it feels right the price has moved substantially. So you stop waiting for emotional confirmation and execute against the reading instead, including when the reading points into something that looks like a disaster. Without the lived cycle, that instruction is theoretical. With it, it has been tested on you personally.
Change 6: red days stop registering as setbacks
First-cycle investors check daily. Green days feel good, red days feel bad, and because losses land harder than equivalent gains, the net emotional yield of watching a portfolio every day is negative even when the portfolio is doing well.
After a cycle, daily price action reads as noise. The signal is the trend across months and the position in the cycle across years. Practically, most operators stop checking daily entirely. A weekly review becomes the only moment of contact, and red days during the week pass unnoticed because they do not trigger any action the rules did not already anticipate.
The downstream effects are larger than they look. Mental bandwidth at work is not consumed by portfolio anxiety, decision quality elsewhere in life improves, and the whole thing becomes compatible with investing around a full-time job rather than competing with it. Morningstar’s work on behavioural investor types is a useful map of which version of this trap you are personally most exposed to.
Change 7: position sizing finally clicks
Position sizing is the most-taught and least-internalised idea in investing. First-cycle investors hear “size your positions”, agree intellectually, and then size emotionally — overweighting whatever has been working, underweighting whatever has been struggling, and ending up with a portfolio that is a plot of recent sentiment rather than a plan.
After a cycle it clicks structurally, because the abstract risk has been made concrete. You have watched the position that was obviously going to keep running lose most of its value. You have watched the one that was obviously finished recover. And you have watched a correctly sized position survive a severe drawdown without threatening the rest of the book.
Sizing stops being a rule you were told and becomes a defence against a pattern you have personally been through.
The arithmetic your first cycle teaches by force
There is one piece of mathematics that a cycle installs permanently, and it explains why capital preservation is not a timid preference but a structural one.
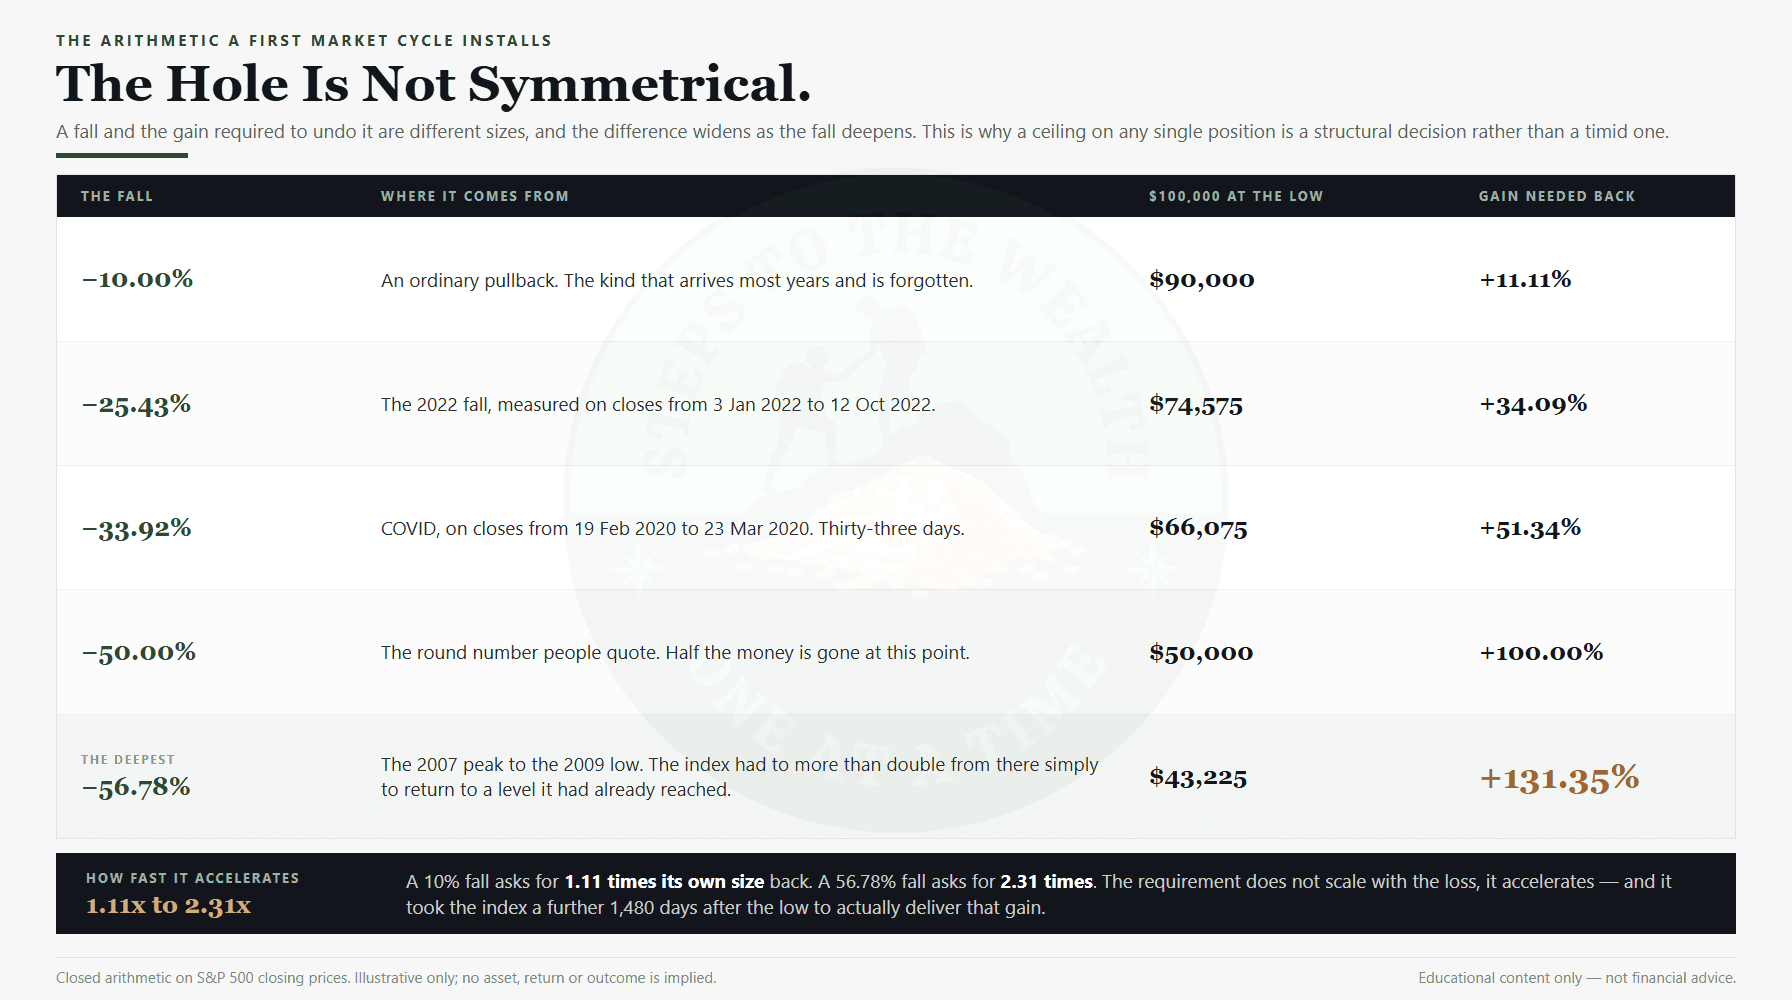
Losses and the gains required to undo them are not symmetric, and the asymmetry accelerates. The 2022 cycle fell 25.43%, which required a 34.09% gain to get back to the old high. The COVID drawdown of 33.92% required 51.34%. The GFC fall of 56.78% required 131.35% — the index had to more than double from the low simply to return to where it had already been.
In money: a $100,000 position tracking the index would have been worth $74,575 at the 2022 low, $66,075 at the COVID low, and $43,225 at the GFC low. Getting the third one back to $100,000 is not a matter of patience alone. It is a demand for a 131.35% gain, which took the index just over four more years to deliver after the low was in.
Read that once as a new investor and it is a fact. Live it once and it becomes the reason you accept a lower ceiling on any single position. If you want to see the same asymmetry applied to your own numbers rather than an index, the DCA simulator runs it directly, and the paid edition extends it across custom portfolios and longer horizons.
What the behaviour is actually worth
The changes above sound like temperament. They are not. They show up in returns, and the size of the effect has been measured.
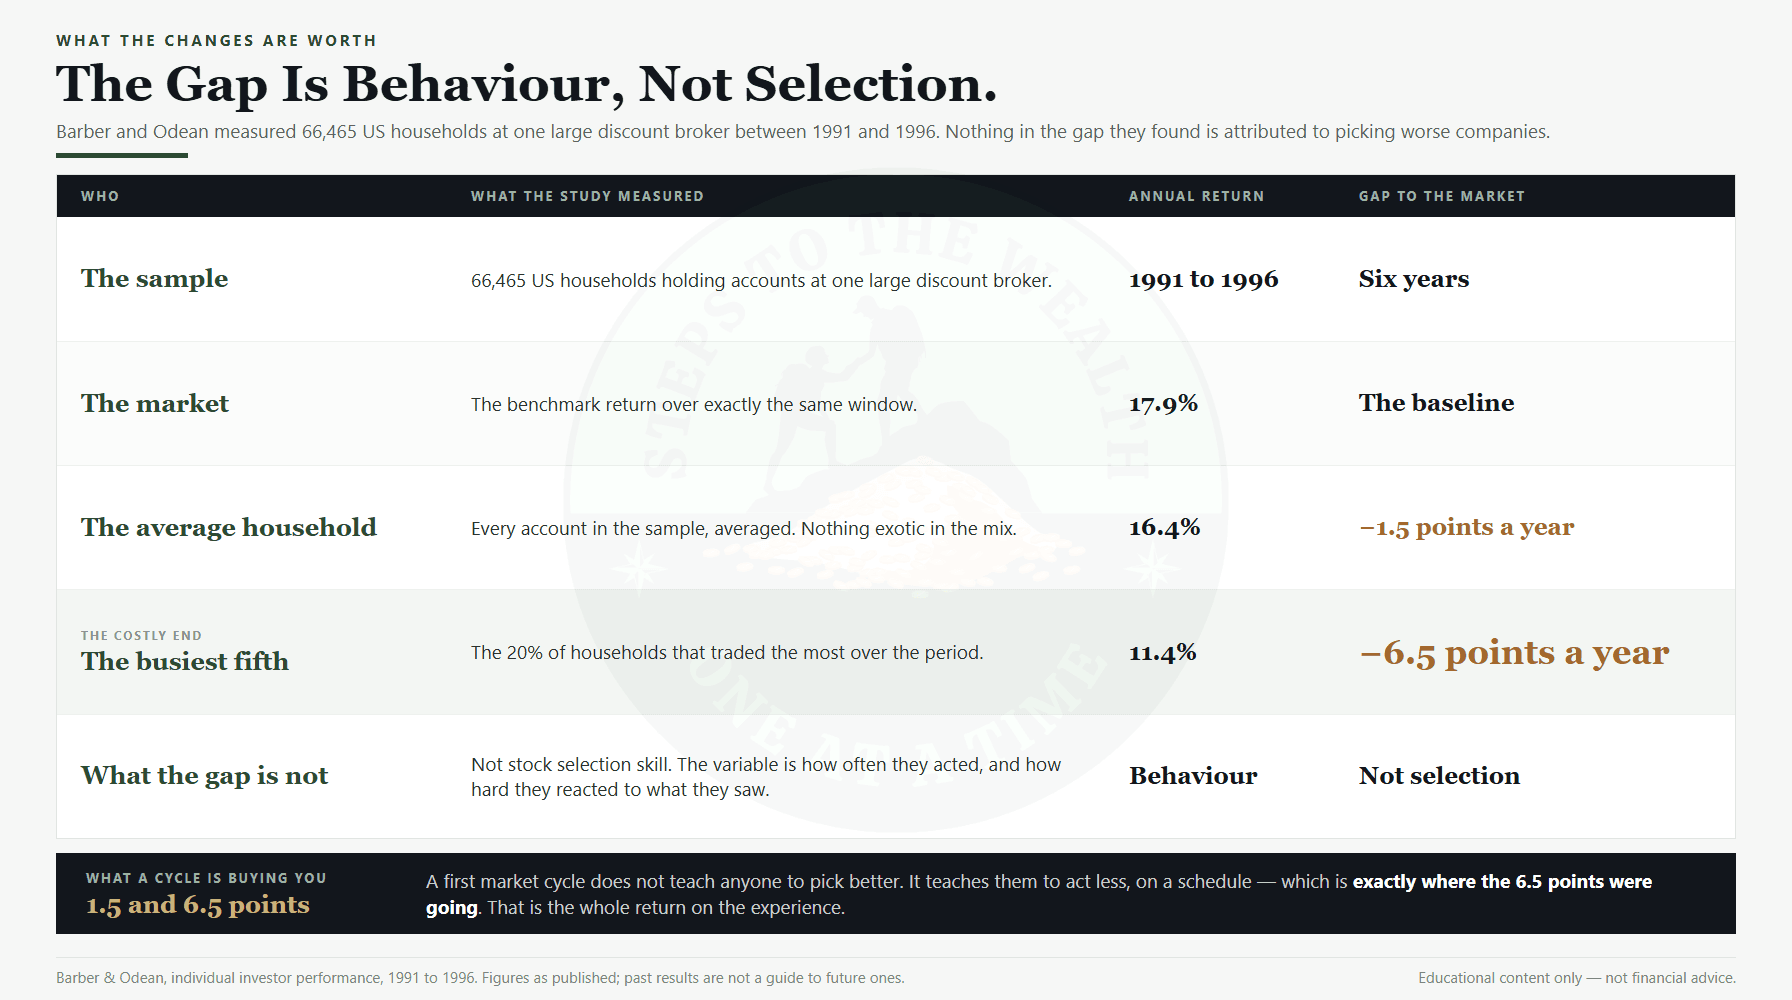
Barber and Odean studied 66,465 US households at a large discount broker between 1991 and 1996. Over that period the market returned 17.9% annually. The average household in the sample returned 16.4%. The most active fifth — the households that traded most — returned 11.4%.
That is a gap of 1.5 percentage points a year for being an average investor rather than the market, and 6.5 percentage points a year for being a busy one. Nothing in that study is about stock selection skill. The gap is behaviour: trading more, reacting more, and being more confident than the evidence supported. The full paper is freely available and worth reading directly rather than through summaries.
A first market cycle is, functionally, the most expensive and most effective course available for closing that gap. It does not teach you to pick better. It teaches you to act less, on a schedule, which is where the 6.5 points were going. If you want a sense of where you currently sit relative to households in a comparable position, the peer benchmarking tool gives a reading, and savings by age gives the broader distribution.
What the second cycle looks like with these installed
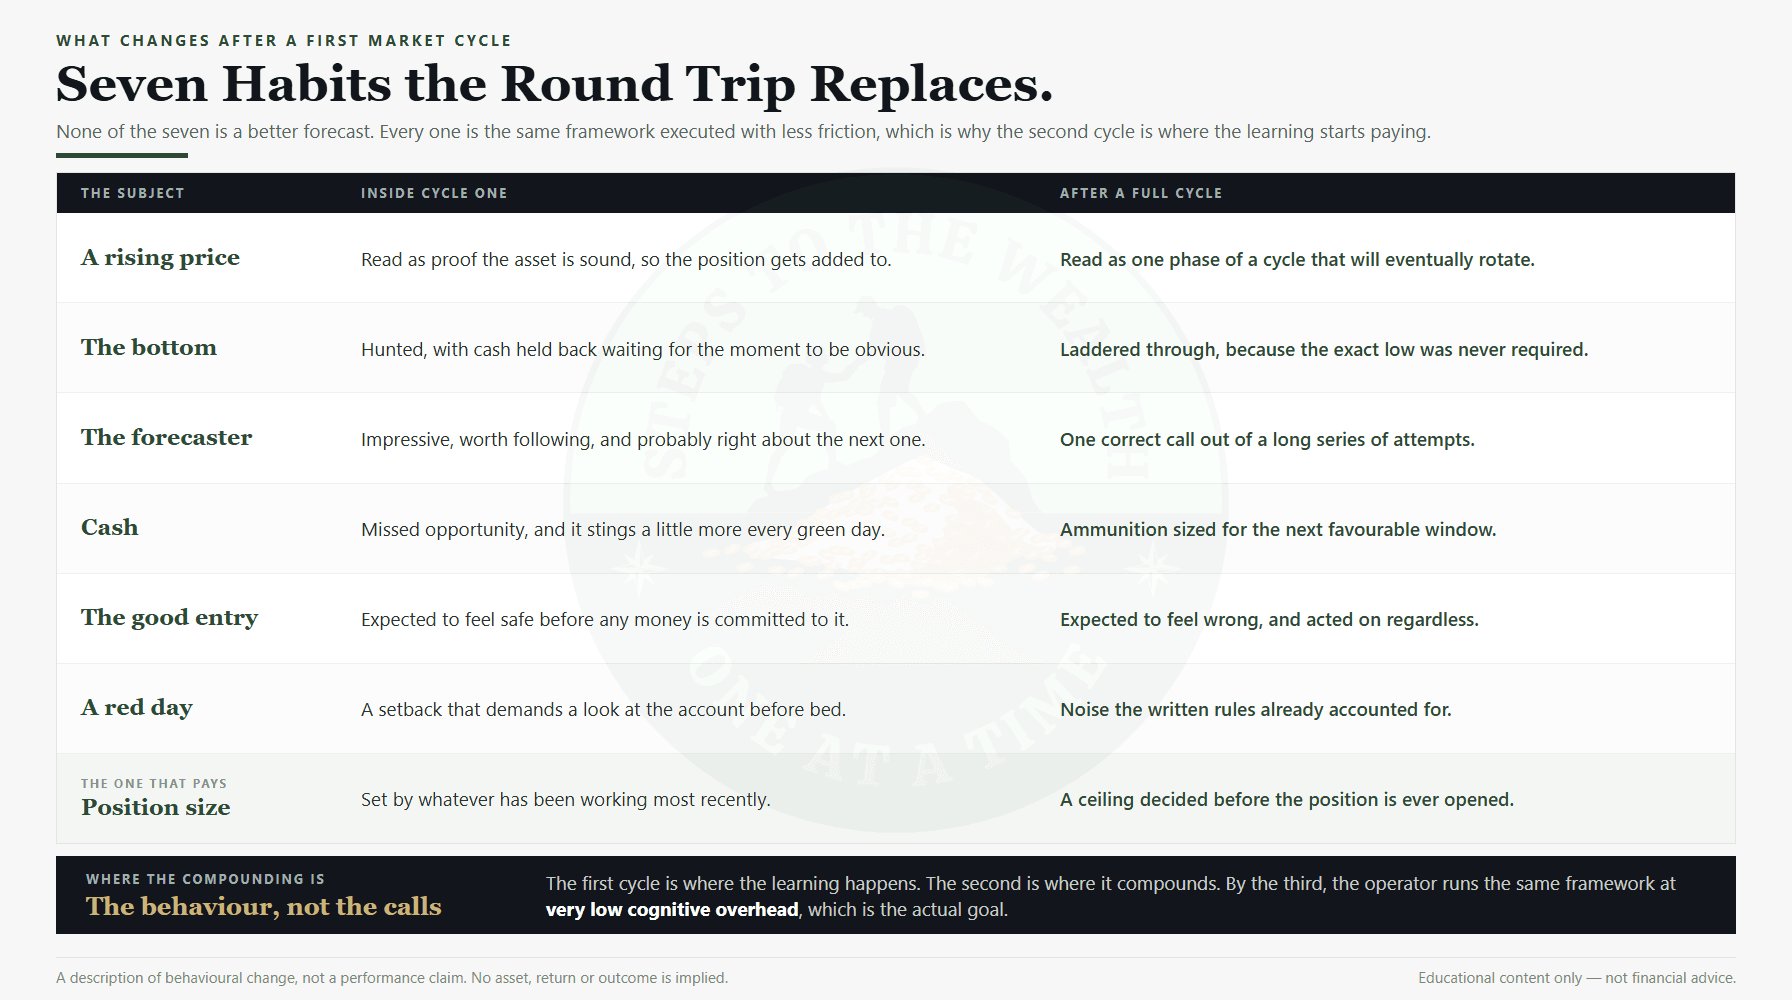
The compounding effect of the seven changes is significant, and it shows up mostly as things that no longer happen.
Deployment at favourable readings is faster and less agonised, because the window is recognisable from experience rather than from theory. Over-allocation at unfavourable readings is smaller, because the sized-ceiling lesson has been paid for. Trimming as risk rises is cleaner, because the resulting cash no longer feels like a mistake. Decision fatigue drops sharply, because the framework runs in the background instead of being re-litigated every week.
The pattern across cycles is consistent. The first cycle is where the learning happens. The second is where the learning compounds into better outcomes. By the third and fourth, the operator is running a refined version of the same framework at very low cognitive overhead, which is the actual goal — not intensity, but a process cheap enough to sustain for decades. The arithmetic of time in the market explains why sustaining it matters more than optimising it.
What a first market cycle does not teach you
An honest article has to include the limits, because the confidence a cycle produces is not uniformly justified.
It does not teach you what a different cycle would have felt like. Your sample is one path. A fast V-shaped recovery and a five-year grind produce very different intuitions, and whichever one you got is now quietly calibrating your expectations for every cycle that follows.
It does not teach you that your framework is correct. Surviving one cycle with a plan intact is weak evidence that the plan is good, because a great many plans survive one cycle. It is strong evidence that you can follow a plan, which is a different and more useful thing to have learned about yourself.
It does not teach you where your own limit is unless you were actually tested. If your allocation was small enough that a 50% fall was an inconvenience rather than a threat, you have not yet learned what you will do under real pressure. That is not a failure. It is worth knowing about yourself before you scale up.
And it does not exempt you from the next one being worse. Nothing in the historical record caps a drawdown at any particular depth. The 56.78% fall on the index is the largest in the modern series, not a ceiling.
If you are still inside cycle one
If you started recently and have not completed a full loop, the goal is not to skip ahead. It is to reach the other side with the framework intact, because the framework is the asset and the returns from a single cycle are mostly noise.
That means a sized ceiling on every position, so that no single drawdown can threaten the plan. It means rules written down in advance for what to do at each risk reading, so that decisions are not made during a panic by a version of you who is not at their best. It means position sizes in volatile assets small enough that a 60% to 70% fall is uncomfortable rather than structurally damaging. And it means a review cadence slow enough that daily prices never demand a response.
If there is a gap between the plan you have written and the trajectory you actually need, the plan gap calculator is the fastest way to see it, and it is better to see it now than to discover it at a low.
Run cycle one without breaking the framework, even with modest returns, and you arrive at cycle two holding the one asset that cannot be bought: the lived experience of having already been through it without panicking. The mathematics compounds. So does the behaviour. That second one is the edge.
If you want the weekly reading and the reasoning behind it, that is what the newsletter is for.
Educational content only. Not financial advice. Market cycles vary in duration, depth and recovery profile, and past cycles do not predict future ones. All index figures above are closing prices for the S&P 500, computed from the daily series. Historical performance is not a guide to future results.