
The question usually arrives wrapped in tribalism. One camp says Bitcoin is the only asset that matters and the index is for people who enjoy losing to inflation slowly. The other says Bitcoin is a mania with a ticker and only a broad index counts as investing. Both are selling an identity, and neither is answering the question.
The useful version of DCA SP500 vs Bitcoin is not which one wins. It is what each one does to a plan you have to actually execute, with your own money, through a drawdown you did not choose the timing of. That question has numbers attached to it, and the numbers are already on this site.
What follows uses two crash records with identical experiment design, then turns the comparison into the only decision that matters.
Why DCA SP500 vs Bitcoin Is Framed Backwards
The framing treats the two as competing answers to one question. They are not the same kind of object, so they cannot be alternatives in the way the framing assumes.
The S&P 500 is roughly 500 large companies inside a system with earnings, regulation, disclosure and a long recovery record. Its drawdowns are severe and its recoveries have historically arrived. Bitcoin is a single, young, global asset with no earnings, priced on adoption, liquidity and sentiment. Its behaviour is closer to a single high-variance position than to a diversified market.
That difference is not a value judgment. It is a structural fact, and it means the concentration thinking you would apply to any single holding applies to Bitcoin, while the market thinking you would apply to an index does not. Treating them as two flavours of the same decision is the first mistake, and every later mistake follows from it.
What the Same $12,000 Did in Each Asset’s Worst Crash
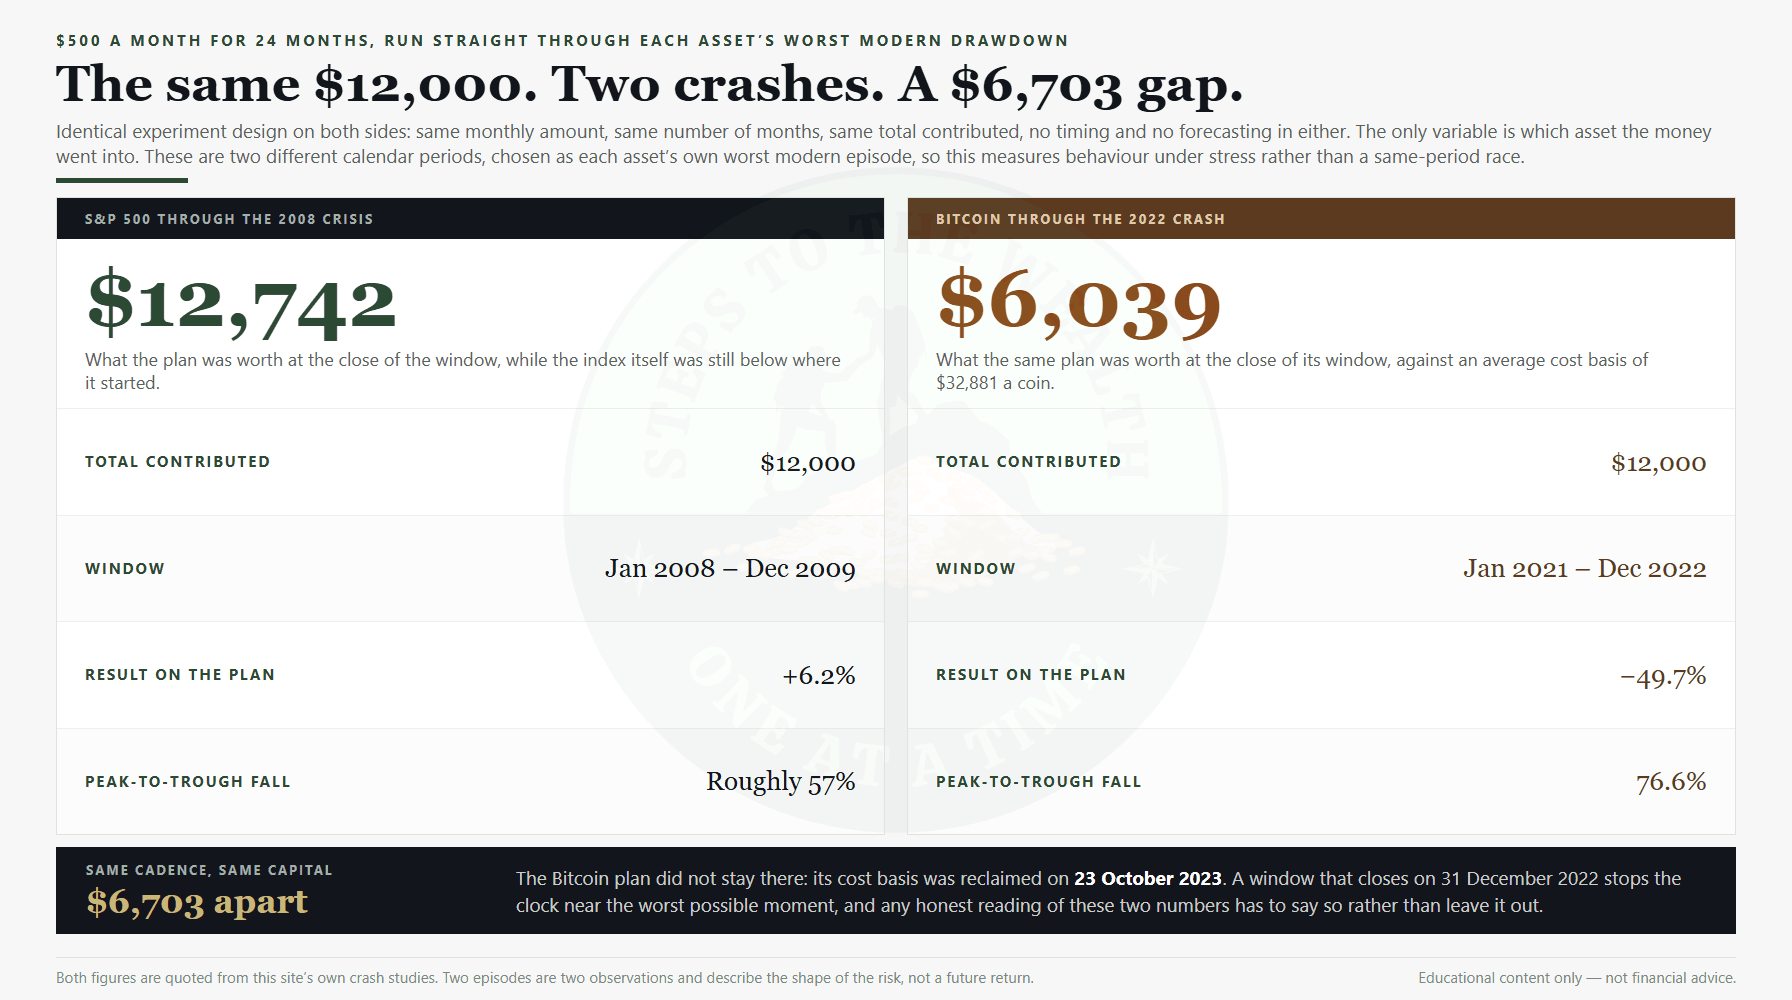
Both of the crash studies on this site use the same design on purpose: $500 a month, twenty-four months, $12,000 of total contributions, run straight through the worst modern drawdown that asset has produced. Same cadence, same capital, no timing.
Into the S&P 500 from January 2008 through December 2009, that plan finished at approximately $12,742 — up roughly 6.2%, while the index itself was still well below where it started. The washout buys in October 2008 and March 2009 did the work. The full record is in DCA through the 2008 financial crisis.
Into Bitcoin from January 2021 through December 2022, the same plan finished at $6,039 — down 49.7%, against a cost basis of $32,881 per coin. The record is in DCA Bitcoin through the 2022 crash.
Identical contributions, identical discipline, a gap of $6,703 at the end of each window. That is the number the tribal version of this argument never puts on the table.
Read That Comparison Honestly, Because It Can Be Abused
Three caveats, and they matter more than the headline.
These are not the same calendar period. Each window is that asset’s own worst modern episode, which is the fairest way to compare stress behaviour but is not a like-for-like market environment. Anyone presenting those two numbers as a same-period race is misleading you, in either direction.
The Bitcoin plan did not stay down. Its average cost basis of $32,881 was reclaimed on 23 October 2023, when Bitcoin closed at $33,086. A window that closes on 31 December 2022 stops the clock at close to the worst possible moment, and the honest framing says so out loud.
And neither record predicts the next cycle. Two crashes are two observations. They tell you about the shape of the risk, not about the return you are owed.
What the Cost Basis Actually Bought You
The Bitcoin plan is worth looking at closely, because it shows both what averaging in achieves and what it does not.
Across those twenty-four months the plan accumulated coins at an average cost of $32,881. Bitcoin peaked at $67,567 and bottomed at $15,787 in the same span, a peak-to-trough range of about 4.3 times. So the plan bought in at roughly 48.7% of the peak price, and at about 2.08 times the eventual bottom.
Read both halves of that. Against the worst case — funding the whole position near the top — averaging in halved the entry price without requiring a single opinion about where the top was. That is real, and it is the strongest honest claim available for DCA into a volatile asset.
Against the best case, it bought in at double the bottom. Averaging in is not accumulation at the lows; it is accumulation across the range, and the range included months when the price was high. Anyone describing DCA as a way to buy the dip is describing something else.
The mechanism is unglamorous: every purchase below the running average pulls the average down, and in that window the 2022 buys below $25,000 did most of that work. No forecast was involved at any point, which is precisely why the result is repeatable in a way that timing is not.
The Drawdowns Are Not the Same Shape
Depth is the number everyone quotes, and it is the less interesting half.
The S&P 500 fell roughly 57% from its October 2007 peak to its March 2009 low, over 517 days. Bitcoin fell 76.6% from its November 2021 peak to its November 2022 low, over 378 days. So Bitcoin fell about twenty points further, in about three-quarters of the time.
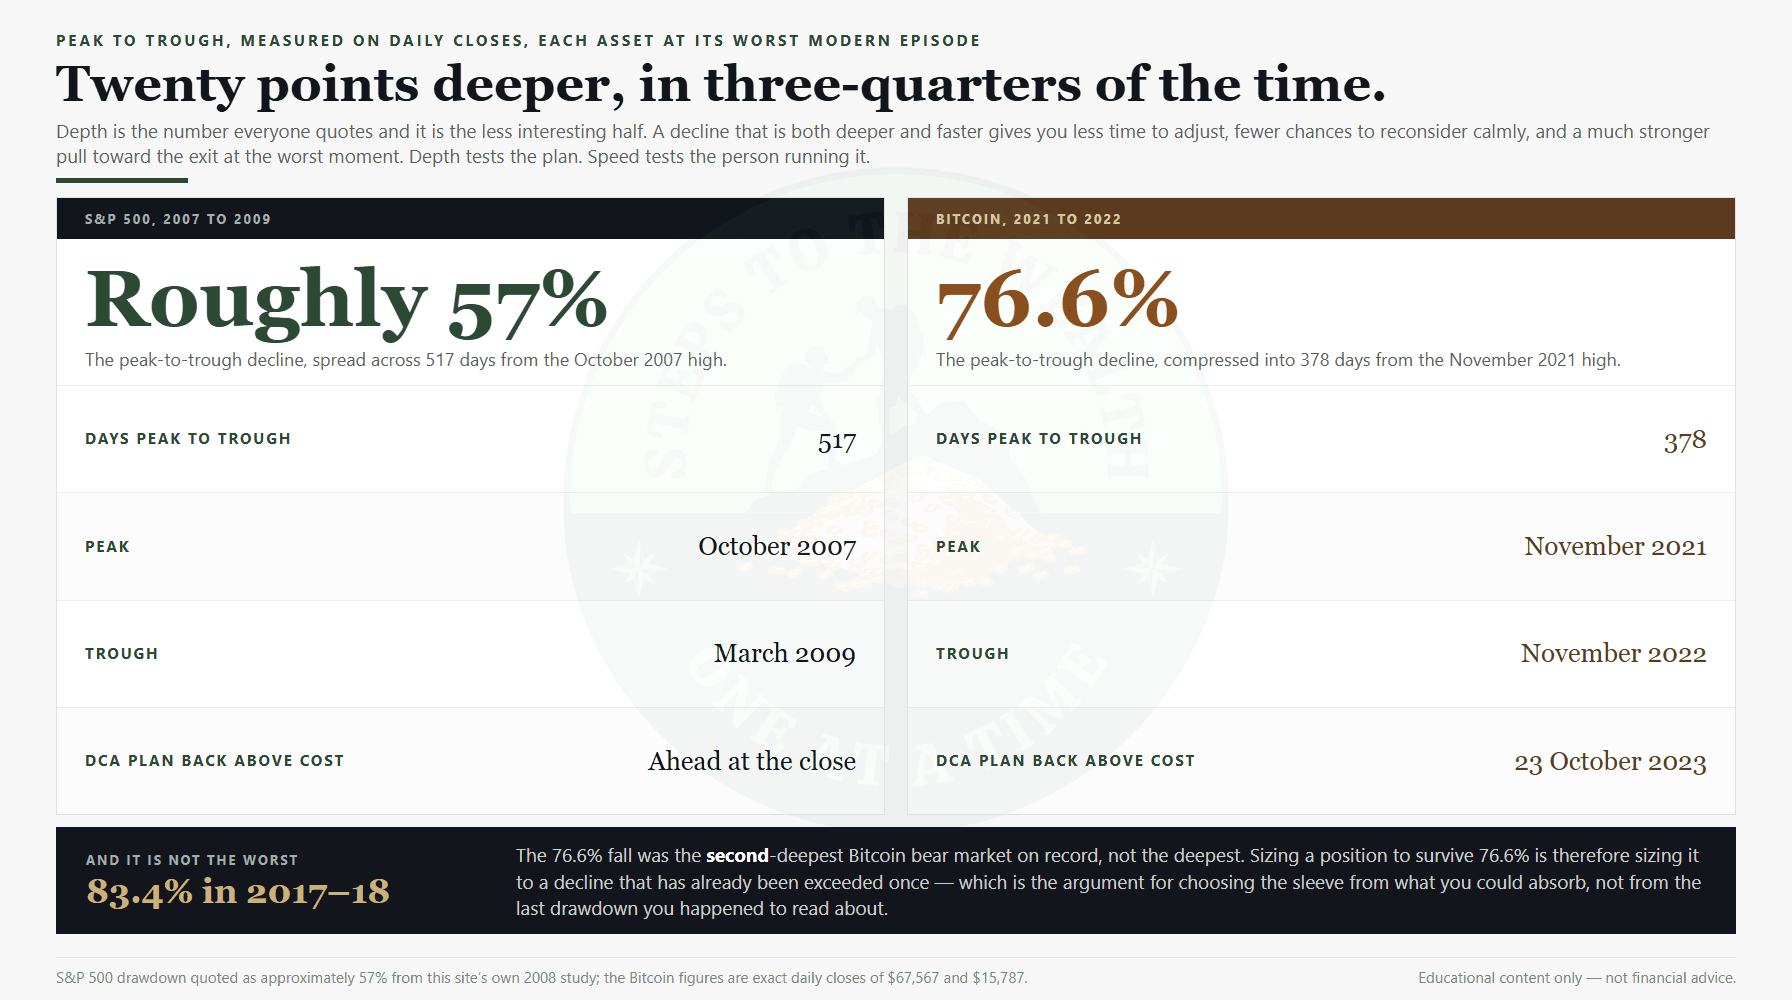
That combination is what makes the two assets feel so different to hold. A faster, deeper decline gives you less time to adjust, fewer chances to reconsider calmly, and a much stronger pull toward the exit at exactly the wrong moment. Depth tests your plan. Speed tests you.
It is also worth noting what the Bitcoin figure is not: it is not a worst case. The 2017–2018 cycle drew down 83.4% close-to-close. The 76.6% episode was the second-deepest on record, not the deepest, which means sizing to 76.6% is sizing to something that has already been exceeded.
Volatility Is Not Risk, and That Cuts Both Ways
The maximalist argument says volatility is the price of the returns and should be ignored. The refusenik argument says volatility is danger and should be avoided. Both are using the word to mean whatever their conclusion needs.
Volatility is how much the price moves. Risk is the chance of permanent loss, and the two only converge when the movement forces a decision you cannot undo — which is the argument made properly in volatility is not risk.
Applied here, that distinction does real work. Bitcoin’s volatility is not automatically risk. It becomes risk at the position size where a 76.6% decline forces you to sell, change your life, or abandon the plan. Below that size it is discomfort. Above it, it is the thing that ends the plan. The asset does not decide which of those you get. The size does.
Timing Skill Was Worth Almost Nothing in One of Them
Both crash studies also report what entry timing was worth on the same $12,000, and the contrast is the most under-discussed number in this whole comparison.
In the S&P window, lump-sum entries ranged from $8,552 at the worst moment to $19,768 at the best — a spread of $11,216, and a best case up almost 65%. Perfect timing was worth a great deal.
In the Bitcoin window, entries ranged from $2,939 to $12,578. The worst case lost three-quarters of the capital, and the best case — buying at the single most favourable moment in the whole two years — finished up 4.8%. Perfect foresight, in that window, bought you almost nothing.
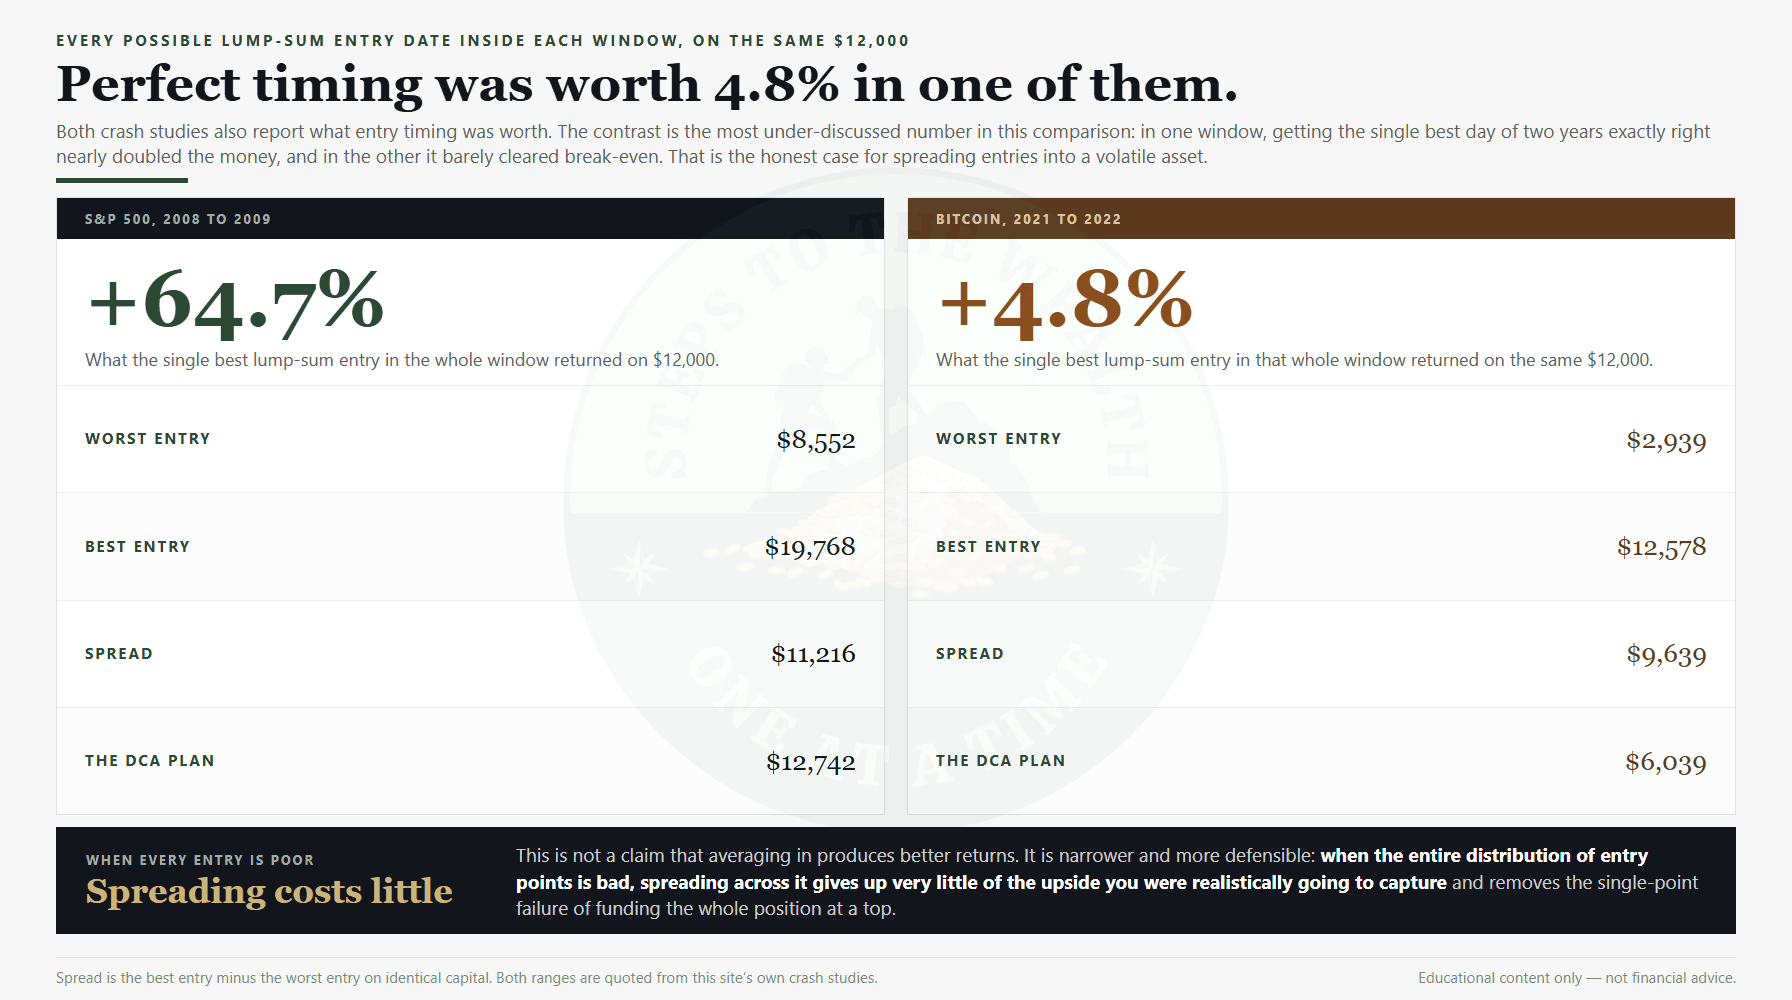
That is the case for DCA into a volatile asset stated without any hand-waving. It is not that averaging in produces better returns. It is that when the entire distribution of entry points is poor, spreading across it costs you very little of the upside you were realistically going to capture, and removes the single-point failure of funding the whole thing at a euphoric top. The general version of that trade-off is in lump sum versus DCA.
Why the Index Plan Beat the Index
The S&P 500 side contains a result that surprises people, and it is worth stating carefully because it is easy to over-read.
The plan finished the two years up roughly 6.2% while the index itself was still below where it started. Nothing clever happened. The contributions that landed in October 2008 and March 2009 bought at prices the index would not revisit, and those buys carried the whole result.
The general principle is that a contribution schedule and an index return are different measurements. The index return asks what one lump of money did between two dates. The plan return asks what twenty-four separate lumps did, each from its own starting point. When the worst prices arrive in the middle of the schedule, the plan can finish ahead of the thing it was buying.
The reverse is equally true and less often mentioned. When the worst prices arrive at the end of a schedule, as they did for Bitcoin in late 2022, the same mechanism works against you: your later and larger cumulative balance is exposed to the lowest prices. That asymmetry is not a flaw in DCA. It is what DCA is, and it is why the choice of asset changes the character of the outcome rather than just its size. Broader allocation guidance from a non-commercial source is worth reading alongside this: the SEC investor education material on asset allocation.
The Decision Is a Sleeve, Not a Side
For nearly everyone, this was never a binary. The real question is how much of each, and that is a sizing decision rather than a loyalty test.
A structure most working professionals can actually live with: the diversified index is the core, the part you are broadly compensated for holding. A high-volatility asset, if you want exposure at all, lives in a deliberately capped sleeve — a percentage you decided in advance you could watch fall by three-quarters without it changing your plans or your sleep.
Price that decision rather than feeling it. On a $100,000 portfolio, applying the verified 76.6% decline to the sleeve alone: a 5% sleeve costs you $3,830, which is 3.83% of the portfolio. A 10% sleeve costs $7,660. A 25% sleeve costs $19,150. Being entirely in it costs $76,600, and no plan built around a working life survives that intact.
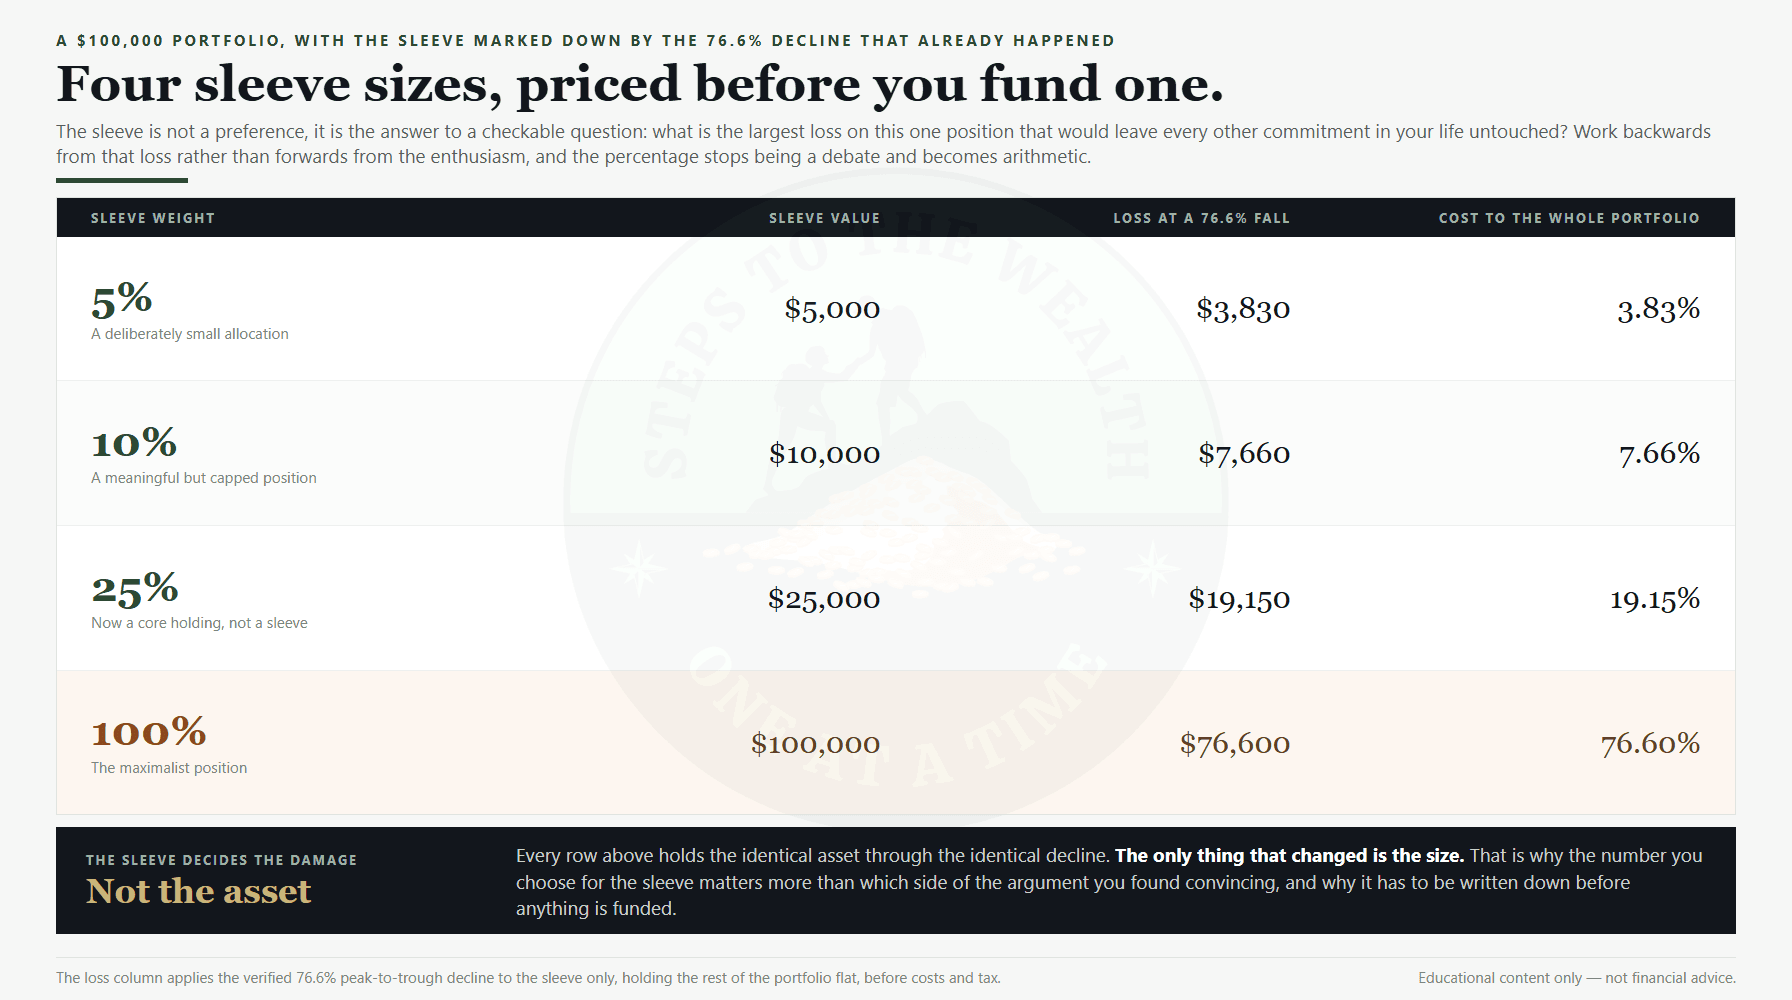
Notice what the sleeve buys. You participate in the upside while pre-deciding the maximum the position is allowed to hurt you. The number you choose there matters more than which asset you argued for, and it is the same discipline set out in the position sizing rules.
How To Choose the Sleeve Number Honestly
The sleeve is not a preference. It is the answer to a question with a checkable form: what is the largest loss on this position that would leave every other commitment in your life untouched?
Work backwards from the loss, not forwards from the enthusiasm. If a $4,000 hit is genuinely absorbable and a $10,000 hit is not, then at a 76.6% decline your sleeve is about $5,000 and not $13,000. That is arithmetic, and it does not care how convinced you are.
Then apply the same test the rest of the portfolio gets. A position that has run hard stops being the position you sized, which is the point at which a cap has to be enforced rather than admired — the mechanics of that are in when to take profits.
And write the number down before you fund anything. A sleeve decided while the asset is running is not a sleeve; it is a mood with a percentage attached. The general case for deciding in advance is in rules-based investing.
What DCA Actually Does to Each One
Into a relatively steady index, dollar-cost averaging mostly smooths your entry. That is useful, and it is modest, because the asset is not going to swing violently between your buys.
Into something as volatile as Bitcoin, regular buying across a full cycle is doing considerably more work. It stops you funding the whole position at a top, and it keeps you accumulating through the part of the cycle where nobody wants to. That is the mechanism, and the $32,881 cost basis against a $67,567 peak is what it looks like when it works.
The flip side is the part the enthusiasts skip. The same volatility is exactly what makes a fixed schedule into a volatile asset so hard to sustain. Buying the same amount every month straight through a 76.6% decline is the textbook scenario in which people quit at the bottom, and a plan you abandon has a return of whatever you got when you abandoned it. The risk-aware alternative — sizing each buy from a risk reading rather than a calendar — is set out in the dynamic DCA strategy.
The Costs Are Not Symmetrical Either
One asymmetry gets left out of almost every version of this comparison, and it is not about returns.
Holding a broad index fund is an ordinary, boring arrangement. There is an expense ratio, it is disclosed, it is small at the low-cost end, and the custody question is answered by a regulated intermediary whose failure modes are well understood and largely insured against.
Holding Bitcoin asks you to answer the custody question yourself. Either a third party holds it, in which case you have taken on that party’s solvency as a risk — and the 2022 window is precisely the period in which several such parties failed — or you hold it directly, in which case operational mistakes are permanent in a way that a brokerage error is not. Neither option is wrong. Both are a category of risk the index simply does not ask you to price.
This belongs in the sizing decision rather than in the asset argument. A position that carries an additional, non-market way to go to zero deserves a smaller sleeve than one that does not, independently of what you think the price will do.
Four Questions Before You Fund Either
- Could you hold it through a 76.6% decline without selling? For Bitcoin this is not hypothetical; it has happened, and worse has happened. If a drop that size would make you capitulate, the position is too large. That is the answer, and it does not require a view on the asset.
- Are you buying the asset, or the story about it? Conviction built from understanding the risk and conviction built from a community that has already decided feel identical from the inside. Only one survives a drawdown.
- What would have to be true for you to be wrong? If you cannot answer that for either holding, you do not have a thesis, you have a position. Those are different things and they fail differently.
- Does this change what you contribute? If funding the sleeve means reducing what goes into the core, you are not adding exposure, you are swapping it. That is a real decision and it should be made deliberately rather than discovered later.
Where Diversification Does and Does Not Help
A common defence of a large volatile sleeve is that it diversifies the portfolio. Sometimes true, frequently overstated.
Diversification protects against a single holding’s permanent failure. It does not smooth every decline, and correlations between risk assets have a habit of rising in exactly the weeks you were relying on them not to. Holding two things that both fall hard in a liquidity event is not diversification, it is two positions. That distinction is worked through in how diversification reduces risk.
The honest version: a capped sleeve in a volatile asset is a bet on that asset, sized so that being wrong is survivable. Calling it diversification usually means the sleeve is larger than the argument for it.
Test the Pairing Instead of Arguing About It
Every number above is a historical record, not a projection, and the useful thing to do with a record is run your own version of it.
A plan you have tested against a real drawdown is a different object from a plan you have imagined. Pick a sleeve percentage, replay it through both windows, and see what the combined portfolio actually did to your total. The DCA simulator runs plans against actual price history, and the method for setting one up properly is in how to backtest a DCA plan.
What you are testing for is not the highest ending number. It is the largest interim drawdown you would have had to sit through, because that is the number that decides whether you were still holding at the end.
The Limits of Both Records
Three things this comparison cannot do.
It cannot tell you what either asset returns next. Two crash windows describe how each behaved under stress in one episode each. Bitcoin has a fifteen-year record and the S&P 500 has a century of equity-market history behind it; those are different evidentiary positions, and the shorter one carries genuinely more uncertainty about whether past behaviour generalises.
It cannot set your sleeve for you. The 5% and 10% figures above are illustrations of a method, not recommendations. The right number depends on your income stability, your horizon and what else the portfolio has to fund, none of which a general article knows.
And it cannot make the choice feel settled. It will not. The point of sizing the position rather than picking a side is that you no longer need certainty in order to act — you need a number small enough that being wrong is survivable, and a rule that tells you what to do when it moves.
That is the whole answer. Not which asset wins, but how much of the volatile one you can hold without the plan depending on it.
Educational content only — not financial advice. Nothing here is a recommendation to buy or sell any specific asset. Historical results describe single episodes and do not predict future returns.