
Educational content only — not financial advice.
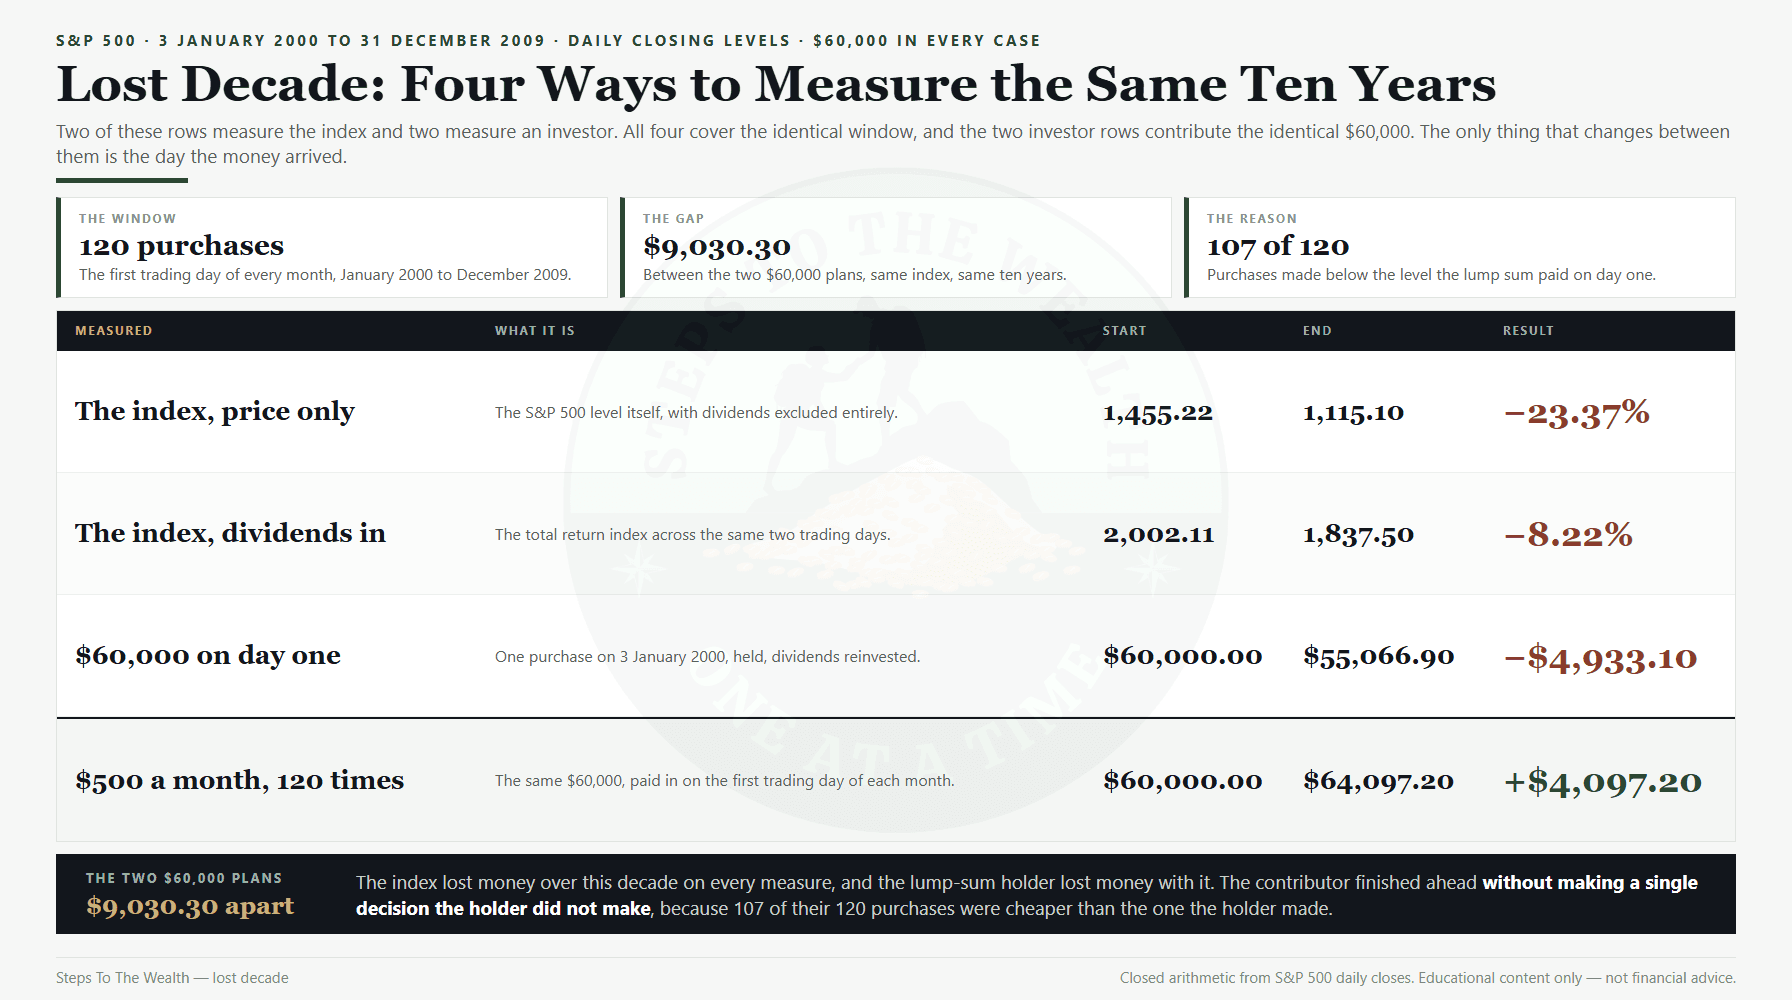
Somebody will eventually show you the chart. The S&P 500 opened the year 2000 at 1,455.22 and closed out 2009 at 1,115.10. Ten years of showing up, ten years of headlines, and the index finished 23.37% lower than it started. That is the lost decade, and it is the single most effective argument ever made against long-horizon investing, because the number is real and it is not spun.
What almost nobody does is ask the obvious follow-up question. That −23.37% is the return on one purchase, made on the first day, and never touched again. Nobody invests like that. If you were contributing to a plan every month through those ten years, you did not earn the index’s return. You earned a different number, built from 120 separate purchases at 120 different prices, and the gap between the two is not a rounding error.
This article puts the actual figure on it. Same index, same decade, same money — measured the way a working professional’s plan is actually funded. Then it does the harder half: the three specific things that break the result, the worst developed-market decade on record as a stress test, and the one situation where a lost decade genuinely does ruin a plan.
What the lost decade number actually measures
Every figure in this article comes from daily closing levels of the S&P 500 price index and the S&P 500 total return index, over the window 3 January 2000 to 31 December 2009 — the first and last trading days of the decade. Nothing is modelled and nothing is projected. The plan is deliberately dull: $500 on the first trading day of every month, 120 payments, $60,000 in total, dividends reinvested, no timing decisions of any kind.
Start with the two versions of the index itself. On price alone, the S&P 500 fell 23.37% over those ten years, a compound rate of −2.63% a year. With dividends reinvested, the same decade returned −8.22% in total, or −0.85% a year. That is the honest ceiling: even counting every dividend, the decade was negative. This is not a case where the scary number turns out to be a measurement error.
So the lump sum is easy to price. Sixty thousand dollars invested on 3 January 2000, dividends reinvested, and left completely alone, was worth $55,066.90 on 31 December 2009. Ten years, no mistakes, no panic selling, and $4,933.10 gone. Anybody telling you that patience alone always pays is not describing this decade.
The same decade, paid for in 120 pieces
Now fund the identical $60,000 the way an actual salary funds a plan. Five hundred dollars goes in on the first trading day of each month, from January 2000 through December 2009. Same index, same dividends, same end date, same total contributed. The account was worth $64,097.20 on 31 December 2009.
That is $4,097.20 more than went in, a gain of 6.83% on money contributed, against a lump sum that lost $4,933.10 over the identical window. The two results are $9,030.30 apart on the same $60,000, in the same index, over the same ten years. The only difference between them is when the money arrived.
Be careful how you read the 6.83%, though, because it is not an annual return. Money contributed in December 2009 had four weeks to work; money contributed in January 2000 had ten years. Weighting each dollar by the time it was actually invested gives a money-weighted return of about 1.30% a year. That is a poor decade by any standard. It is also comfortably better than zero, in a decade whose entire reputation is that it paid nothing.
Where the difference actually comes from
The mechanism is not clever and it is not a trick. It is arithmetic about your cost basis, and it is worth stating precisely rather than hand-waving at “buying the dip”.
Of the 120 monthly purchases, 107 were made at an index level below the level on the first day. Not below some later peak — below the price the lump-sum investor paid on 3 January 2000. The average level paid across all 120 contributions was 14.09% under that opening level. The cheapest purchase landed on 2 March 2009, with the S&P 500 at 700.82, which is 51.8% below where the decade started.
That is the whole engine. A flat or falling market does not hurt the contributor the way it hurts the holder, because a falling market is where the contributor’s shares are bought. The lump-sum investor got one price, and it happened to be near the top of a bubble. The contributor got 120 prices, and the decade’s misery pushed most of them down. This is the same structural point behind the myths that surround dollar-cost averaging — the mechanism is real, but it is real for a much narrower reason than the marketing suggests.
One clarification, because the phrase gets used two ways. A “lost decade” here means a market-wide decade that ends roughly where it began. It is a different thing from the ten years a single concentrated holding can take to recover, which is a position-sizing problem covered in the rules for sizing a position. Diversified index exposure and one bad ticker fail in completely different ways.
Ten years, one row at a time
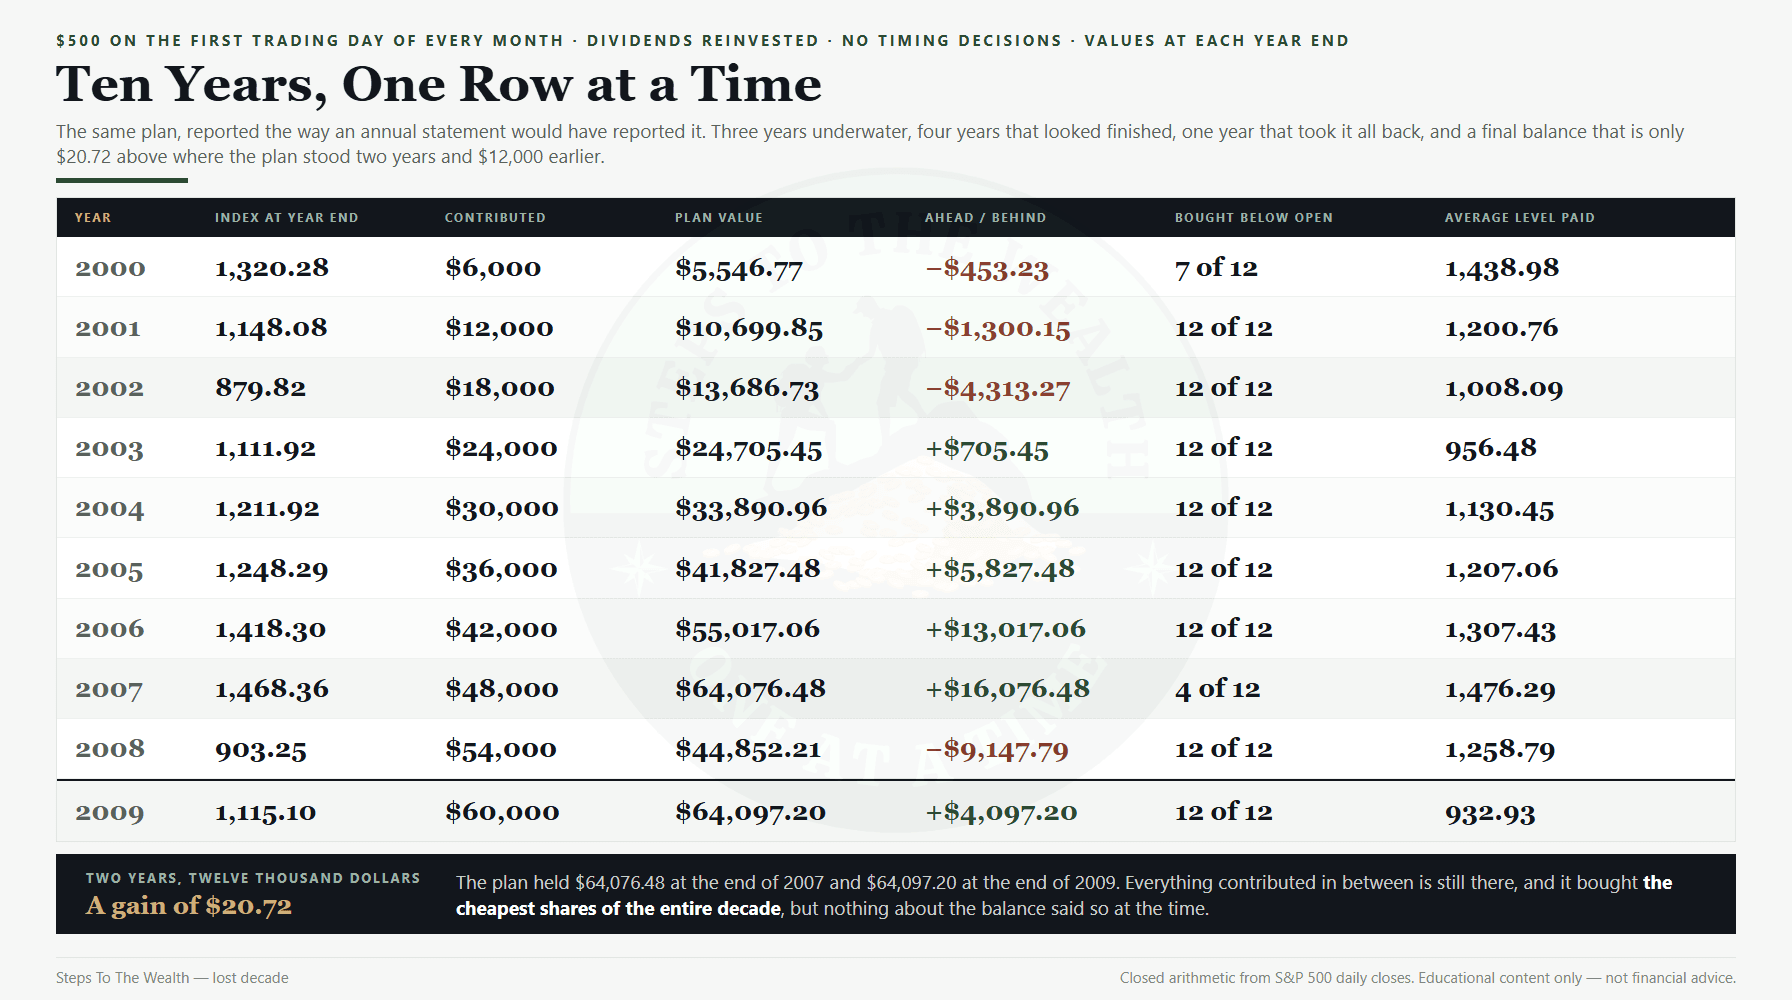
The end result is tidy. Living through it was not. For the first three years the plan was underwater and getting worse: down 7.55% at the end of 2000, down 10.83% at the end of 2001, and down 23.96% at the end of 2002, with $18,000 contributed and $13,686.73 to show for it. Three consecutive annual statements, each one worse than the last, on a plan that was doing exactly what it was designed to do.
Then the recovery arrived and the position looked excellent. By the end of 2007 the account held $64,076.48 against $48,000 contributed — ahead by more than sixteen thousand dollars, up 33.49%. This is the point at which most plans get congratulated and quietly abandoned, because the job appears to be finished.
And then 2008 took it back. The year closed at $44,852.21 on $54,000 contributed, down 16.94%, which erased four years of visible progress in twelve months.
Here is the detail worth sitting with. At the end of 2007 the plan was worth $64,076.48. At the end of 2009, after two more years and another $12,000 of contributions, it was worth $64,097.20. Two years and twelve thousand dollars bought a gain of $20.72. That is what the flat decade actually felt like from the inside, and no summary statistic conveys it.
The three things that break the result
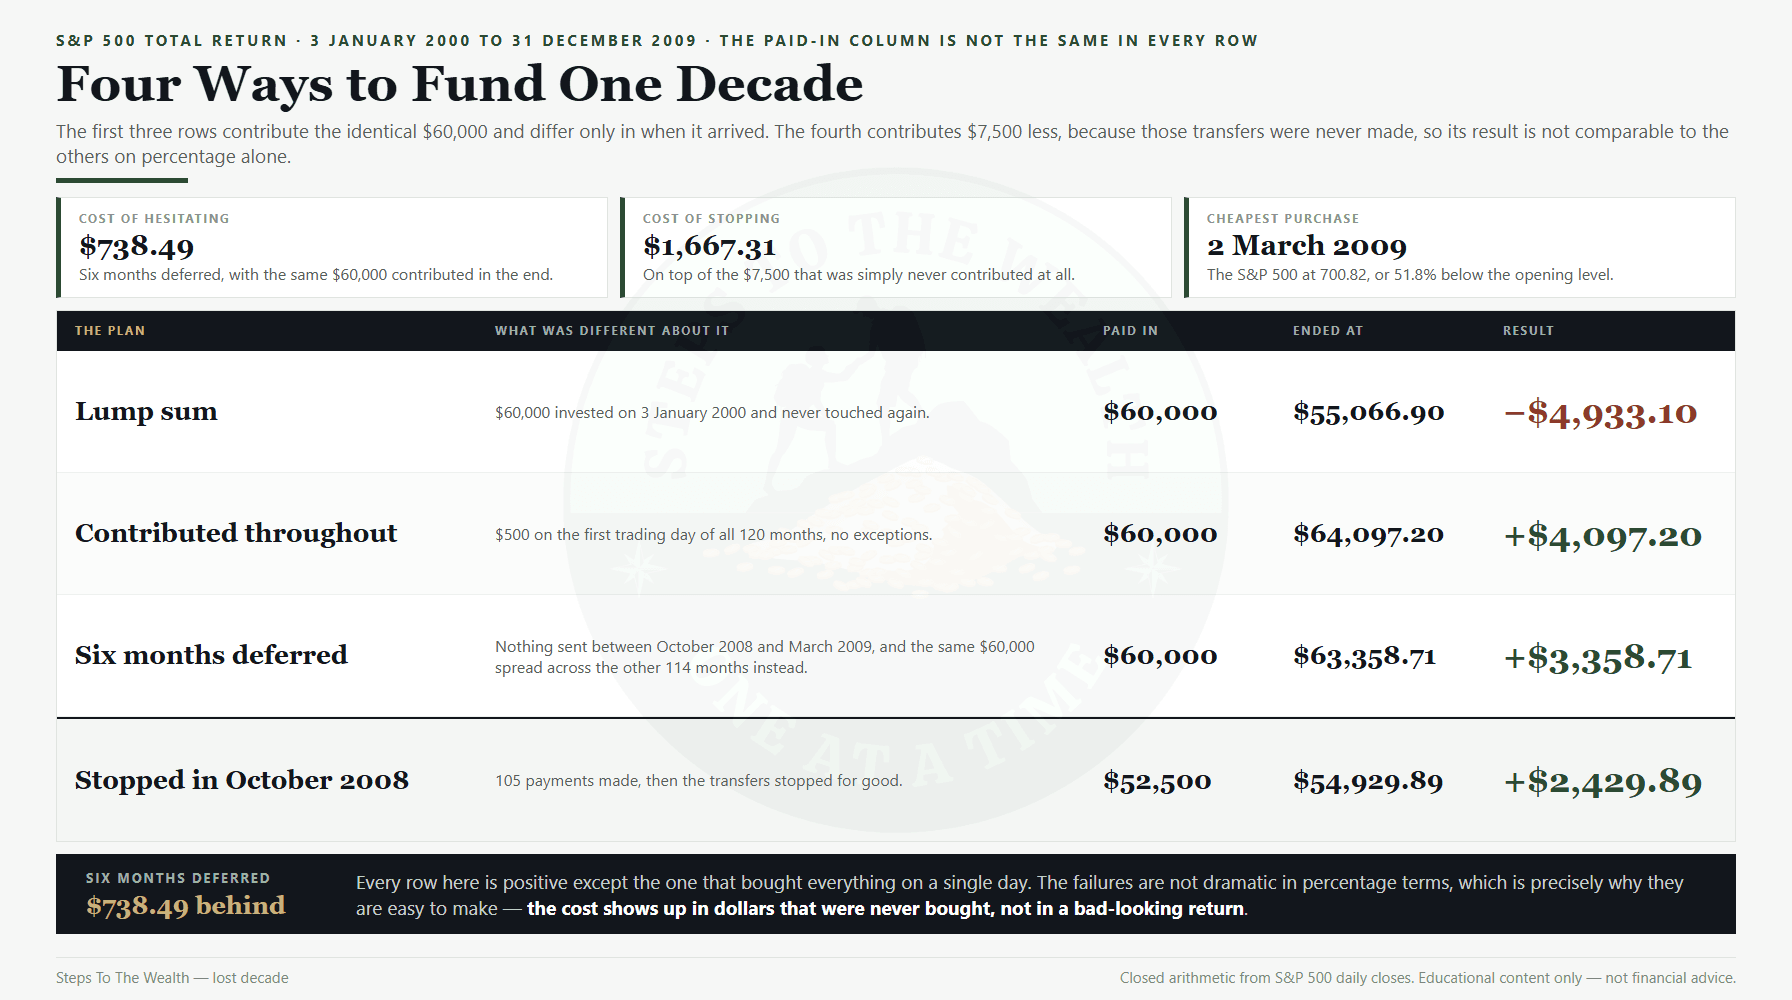
None of the above is an argument that contributing is magic. The +6.83% result is contingent on behaviour, and it is worth pricing exactly what the failures cost, because “stay the course” is advice with no number attached to it.
Skipping the frightening months. Take the same investor with the same $60,000, who simply cannot bring themselves to transfer money between October 2008 and March 2009, and spreads that money across the other 114 months instead. Same total contributed, same decade, one behavioural difference. The result is $63,358.71, which is $738.49 behind. Six months of hesitation, on money that was still fully invested elsewhere in the plan, cost about 1.2% of the final balance.
Stopping for good. The heavier failure is the one where the transfers never restart. An investor who contributed for 105 months and stopped in October 2008 put in $52,500 and finished with $54,929.89. The percentage still looks positive, which is exactly the trap — the plan is $9,167.31 smaller in dollars, and the missing months were the cheapest shares of the entire decade.
Selling. There is no arithmetic to run for the third failure, because selling into the March 2009 low converts a temporary quotation into a permanent result. The recovery mechanics of that decision are covered separately in what recovering from a large loss actually requires. What matters here is that all three failures happen at the same moment, for the same reason, and the moment is always the one where the contributions are worth most.
The worst decade on record is Japan, and it is not a rebuttal
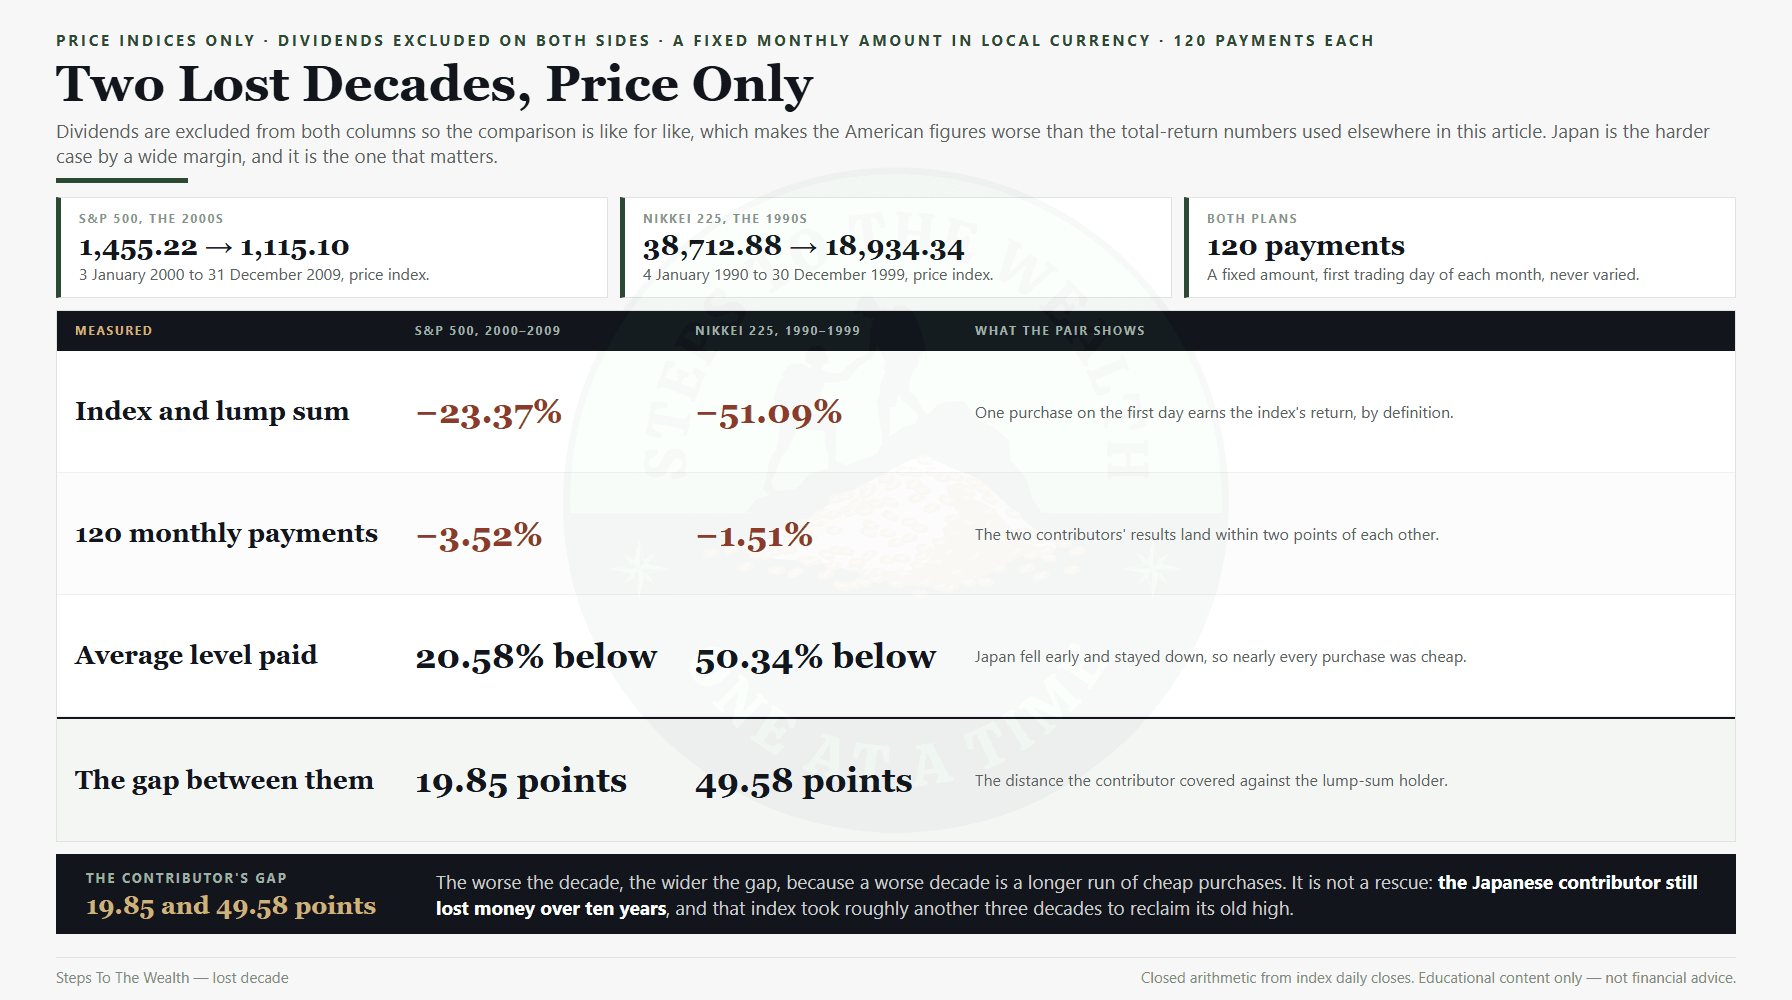
A fair objection at this point is that the American 2000s recovered, and that a genuinely broken market would produce a different answer. The obvious test case is Japan. The Nikkei 225 opened 1990 at 38,712.88 and closed 1999 at 18,934.34 — down 51.09%, a compound rate of −6.91% a year, and it would be another two decades before that index saw its old high again.
To compare like with like, both runs below exclude dividends, because a Japanese total-return series is not on the same footing as the American one. On price alone, the American 2000s cost a lump-sum investor 23.37% and cost the 120-payment contributor 3.52%. Over the Japanese 1990s, in yen, the identical fixed monthly plan lost 1.51%, while the lump sum lost 51.09%.
Read that carefully, because the tempting conclusion is wrong. The contributor did not do well in Japan; they lost money over ten years. What the two runs show is that the endpoint of a decade tells you very little about what a funded plan earned inside it. Japan fell early and stayed down, so almost every purchase was cheap. America fell late, which meant five years of contributions at elevated prices before the 2008 discount arrived. Same nominal story, different shapes, and the shape is what the contributor is actually exposed to.
It also has an obvious limit. Contributing converted a 51% catastrophe into a 1.5% loss; it did not manufacture a gain, and it never will if the market does not eventually recover. A Japanese investor who began in 1990 waited about 34 years to see the index’s old peak. That is a real risk and it argues for owning more than one country’s market, which is the whole subject of what home-country bias quietly costs.
Who a lost decade genuinely ruins
Everything above holds for someone still contributing. Invert the cash flow and the conclusion inverts with it, and this is the part that deserves no spin at all.
If you are drawing money out rather than putting it in, a flat decade is not neutral and it is not survivable by patience. Every withdrawal during a depressed stretch sells units that never come back, so a bad opening decade permanently shrinks the base that the rest of the plan compounds on. That is sequence-of-returns risk, and the same ten years of index performance that quietly helped the accumulator can end the retiree’s plan outright.
There is a middle case too, and it is the one most readers here will eventually occupy: the person with a large balance and shrinking contributions. Once the portfolio is big relative to the annual deposit, new money stops being able to move the cost basis, and you are closer to the lump-sum investor’s position than the contributor’s. The protective effect described in this article decays quietly as the balance grows, and nothing announces when it has gone.
What a risk-first framework does differently
A fixed monthly contribution is the passive version of this. It works because it is mechanical, and its weakness is that it treats every price as equally attractive — it bought at 1,455 in January 2000 with exactly the same enthusiasm as it bought at 700 in March 2009.
A dynamic DCA framework keeps the mechanical part and adds one input: the current market risk reading. When risk is high you slow or stop deploying and let cash accumulate; when risk is low you deploy faster and larger. Across a decade like 2000–2009 that is not a subtle adjustment, because the risk readings through 2002 and again through late 2008 were about as low as the framework ever prints.
The honest caveat is that this article does not measure that. Every number above is the plain fixed-contribution plan, deliberately, because it is the weakest version of the argument and it still holds. A dynamic overlay has to be tested on its own terms, on its own window, with the rules fixed in advance — the traps involved are set out in how to backtest a DCA plan properly. Assuming an overlay would have improved this decade because it sounds like it should is exactly the reasoning the framework exists to remove.
What this article is not claiming
Four limits, stated plainly, because the ones that go unstated are the ones that hurt.
First, $64,097.20 on $60,000 contributed over ten years is a bad outcome. It is better than the alternatives available inside that decade, and it is nowhere near what a plan needs to produce over a working life. Do not read a relative win as a good result.
Second, the payoff for the flat decade was collected afterwards, not during it. The same investor, carrying the $64,097.20 forward and continuing at $500 a month through the 2010s, finished 2019 with $348,595.28 against $120,000 contributed across the full twenty years. That happened because the 2010s were exceptional — the S&P 500 total return index rose 251.01% over that decade. Nobody knew that in December 2009. The contributions made through the lost decade did not guarantee the next one; they only guaranteed you owned enough units to participate if it came.
Third, this is one country, one index, one ten-year window, chosen precisely because it is the famous counterexample. Two decades is not a sample, and the reasoning behind that limit is set out in what survivorship bias does to any historical record. The next flat stretch can be longer, deeper, or accompanied by inflation that makes the nominal figures above meaningless.
Fourth, the arithmetic assumes zero fees, zero taxes and perfect execution of 120 transfers. Real plans leak on all three. A fee of even half a point compounds against the balance every year, which is the subject of what investment fees actually cost over a decade, and it takes a real bite out of a result this thin. For general background on how contribution habits and allocation interact, the SEC’s investor education material on asset allocation and long-horizon investing is a reasonable, non-commercial starting point.
What to do with this in the next week
Three concrete things, none of which requires a market view.
Check whether your plan is actually mechanical. Not whether you believe in it — whether the transfer happens without a decision. If contributing requires you to press a button each month, you have already discovered which months will be missed, because they will be the ones that look like October 2008.
Put a number on your own worst case rather than borrowing this one. The DCA simulator will run your actual contribution against historical windows, including this one, and the crash replay tool will show you what your current allocation would have done through 2000–2002 and 2008 specifically. Ten minutes there is worth more than any article, including this one.
Then decide, in writing and before it matters, what you will do the next time your statement shows three consecutive down years. The decision is easy to make now and impossible to make then, and the entire result above turns on it. If watching that happen is not something you can commit to, that is worth knowing about yourself early — the argument for a slower start is in whether now is a good time to invest at all, and walking away from a plan you cannot run is a legitimate answer.
Frequently asked questions
What was the lost decade for the S&P 500?
It is the period from the start of 2000 to the end of 2009, when the S&P 500 price index fell from 1,455.22 to 1,115.10, a decline of 23.37%. Including reinvested dividends the decade still lost 8.22%, or about 0.85% a year. It is the standard exhibit used to argue that long-horizon index investing can fail for very long stretches.
Did dollar-cost averaging beat a lump sum during the lost decade?
In this specific window, yes, and by a wide margin: $64,097.20 against $55,066.90 on the same $60,000. That result is a consequence of a market that fell after the start date, not a general rule. Across most historical windows a lump sum wins, because markets rise more often than they fall — the general comparison is covered in lump sum against DCA.
Does a lost decade mean you should wait for a better entry point?
No, and the arithmetic in this article argues the opposite. The contributor’s advantage came entirely from continuing to buy while prices were poor. Waiting for a confirmed better entry means missing exactly the purchases that produced the result, which is the broader problem with time in the market against timing the market.
How long did it take the S&P 500 to recover from the 2008 crash?
The S&P 500 fell 56.78% from its October 2007 peak, needed a 131.35% gain to get back, and reclaimed the old high on 28 March 2013. A contributor’s break-even arrived considerably earlier than the index’s, because their cost basis kept falling throughout — the mechanics of that specific window are in DCA through the 2008 financial crisis.
Is a flat decade good for investors, then?
It is good for a specific person: someone early in accumulation, with a long horizon, contributing steadily, whose balance is small relative to their annual deposit. It is bad for someone drawing down, and increasingly neutral for anyone whose balance has outgrown their contributions. The same ten years of index returns produce opposite outcomes depending on which direction the money is moving.
What would have happened if you stopped contributing during the crash?
Stopping in October 2008 and never restarting left the plan at $54,929.89 on $52,500 contributed, against $64,097.20 on $60,000 for the plan that continued. Merely deferring six months of contributions and making them up later cost $738.49 on the same total. The cost of hesitation scales with how long it lasts.
Related reads
- Sequence of returns risk — why the same decade is dangerous once you are withdrawing.
- Volatility drag — why an average return and a compound return are different numbers.
- Lump sum against DCA — what the general case looks like, outside this window.
- DCA through the 2008 crisis — the same plan measured across the crash itself.
Educational content only — not financial advice. Past performance of any index is not a guide to future results.