
A contribution plan asks you for a number. Your income does not always give you one. If part of what you earn arrives as a bonus, a commission, an overtime run or a quarterly payout, then the standing order you set in January is a guess about a year you have not lived yet.
The usual advice for variable income is to average it: add up last year, divide by twelve, contribute that. It is reasonable advice and it hides a question nobody prices. Does the schedule actually matter? If you contribute the same money over the same years, does it change the outcome whether it arrived smoothly or in lumps?
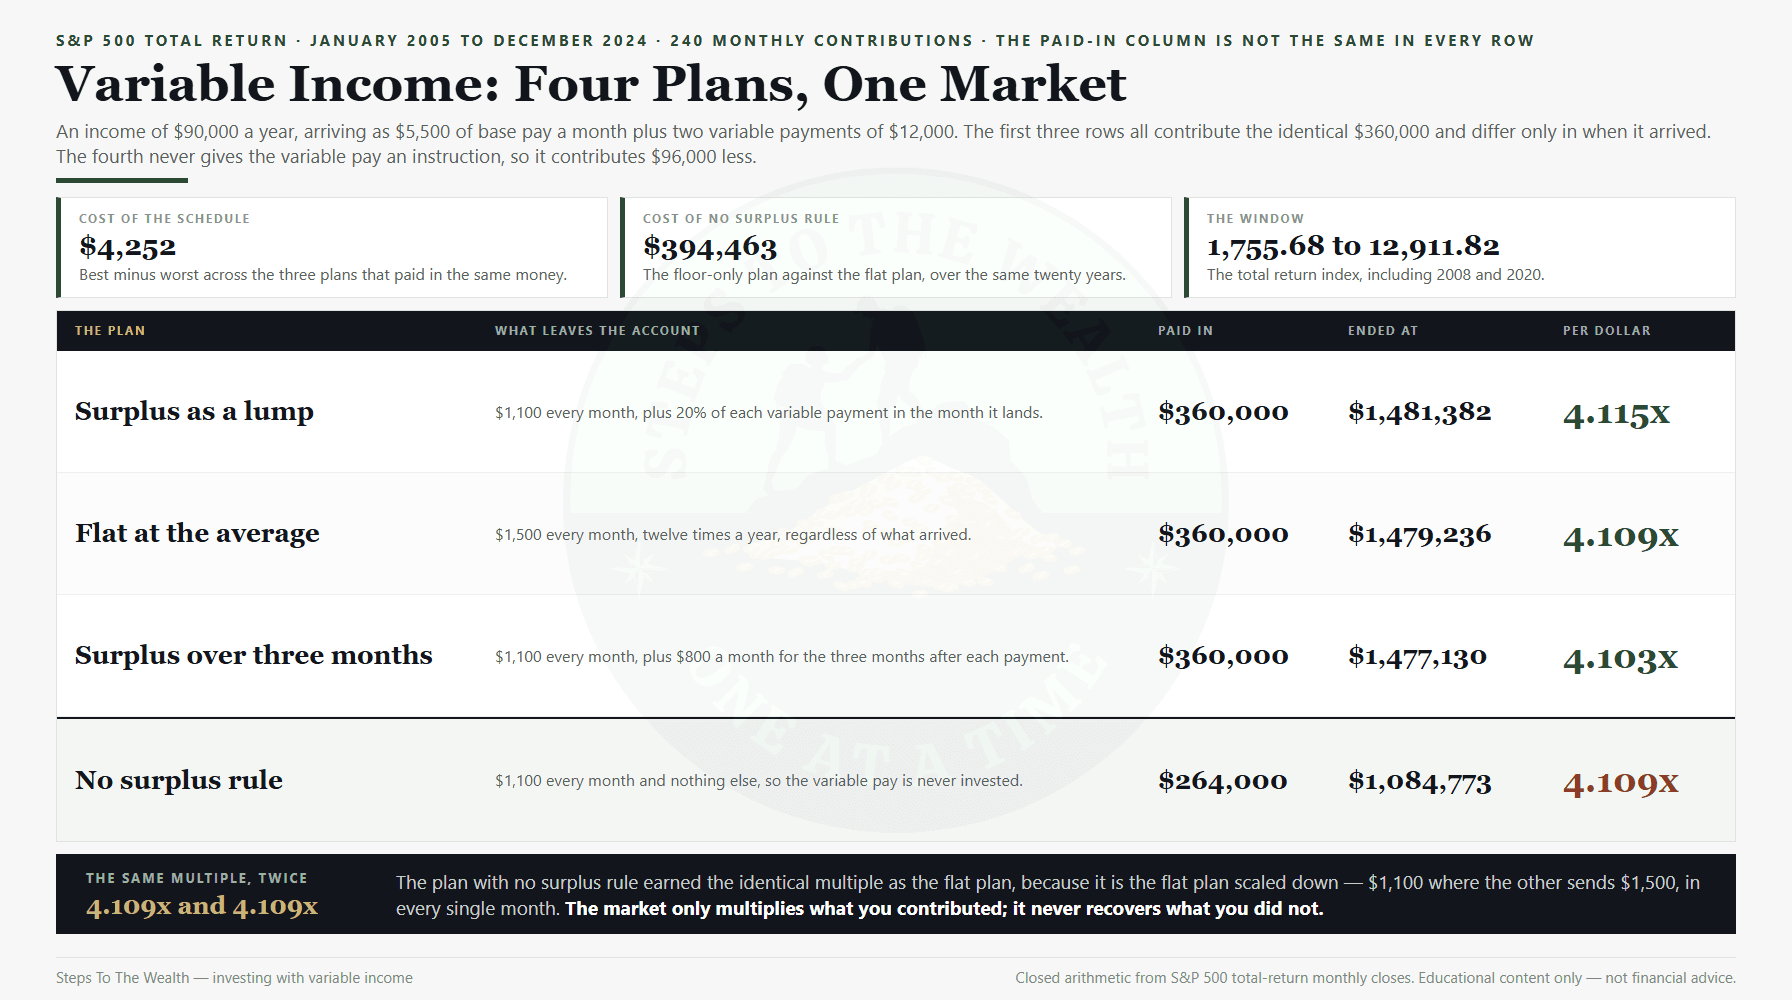
We ran it. Twenty years of real S&P 500 total-return data, three contribution schedules that each pay in exactly $360,000, and one that quietly pays in less. The gap between the three honest schedules is $4,252 — about a quarter of one percent, over two decades. The gap opened by the fourth is $394,463.
That ratio is the whole article. The schedule you argue about is worth almost nothing. The instruction you never wrote for the surplus is worth almost everything.
What variable income does to a contribution plan
Start with the mechanical problem rather than the emotional one. A monthly transfer is a fixed number leaving a bank account on a fixed date. Income that varies is a sequence of different numbers arriving on irregular dates. Those two things do not line up on their own, and every solution is some way of forcing them to.
There are only three honest ways to do it, and they are easier to see when you name them:
- Set the transfer to the average. One number, every month, sized to what the whole year should produce. Simple to run, but in a low month it takes a larger share of what actually landed.
- Set the transfer to the floor, then send the surplus separately. The standing order matches what your reliable pay can always cover. When the variable money arrives, a second transfer follows it.
- Set the transfer to the floor, then feed the surplus in gradually. Same floor, but the extra is broken into instalments over the following months rather than sent in one piece.
Notice what these three have in common. Over a full year they contribute identical money. They differ only in the calendar. That makes them a clean experiment, because any difference in the result is purely a question of when each dollar bought, never how much was spent.
There is a fourth thing people actually do, and it is not on that list because it is not a schedule. They set the standing order to what a base month can afford, and then never decide anything about the surplus at all. That one contributes less money. We priced it too, because it is the common case.
The income this article models
Concrete numbers beat a general argument, so here is the exact income path. A total of $90,000 a year. Of that, $66,000 arrives as reliable base pay of $5,500 a month, and $24,000 arrives as two variable payments of $12,000, in March and in September. The variable share is 26.7% of income — enough to matter, not so much that the reader stops recognising themselves.
This is deliberately not a freelancer. A freelancer has no floor, and the honest advice there is different. This is the far more common shape among working professionals: a dependable salary with a real variable component bolted on. An engineer with an annual bonus. An account manager on commission. A consultant with a utilisation kicker. A clinician picking up extra sessions.
The savings rate is 20%, which makes the annual target $18,000. Averaged out that is $1,500 a month. Twenty percent of the base pay alone is $1,100 a month. Hold on to both of those numbers, because the distance between $1,100 and $1,500 is where the entire argument lives.
The market data is the S&P 500 total-return index, monthly closes, January 2005 through December 2024. That is 240 months. The index went from 1,755.68 to 12,911.82 over the window, and it includes the 2008 financial crisis and the 2020 crash, so nobody can accuse the sample of being a clean run.
Four plans, one year, side by side
Before the twenty-year result, look at a single year of each plan. The table below is what actually leaves the account each month under all four.
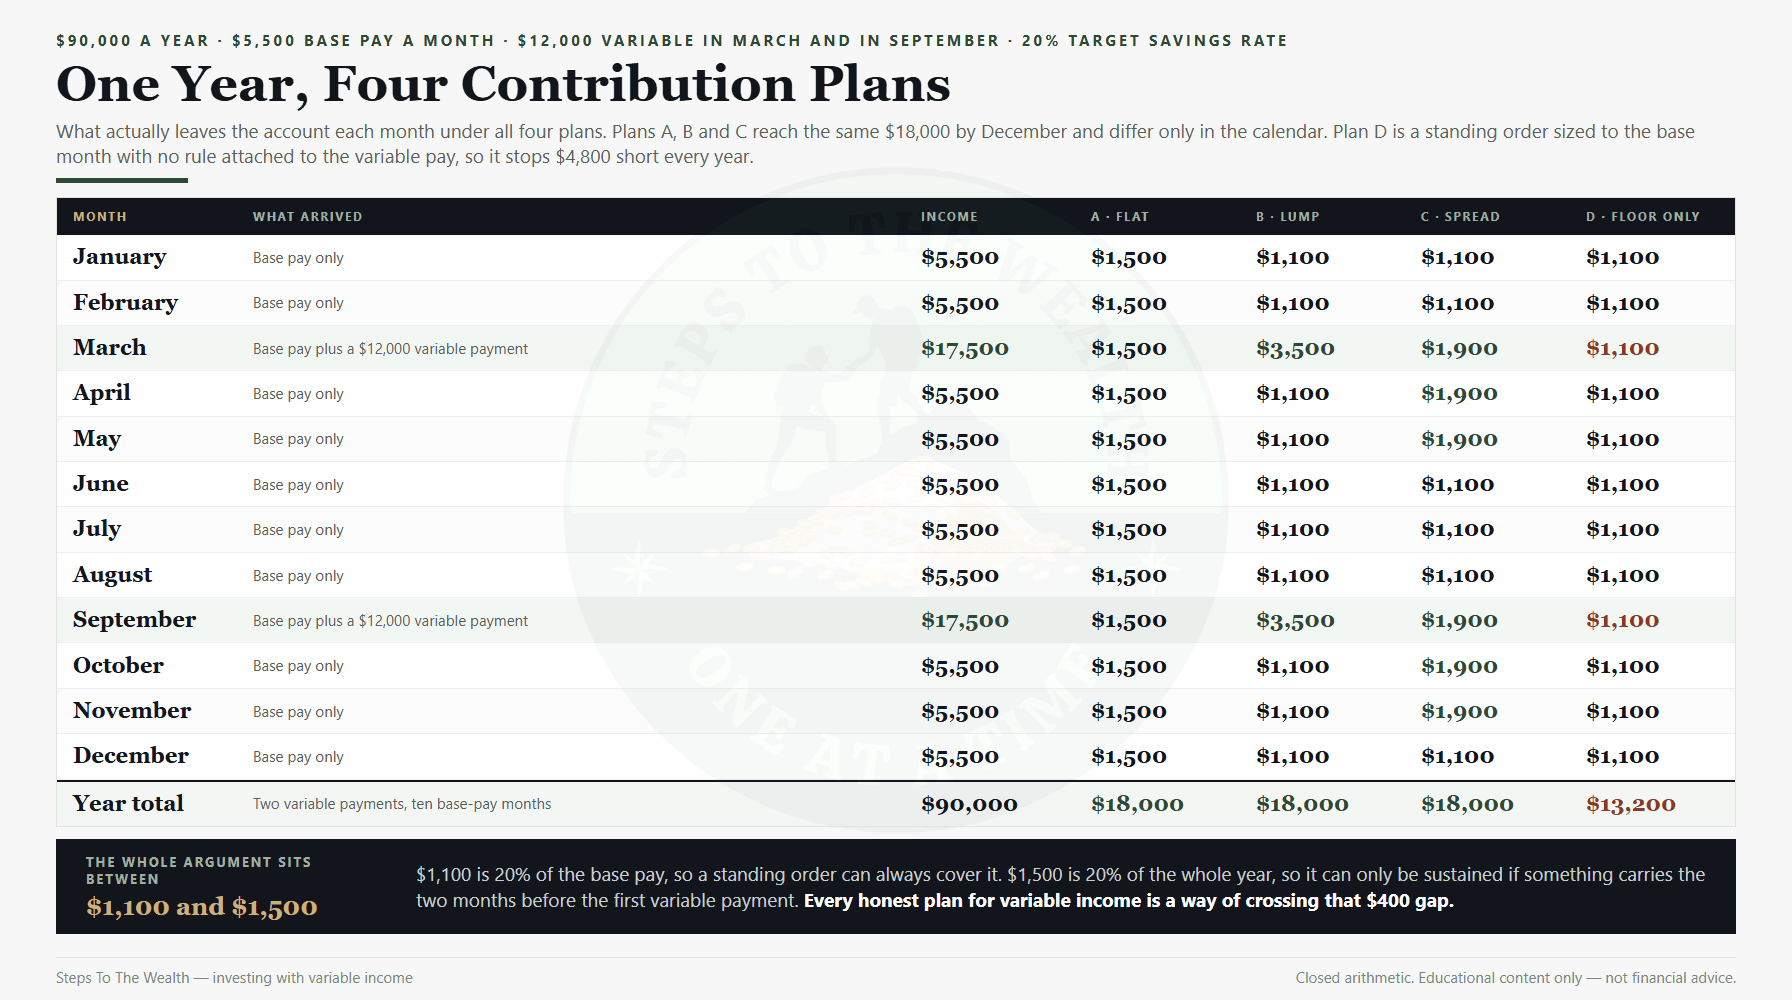
Plan A sends $1,500 every month without exception. Plan B sends $1,100 in ten months and $3,500 in the two months the variable pay lands. Plan C sends $1,100 in six months and $1,900 in the six months following each payment. Plan D sends $1,100 every month, full stop.
A, B and C total $18,000 a year. D totals $13,200. That is the fourth column of every argument that follows.
One honest detail about Plan A that the table shows and the advice usually skips. In January and February, before any variable pay has arrived, Plan A is sending $400 a month more than the base pay supports at a 20% rate. Over those two months it needs $800 carried from somewhere. That is not a dramatic number, and it is not a reason to reject Plan A. It is a reason to know that Plan A quietly assumes you have a buffer sitting behind it.
Three schedules that pay in exactly the same money
Now run all three across the full 240 months. Each one contributes $360,000. Each one buys the same index. The only variable is the calendar.
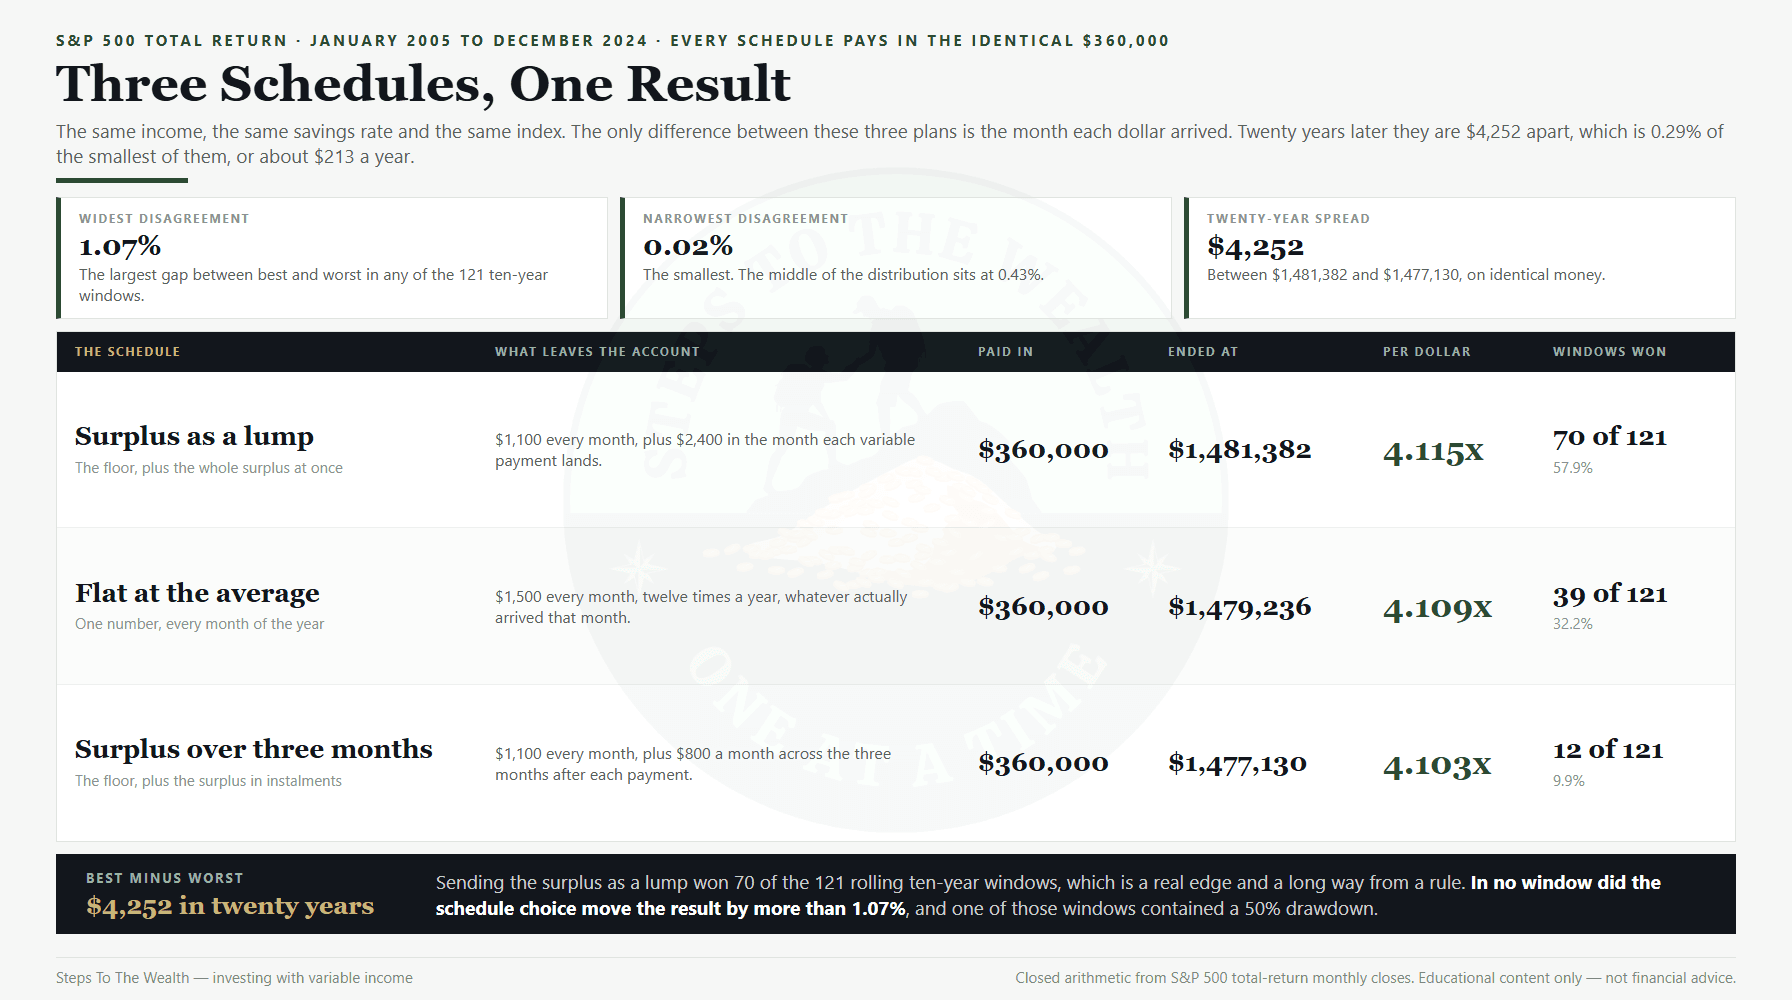
Plan B, sending the surplus as a lump the month it arrives, finished highest at $1,481,382. Plan C, feeding it in over three months, finished lowest at $1,477,130. Plan A, the smooth average, landed between them at $1,479,236.
Best minus worst is $4,252. On a $1.48 million balance built over twenty years, that is 0.29%.
Read that number carefully, because it is easy to read it as the wrong kind of good news. It does not say the schedules are equivalent. It says the difference is roughly $213 a year, which is smaller than the amount most people would gain by looking once at their fund fees. Two decades of getting the timing question exactly right bought less than one afternoon spent on costs.
The result held across 121 rolling ten-year windows
One window is one story. A single twenty-year run that happens to end in December 2024 could be flattering any of these plans by accident, and presenting it as settled would be exactly the sort of claim this site exists to argue against.
So we re-ran the three schedules over every rolling ten-year window inside the data. There are 121 of them, starting January 2005 through January 2015, each one a full decade of contributions.
Plan B finished highest in 70 of the 121 windows. That is 57.9%. It is an edge, and it points the same direction as the lump sum versus DCA evidence, for the same structural reason: money in the market longer is money exposed to more of an upward-drifting series. But 57.9% is much closer to a coin toss than to a rule, and anyone selling it as a rule is overselling it.
The more useful number from those 121 windows is the spread. In the window where the three schedules disagreed the most, the gap between best and worst was 1.07%. In the window where they disagreed the least, it was 0.02%. The middle of the distribution sits at 0.43%.
Across every ten-year stretch in twenty years of data, including one that contained a 50% drawdown, the schedule decision never moved the outcome by more than about one percent. That is the finding, and it is stable.
The decision that actually carries money
Now Plan D, which is what happens when the surplus never gets an instruction.
Plan D is not a strategy anyone chose. It is what a fixed standing order does by default. You set the transfer at a level a base month can always cover, and then the bonus lands, and there is no rule attached to it, and it goes to the current account and gets absorbed. Nothing dramatic happens. Nobody panics or sells anything.
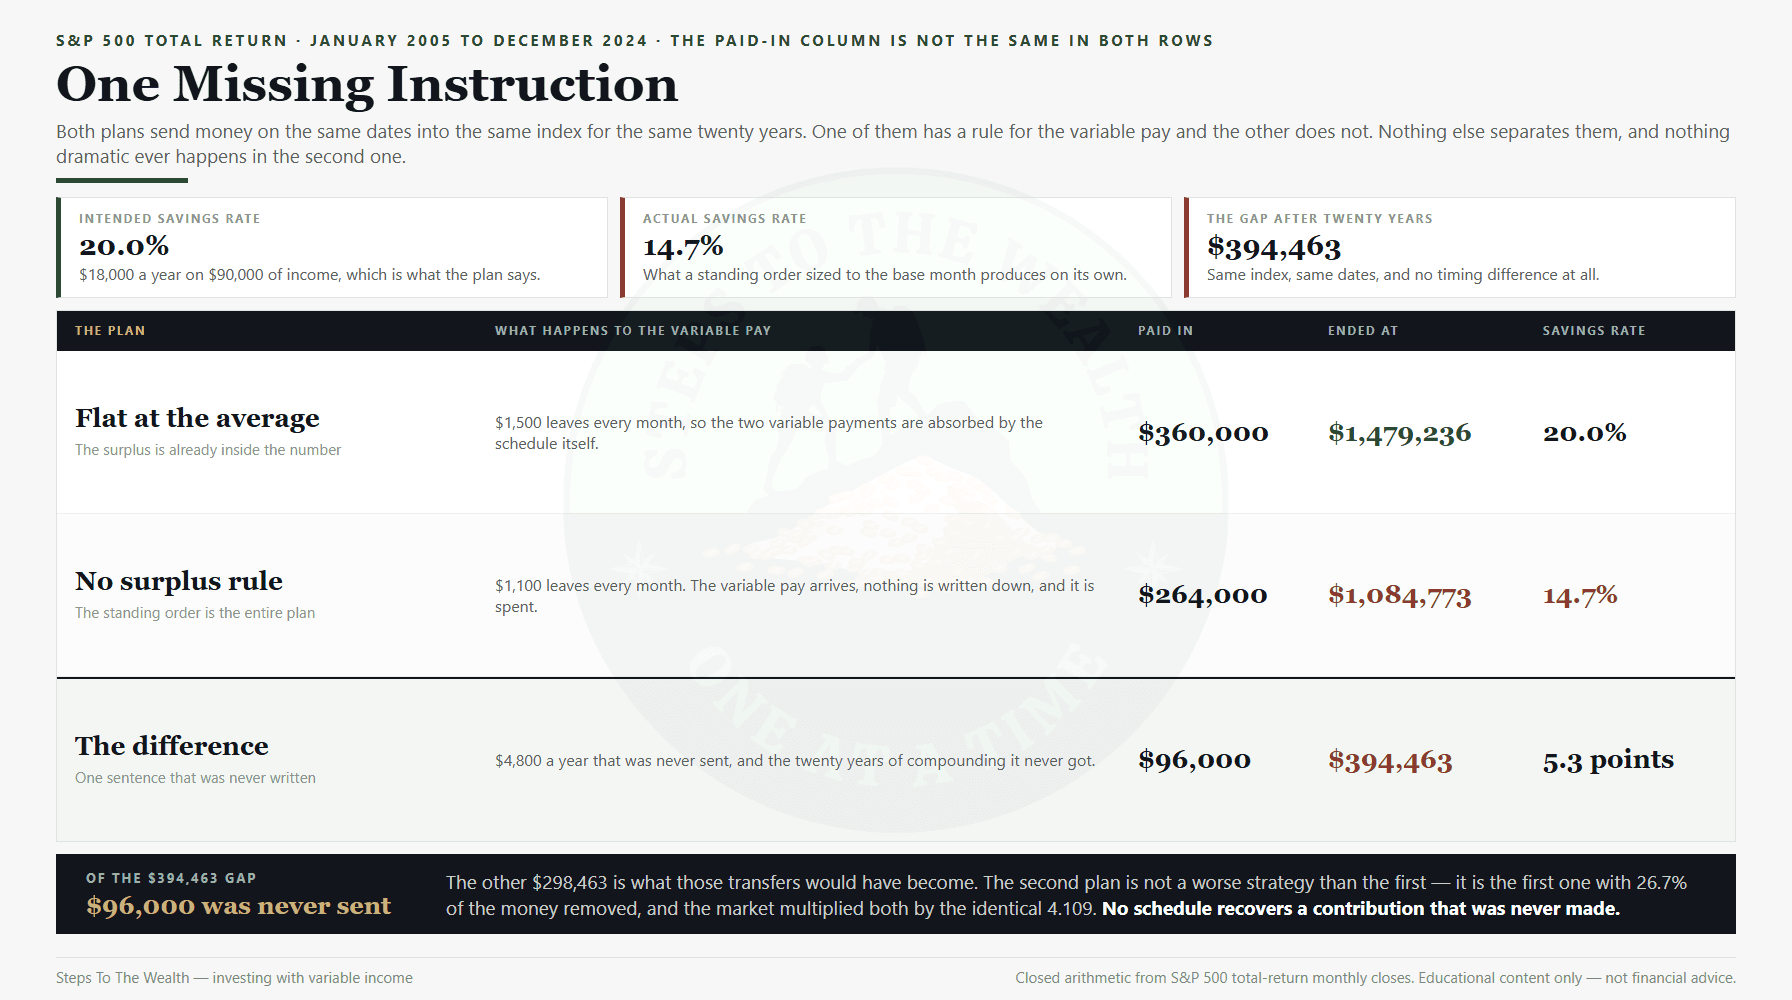
Plan D contributed $264,000 against Plan A’s $360,000 and finished at $1,084,773 against $1,479,236. The gap is $394,463.
Be precise about what that gap is made of, because a big number sitting next to a smaller one invites a wrong reading. Of the $394,463, exactly $96,000 is money that was never contributed. The remaining $298,463 is what that $96,000 would have grown into.
And here is the part worth sitting with. Plan D contributes $1,100 where Plan A contributes $1,500, in every single month, without exception. It is Plan A multiplied by a constant. So Plan D contributed 73.3% of the money and finished with 73.3% of the value. Not approximately. Exactly.
The market did not punish Plan D and it did not rescue it either. There is no timing effect at all, in either direction, because there is no timing difference. That is the cleanest possible demonstration of something the schedule debate keeps obscuring: no arrangement of the calendar recovers money you did not contribute.
Why a fixed standing order quietly caps your savings rate
Restate Plan D as a savings rate and it stops looking like an oversight and starts looking like a decision.
Plan D contributes $13,200 on $90,000 of income. That is 14.7%. The intended rate was 20%. Nobody ever decided to save 14.7%. It is simply what a standing order sized to the base month produces when the variable pay has no rule of its own.
This is the chain, and it is worth walking slowly. Your standing order can only be as large as your worst month allows, or it breaks in that month. Your worst month is your base pay. So a single fixed transfer can never, by construction, capture the variable portion of your income. So if the variable portion has no separate instruction, it is not being saved — it is being spent, by default, without a decision.
The higher your variable share, the more this costs. At 26.7% variable, a floor-only standing order caps you at 73.3% of your intended rate. Someone whose variable pay is 40% of income and who runs the same setup is saving 60% of what they think they are saving.
This is the same mechanism as lifestyle creep on a raise, arriving from a different direction. A raise increases the money and not the transfer. A bonus increases the money and not the transfer. The multi-year version of the same problem, and what a fixed annual increase is really worth, is priced in increasing your contributions. In both cases the money is real and the plan simply does not have a line for it.
The trap of waiting for a better moment to deploy the surplus
There is one more failure that does not show up in any of the four plans, because it is not a schedule either. The bonus arrives, and instead of going nowhere it goes to a savings account “for now”, to be invested when things look better.
That is a market call wearing the costume of prudence. It also has an arithmetic cost, and waiting has been priced on this site before. The relevant point here is narrower: if you have already accepted that the difference between sending the surplus as a lump and feeding it in over three months is 0.29% over twenty years, then you have already accepted that you cannot possibly time it well enough to matter.
The genuine exception is the one the framework is built around. If your risk reading is elevated, the surplus is not exempt from that. It sits in the same queue as every other dollar, under the same rules, and it gets deployed as risk falls. That is not waiting for a better moment. That is a rule written in advance, applied to money that has not arrived yet. The difference between the two is whether you decided before or after you saw the number.
What this does not solve
Three limits, stated plainly.
The first is that this models one income shape. Two payments a year, both the same size, both arriving in known months. A commission-only earner with twelve unpredictable months has a genuinely harder problem, and the honest answer for them is that the floor should be set low and revisited, not that some schedule wins.
The second is that the model assumes the money is always contributed. It does not model a year where the bonus does not arrive, and it does not model the choice between a smaller bonus and an unchanged plan. When the variable pay is late or absent, the floor is what protects the plan, which is a real argument in Plan B and Plan C’s favour that the ending values do not show. Income that stops altogether is a different problem again, with its own order of operations: that is investing after job loss.
The third is that a 0.29% spread is specific to this income shape, this savings rate and this index over these twenty years. It is not a universal constant. What is durable is the ratio, not the decimal: the schedule question is small, the instruction question is large, and the second one is roughly ninety times the size of the first in this data.
Run your own numbers rather than inheriting ours. The DCA simulator will take your actual contribution pattern against real history, backtesting a plan properly is its own discipline, and for the arithmetic on its own the SEC’s compound interest calculator is free and neutral.
How to set this up in one sitting
This is mechanical work, not a project, and it takes about twenty minutes.
First, find your floor. Not your average income and not your good month. The lowest monthly figure your reliable pay produces, before any variable component. Apply your target savings rate to that and you have your standing order. It should never break in a bad month, because a plan you had to cancel once is a plan you will hesitate to restart.
Second, write the surplus rule down before the surplus arrives. One sentence, decided in advance, with a percentage and a destination. “Twenty percent of any variable payment is transferred within seven days of it landing.” The date matters more than the percentage, because an undated intention is the thing that becomes Plan D.
Third, decide once whether the surplus goes in as a lump or in instalments, and then stop revisiting it. The data says the choice is worth about a quarter of a percent over twenty years. Spending any further attention on it is attention taken from the things that are worth full percentage points: your costs, your position sizing, and whether you keep contributing at all through a bad stretch.
Fourth, check the whole thing once a year, at a fixed date, not when a payment lands. If your base pay changed, the floor changed. A short scheduled review is enough; this does not need monitoring.
Where this fits
The framework this site teaches is risk-first: you decide the rules before the money moves, and then the rules run whether or not the month is comfortable. Variable income is a good test of whether you actually have rules or just habits, because habits handle the ordinary month fine and fall apart the month something unusual arrives.
The measurable version of that idea is this article’s finding. Three careful, thoughtful, well-intentioned schedules separated by $4,252. One missing sentence separated by $394,463. Optimisation of the thing you can see, in place of a decision about the thing you cannot, is the most expensive habit in personal investing, and it does not look like a mistake while you are making it.
None of this touches what you buy. The surplus rule decides that money gets invested and when; where it lands is the separate question of asset allocation, and it should be answered the same way — once, in advance, in writing.
If you want the weekly version of this — the risk readings and what the rules say to do with them — the Sunday newsletter is where it goes out. If you would rather see whether your own contribution pattern holds up against the last twenty years first, that is what the simulator is for. Either way, write the surplus rule down first. It is the only part of this that pays six figures.
Frequently asked questions about investing with variable income
How do I calculate a monthly contribution with variable income?
Apply your target savings rate to your reliable base pay, not to your average income. That gives a standing order that survives your worst month. Then write a separate rule that sends the same percentage of every variable payment within a fixed number of days of it arriving. In the model above, that is $1,100 a month plus 20% of each bonus, which reaches the same $18,000 a year as a flat $1,500 without ever demanding a month you did not have.
Should I invest my bonus as a lump sum or spread it out?
Across 121 rolling ten-year windows, sending it as a lump finished ahead in 57.9% of them, and the widest gap between any two schedules in any window was 1.07%. It is a small, real edge in one direction. Pick one, write it down, and stop reviewing the decision — the cost of leaving the question open is far larger than the difference between the answers.
Is it better to average my income and contribute a flat amount?
It works, and it finished within 0.29% of the alternatives over twenty years. The condition is that averaging front-loads the year: in the months before your first variable payment, you are contributing more than your base pay covers at your target rate. In the model that was $800 across January and February. If you have a buffer that can absorb that, flat is the simplest plan to run.
What happens if my bonus does not arrive one year?
A floor-based plan is unaffected, because the standing order was never sized to the bonus. A flat averaged plan has a shortfall for the rest of that year and has to be resized. This is the argument for the floor approach that the ending values do not capture: it fails more gracefully, and it never asks you to cancel a transfer.
How much does the contribution schedule actually matter?
In this data, 0.29% over twenty years between the best and worst of three schedules paying in identical money. By comparison, the plan that let the variable pay go uninvested finished $394,463 behind on the same market. The schedule is a rounding error next to whether the surplus is invested at all.
Does a fixed standing order really lower my savings rate?
If your variable pay has no rule of its own, yes, and by an amount you can calculate exactly. A standing order can only be as large as your lowest month supports, so it can never capture the variable portion. In the model that turned an intended 20% rate into an actual 14.7%, purely by omission.
Educational content only — not financial advice. Figures are closed arithmetic from S&P 500 total-return monthly closes, January 2005 to December 2024. Past results do not predict future results. The jurisdiction in which the site operator resides governs any question of applicable law.