
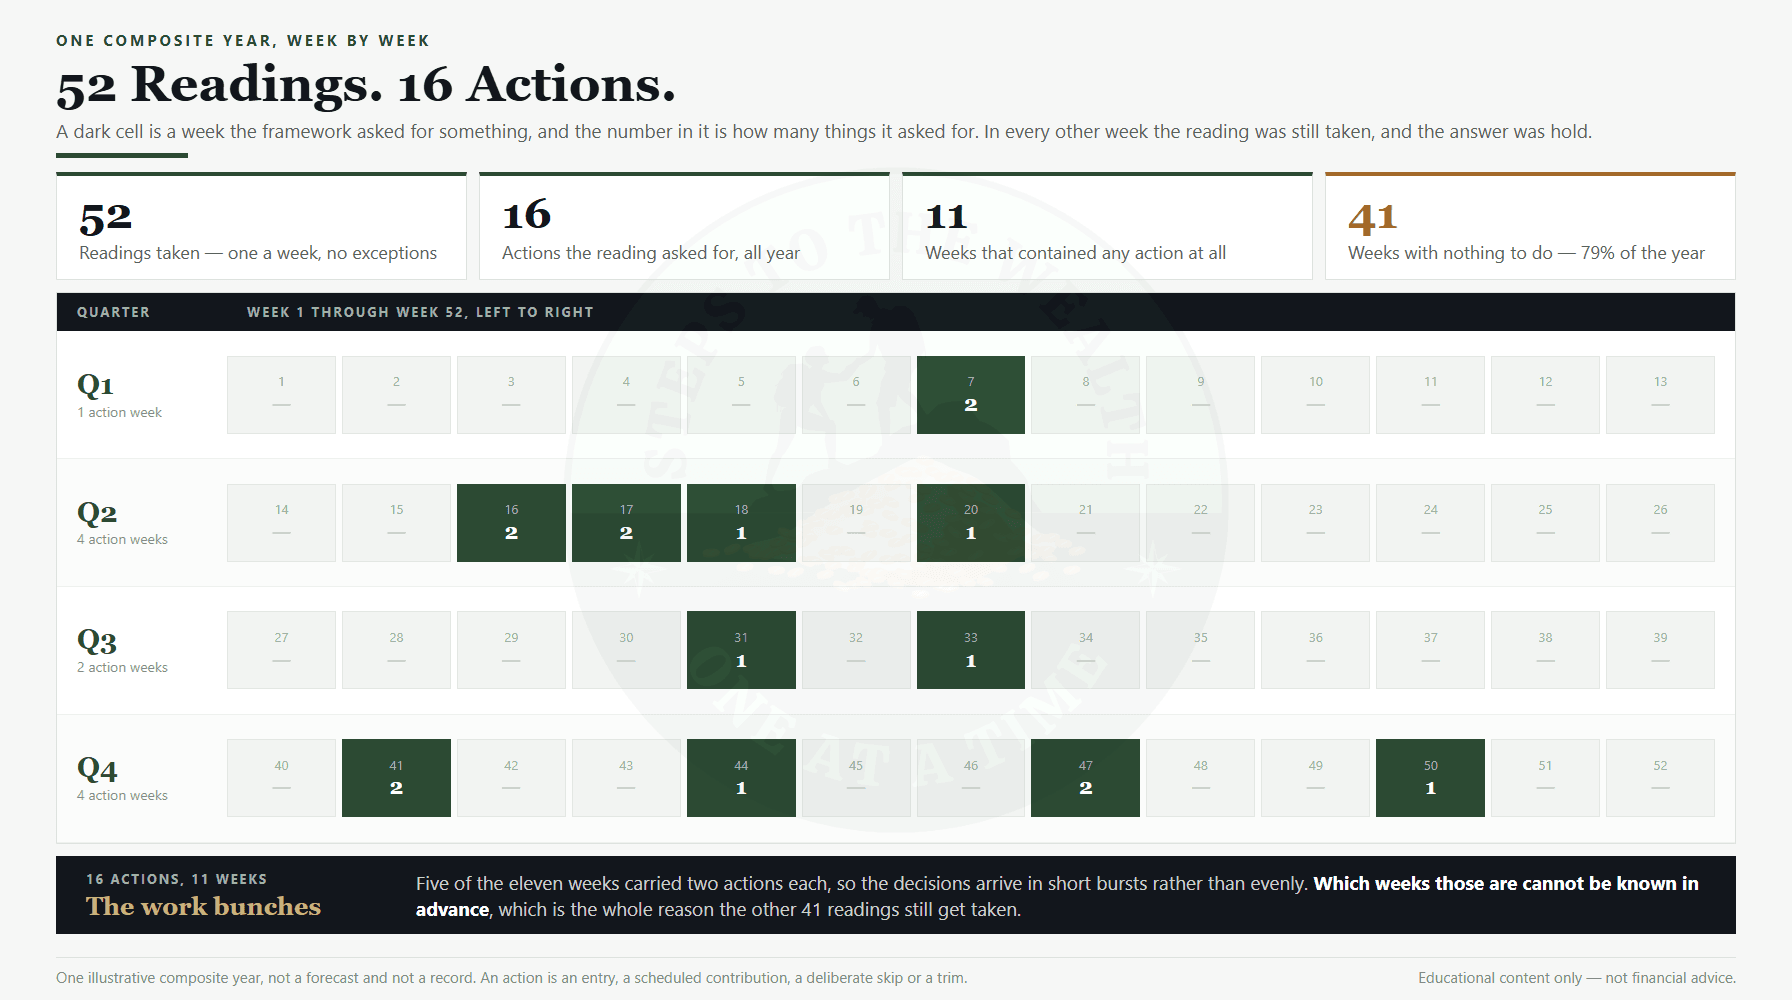
An average investing year contains far less activity than almost anyone expects when they adopt a framework. Fifty-two readings get taken. Sixteen of them ask for something. The other forty-one weeks end the same way: read the level, confirm nothing has crossed a threshold, write down “hold”, and close the laptop.
That is not a framework underperforming its brochure. It is what a rules-based year looks like from the inside, and the gap between that reality and the imagined version — sharp calls, weekly moves, a decision worth telling someone about — is the single most common reason working professionals abandon a system that was working.
What follows is one composite year, priced and counted: where the sixteen actions land, what the forty-one empty weeks are actually doing, what the whole thing costs in hours, and how to tell a healthy quiet year from a broken one that looks identical.
Educational content only. Not financial advice.
What an average investing year actually contains
The framework produces a reading every week, so a year is fifty-two readings. If each reading produced an action, that would be fifty-two decisions, and the calendar would feel busy enough to be satisfying.
It does not work that way. In the composite year used throughout this article, sixteen actions were taken. An action means something the reading had an opinion about: an entry on the ladder, a scheduled contribution, a deliberate skip while conditions were unfavourable, or a step of a trim. Sixteen out of fifty-two readings. Everything else resolved to hold.
Those sixteen actions did not each get their own week either. They landed in eleven weeks, because five of those weeks carried two actions apiece. Eleven weeks out of fifty-two is 21% of the year. The remaining forty-one weeks — 79% of the calendar — contained a reading and nothing else.
Break the sixteen down by the risk zone that produced them and the shape gets clearer still. Five were entries at low readings, four were scheduled contributions at moderate readings, four were decisions in the elevated zone where the rule is to stop adding and let cash accrue, and three were steps of a reduction at high readings. Five plus four plus four plus three is the whole year of decisions.
None of that is a light version of the strategy. It is the strategy. The risk-first framework decides the response to each zone in advance precisely so that the number of live judgement calls in a year is small, and small is the target rather than a side effect.
Where the sixteen actions land, and why they bunch
Look again at the map above and the important feature is not the count. It is the distribution. The action weeks are not spread evenly at roughly one a month. They cluster.
In the composite year, one action week falls in the first quarter, four in the second, two in the third, and four in the fourth. Inside those quarters they sit next to each other: weeks 16, 17, 18 and 20 carry six of the year’s sixteen actions between them, because a drawdown moved the reading down through several rungs in quick succession. The fourth-quarter cluster is the mirror image, a stretch of strength pushing the reading up and firing the reduction steps.
This clustering is structural rather than coincidental. A framework acts when conditions cross a threshold, and conditions do not drift across thresholds at an even rate. They sit still for months and then move a long way in a fortnight. The actions inherit that rhythm exactly.
Two practical consequences follow. The first is that a quiet stretch tells you nothing about how quiet the next stretch will be, so it is not evidence that the framework has gone dormant. The second is that you cannot know in advance which weeks the bursts will occupy. That is the entire justification for taking a reading in all fifty-two weeks: the forty-one that produce nothing are the price of being present for the eleven that do.
It also explains why a strategy of “I will pay attention when something is happening” fails. By the time something is obviously happening, the reading has already crossed the threshold that a scheduled reader would have caught, and the rungs that were meant to be bought at the lower level get bought at a higher one. How money gets deployed across a move rather than at a single moment is the subject of lump sum versus dollar-cost averaging, and the burst weeks are exactly where that decision gets made or missed.
The forty-one empty weeks are not the strategy failing
Here is the reframe that takes the longest to accept: in a week the framework says hold, holding is the action. It is not the absence of a decision. It is a decision, made against a reading, and executed.
The difficulty is that it does not feel like one. Every week you hold, you are declining to do something available and defensible. You could trim and bank a gain. You could rotate into whatever has been leading. You could go to cash because a headline landed badly. Saying no to all of it, forty-one times a year, produces no moment you can point at afterwards and feel competent about.
But the compounding lives in those weeks. The return on a multi-year position does not come from the entry or the trim; it comes from the long stretch in between where the position was simply left alone. The eventful weeks get the attention. The uneventful ones get the return.
Filling them with activity does not add anything. It subtracts, through costs, tax events created at times nobody planned, and rungs spent above the price the plan set for them. The idea that a systematic approach is somehow lazy is one of the more expensive myths about dollar-cost averaging: the discipline is not in the sixteen actions, which are close to automatic once the rules exist. It is in the forty-one refusals to improvise.
One distinction matters here, because it is easy to take the wrong lesson. Holding an invested position through a quiet stretch is not the same thing as sitting in cash waiting for a better moment to start. The second one has a measurable price, set out in what waiting actually costs. Quiet weeks are cheap when the money is already working. They are expensive when it is not.
What an average investing year costs: 13 hours to find 16 decisions
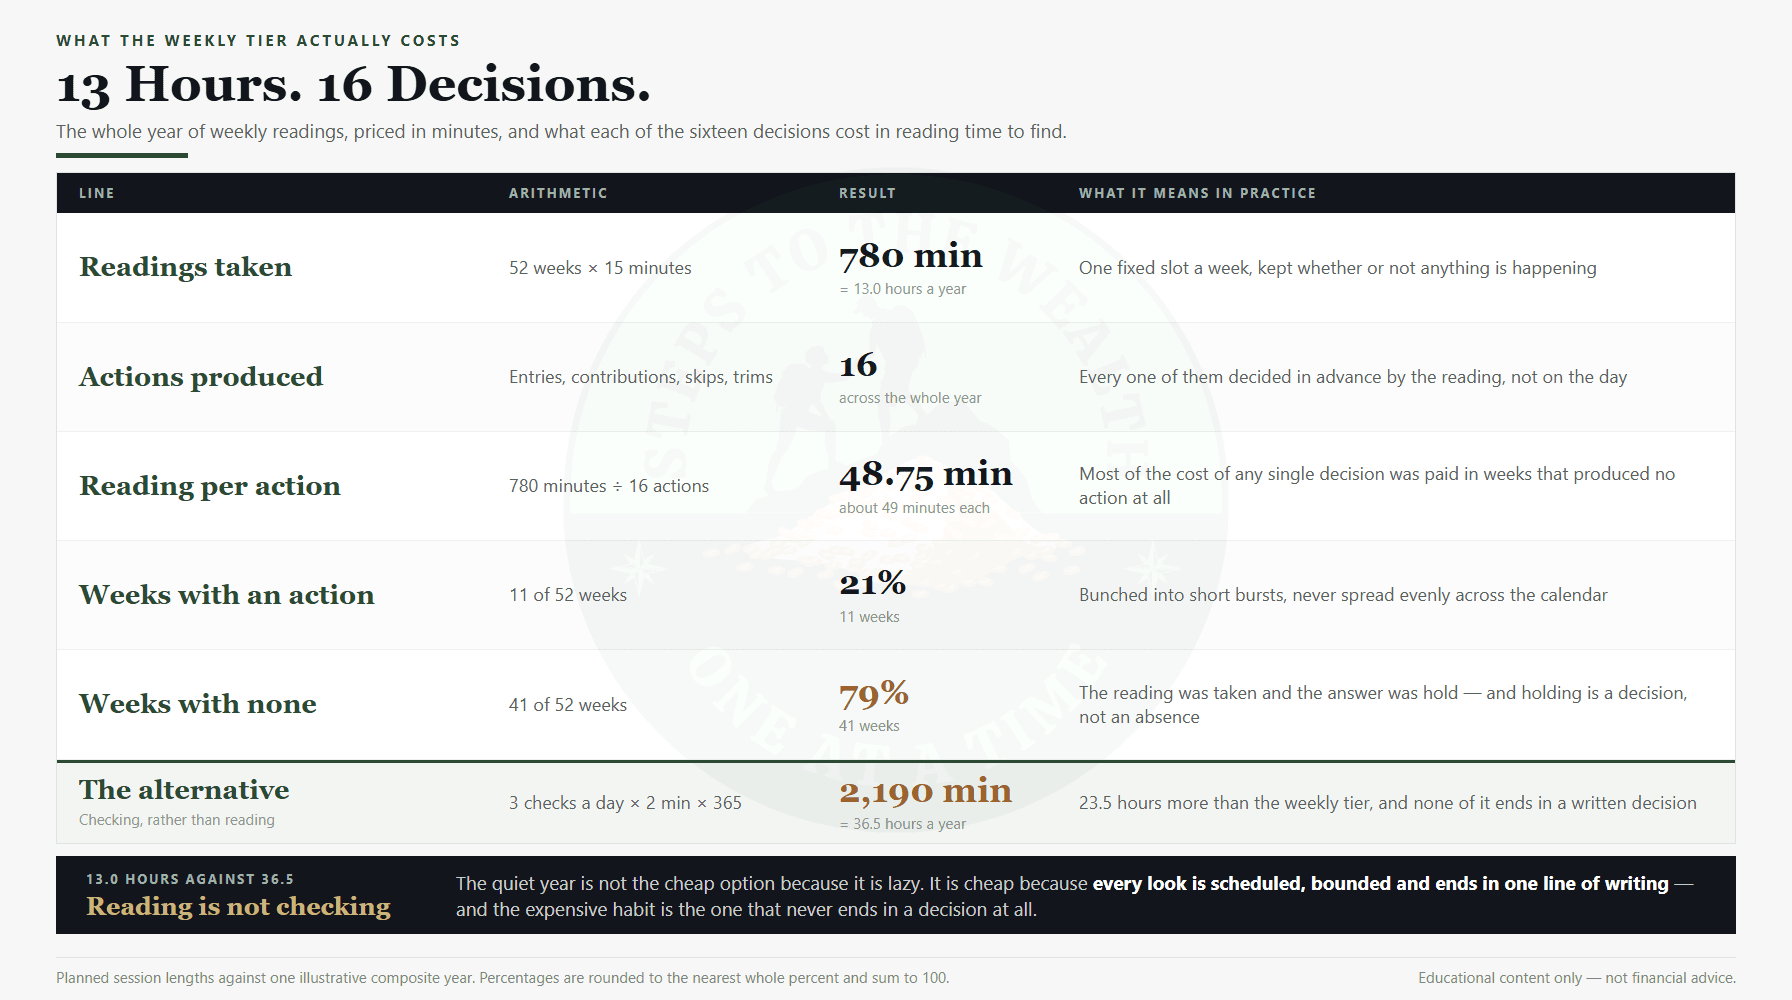
A weekly reading takes about fifteen minutes when it is a fixed routine rather than an open-ended browse, and what those fifteen minutes contain is a settled checklist rather than a browse. Fifty-two of them is 780 minutes, or 13.0 hours a year.
Divide that by the sixteen actions and each decision cost 48.75 minutes of reading time to find — call it forty-nine minutes. That number is worth sitting with, because it prices the thing people find hardest to justify. Most of the cost of every action in the year was paid in weeks that produced no action at all. There is no version of this where you get the sixteen without the fifty-two.
Set against the alternative, it is cheap. Checking a portfolio three times a day for two minutes is 2,190 minutes a year, 36.5 hours, which is 23.5 hours more than the entire weekly tier costs. The unstructured habit consumes nearly three times the time and produces no written decisions at all, because none of those looks was ever going to end in one.
The difference is not diligence. It is that a reading is bounded, scheduled and ends in a line of writing, while a check is unbounded, unscheduled and ends in a feeling. Thirteen hours a year is roughly fifteen minutes a week, which is the reason this works around a full-time role rather than competing with it — the case made in detail in how to invest while working full time.
The weekly tier is not the whole calendar, either. Savings rate belongs to a monthly review, allocation drift to a quarterly one, and account structure to an annual one; the input that drives each decision changes at its own speed, and a decision made in a faster tier than it belongs to is a decision made with less information. What lands in the monthly tier is largely a question about your savings rate against lifestyle creep, which moves far too slowly to be worth a weekly look.
The 164 refusals nobody records
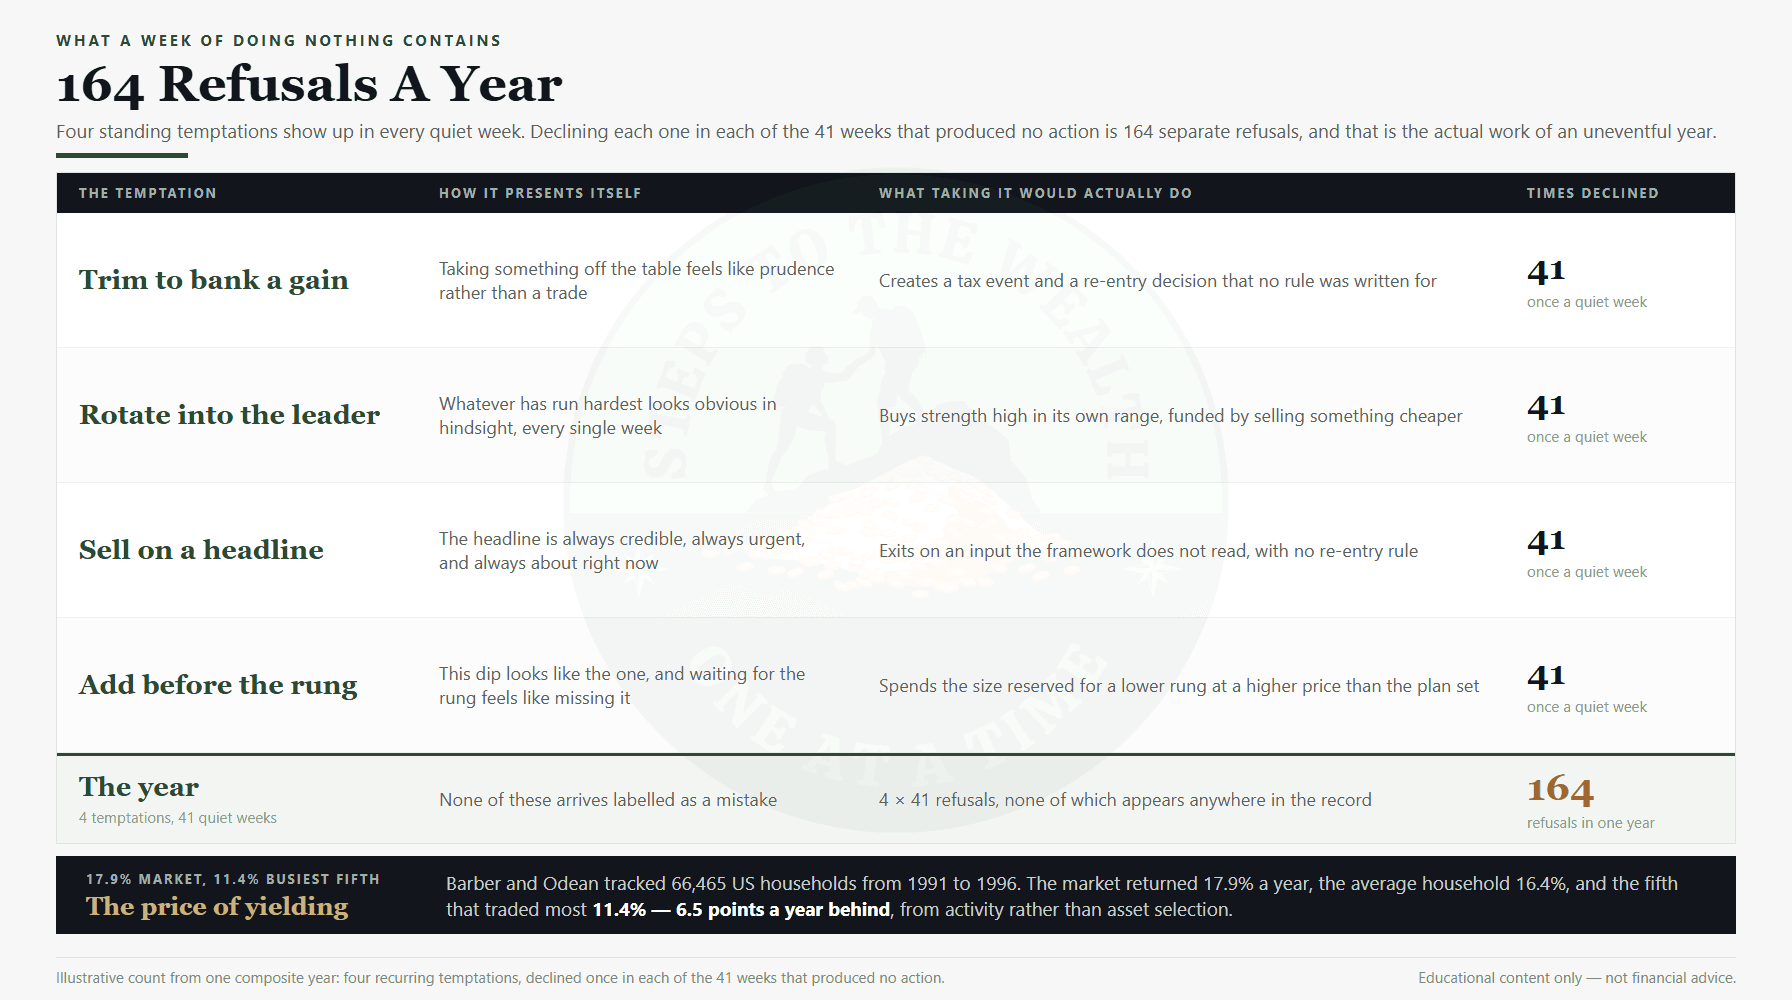
Four temptations turn up in essentially every quiet week, and each one arrives wearing the costume of prudence rather than the costume of a trade.
Trim to bank a gain. Taking something off the table after a run feels like risk management. It creates a tax event and a re-entry decision that no rule was written for, and the re-entry is the part that goes badly.
Rotate into the leader. Whatever has run hardest looks obvious in hindsight, every single week. Acting on it buys strength near the top of its own range, funded by selling something cheaper.
Sell on a headline. The headline is always credible, always urgent, and always about right now. Acting on it exits on an input the framework does not read, with no rule for getting back in.
Add before the rung. This dip looks like the one, and waiting for the rung feels like missing it. Acting on it spends the size reserved for a lower level at a higher price than the plan set.
Four temptations across forty-one quiet weeks is 164 separate refusals in a single year, none of which appears anywhere in the record. No statement line, no trade confirmation, no entry in the annual review. The year looks, on paper, like nothing happened.
The price of not refusing has been measured. Barber and Odean tracked 66,465 US households at a large discount broker between 1991 and 1996. The market returned 17.9% a year over that period, the average household 16.4%, and the fifth of households that traded most 11.4% — 6.5 percentage points a year behind the market. None of the gap was attributed to picking worse companies. It came from acting more. The original paper is free to read and is worth going to directly rather than through summaries.
How to tell a quiet year from a broken one
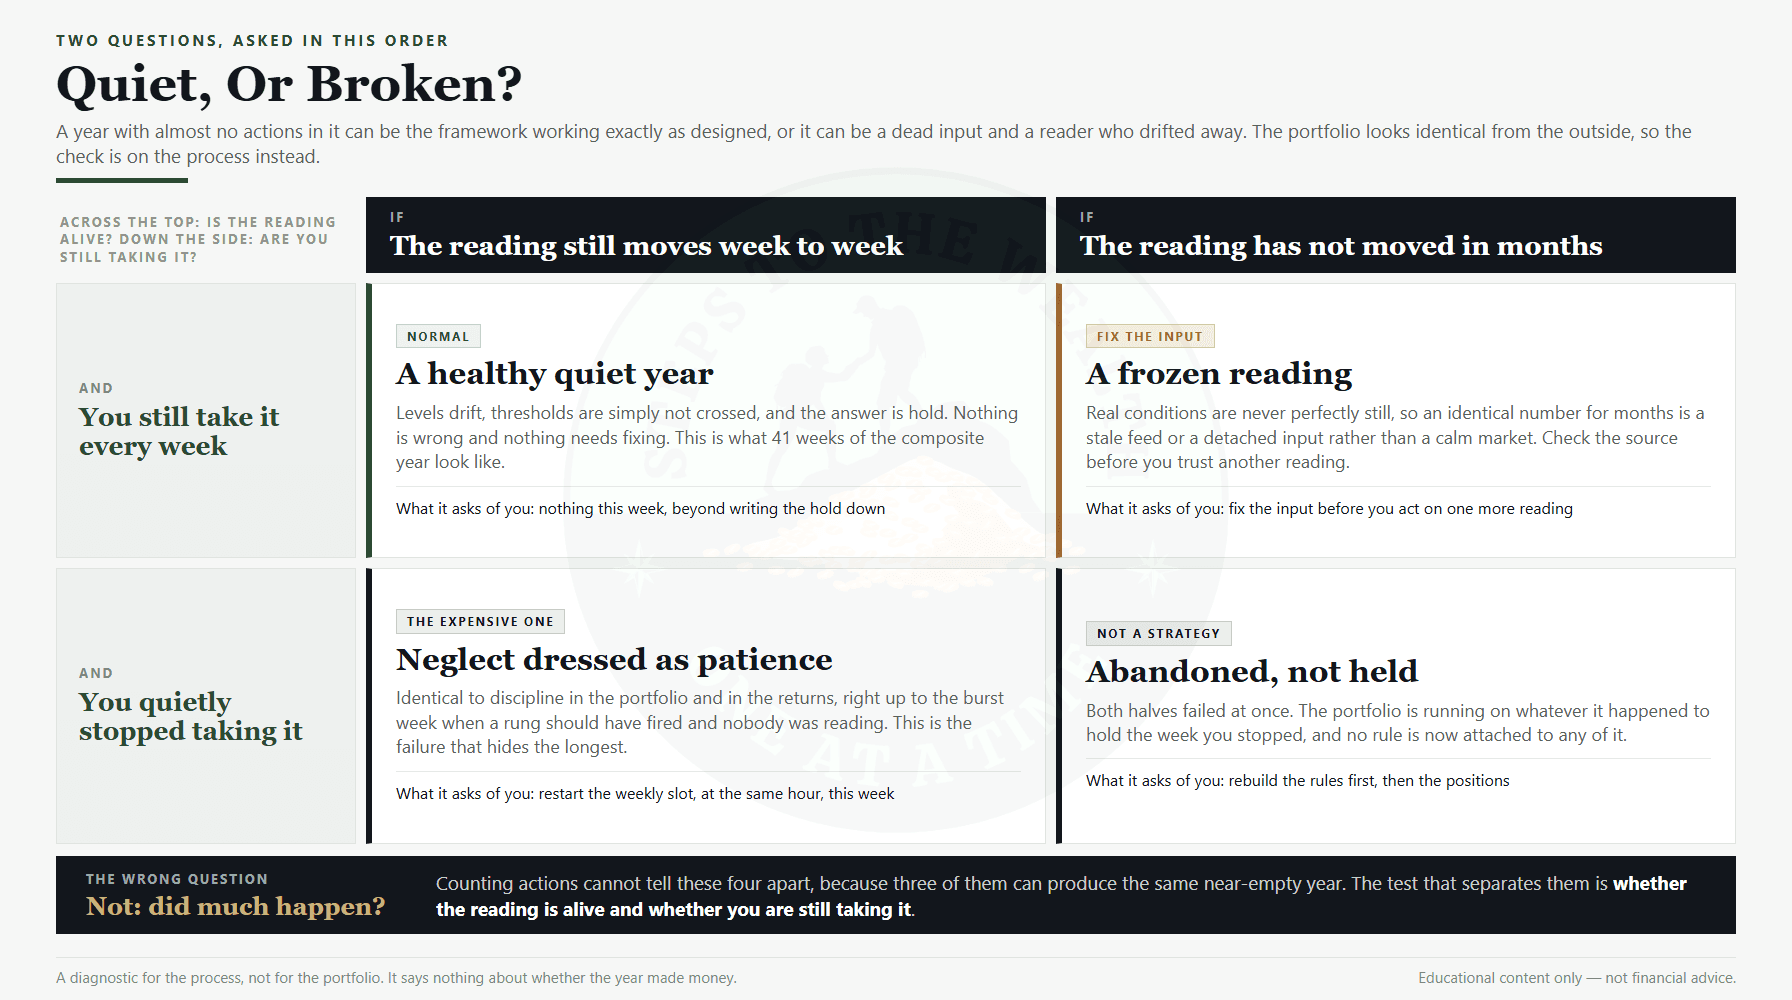
If “mostly nothing” is normal, the obvious problem is that a working year and an abandoned one produce the same near-empty record. Counting actions cannot separate them. Two questions can.
Is the reading still moving? In a healthy quiet year the levels drift week to week even when no threshold is crossed. The reading is alive and responsive; it simply has not asked for anything. What you should not see is an identical number month after month. Real conditions are never perfectly still, so a frozen reading is a stale feed or an input that has quietly detached, not a calm market. That is a plumbing problem, and it is worth fixing before you act on one more reading.
Are you still taking it? This is the uncomfortable one. Disciplined holding and quiet neglect look identical in the portfolio, in the returns, and in the number of actions, right up to the burst week when a rung should have fired and nobody was reading. Disciplined holding means you took the reading and the answer was hold. Neglect means you stopped taking it and the outcome happened to be the same.
So the test of a quiet year is never “did much happen”. It is whether the reading is alive and whether you are still taking it. If both answers are yes, an empty year is the framework doing exactly what it was built to do. If either is no, the emptiness is a symptom rather than a design.
When the year is not average at all
“Average” is a central tendency, not a promise. Some years are violent in one direction or the other, and in those years the action count climbs sharply while the quiet stretches almost disappear.
A severe drawdown fires entry rungs in close succession. The S&P 500 fell 33.9% in 33 days in early 2020, and a systematic buyer’s experience of that specific window is set out in the COVID crash case study. The 2007 to 2009 decline was a longer, grinding version of the same thing, and the 2008 case study walks through what steady buying looked like across a stretch where the reading stayed low for years rather than weeks. In a volatile asset the compression is sharper again, which is what the 2021 to 2022 bitcoin drawdown shows.
Those years are exhausting in the opposite direction. The discipline they demand is not the discipline of refusing to act; it is the discipline of acting at the prescribed size while everything in the environment says not to.
The useful move is to find out in advance how your own allocation behaves in such a year, rather than discovering it live. A portfolio stress test and a historical shock replay both do exactly that: neither forecasts anything, and both report what actually happened to a mix like yours. If the answer is that a violent year would break your plan, that is worth knowing during a quiet one.
What an average investing year cannot tell you
An honest account has to include what the exercise does not settle, because a quiet, well-run year invites more confidence than it has earned.
It does not tell you the framework is correct. A year in which you followed your rules is strong evidence that you can follow rules and weak evidence that the rules are good. Plenty of poor plans survive a calm year without being tested at all.
It does not tell you whether you are on track. That is a question about the size of the gap between where the plan lands and where you need it to land, which is arithmetic about contributions and horizons rather than about weekly readings. A plan gap calculator answers it directly, and comparing your balance to what other people your age have saved answers a different and usually less useful question.
It does not tell you the allocation is right. How much risk belongs in the portfolio at all is a separate decision, and the regulator’s plain guide to asset allocation is a better starting point than any single year of readings.
And it does not tell you which failure mode you personally are prone to. A quiet year removes the structural excuses for bad behaviour; it does not supply good temperament. Morningstar’s four behavioural investor types is a reasonable map of the common ones, and knowing which is yours is worth more than any one year’s action count.
If your own year looks nothing like this
The composite year above is texture, not a template. Your own count will differ, and a few reasons for that are worth separating from each other.
If you took far more than sixteen actions, the question is how many of them the reading actually asked for. Actions the framework requested are the plan running. Actions you added are the behaviour Barber and Odean priced at 6.5 points a year in the busiest fifth. The two are easy to tell apart after the fact, because one set has a reading attached and the other has a reason — which is exactly what grading a year of calls is for.
If you took far fewer, the question is whether the reading ever crossed a threshold. In a genuinely narrow year it may not have, and near-zero actions is then correct. If it did cross and nothing fired, either the rungs are set too far apart to ever trigger, or the reading was not being taken in the weeks that mattered.
And if the shape looks nothing like the map because you are in the first year of doing this, that is expected. The first full loop through a cycle is the part that cannot be read your way into, and it changes the experience of a quiet year considerably. Running your own numbers through the DCA simulator is a reasonable way to see what a range of years does to a plan before living through one.
The rule the quiet year runs on
An average investing year is fifty-two readings, sixteen actions, eleven weeks that contained any of them, and forty-one weeks where the correct move was to leave a correct position alone. Thirteen hours in total. One hundred and sixty-four refusals that appear nowhere in the record.
The quiet is not the framework failing to find opportunities. It is the framework correctly reporting that most weeks contain none. The compounding happens in the boring middle, and it happens invisibly, which is why the arithmetic of time in the market is so much more persuasive on paper than it is while you are living through week thirty-four of a year in which nothing has occurred.
So the one rule the quiet year runs on is this: take the reading every week, including — especially — in the weeks where you are certain it will say hold. That certainty is the point at which people stop reading, and the burst weeks do not announce themselves in advance.
If you want the weekly reading and the reasoning behind it, that is what the newsletter is for.
Educational content only. Not financial advice. The year described here is one illustrative composite, not a forecast, a record or a template; activity levels, appropriate cadences and suitable strategies vary by circumstance. Historical performance is not a guide to future results.